. 2022 Jul 4;219(7):e20220638.
doi: 10.1084/jem.20220638. Epub 2022 Jun 15.

Potent human broadly SARS-CoV-2-neutralizing IgA and IgG antibodies effective against Omicron BA.1 and BA.2

Collaborators, Affiliations

Potent human broadly SARS-CoV-2-neutralizing IgA and IgG antibodies effective against Omicron BA.1 and BA.2

Cyril Planchais et al. J Exp Med. .

Abstract

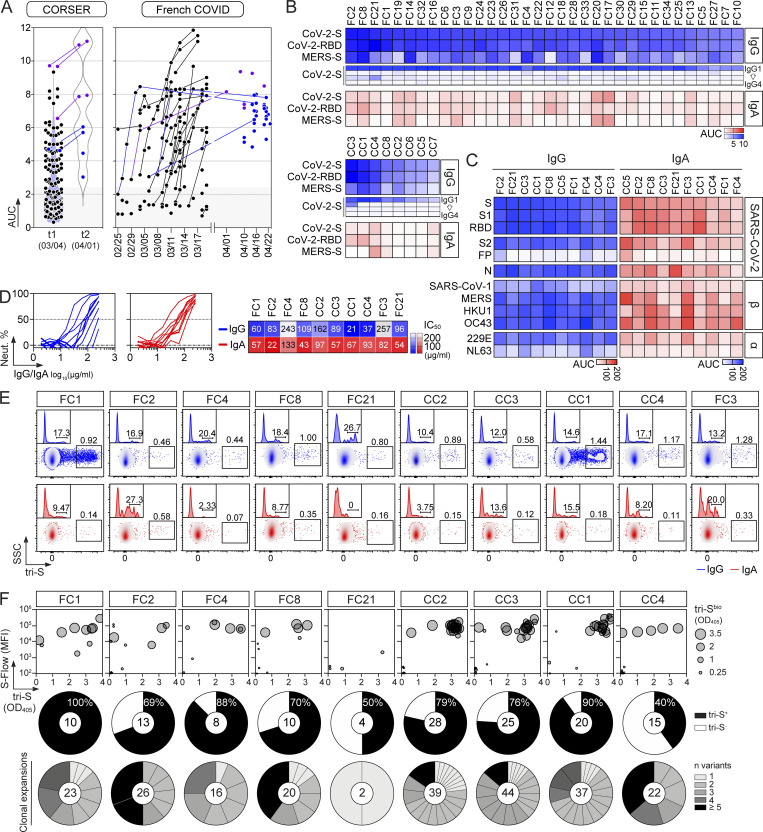
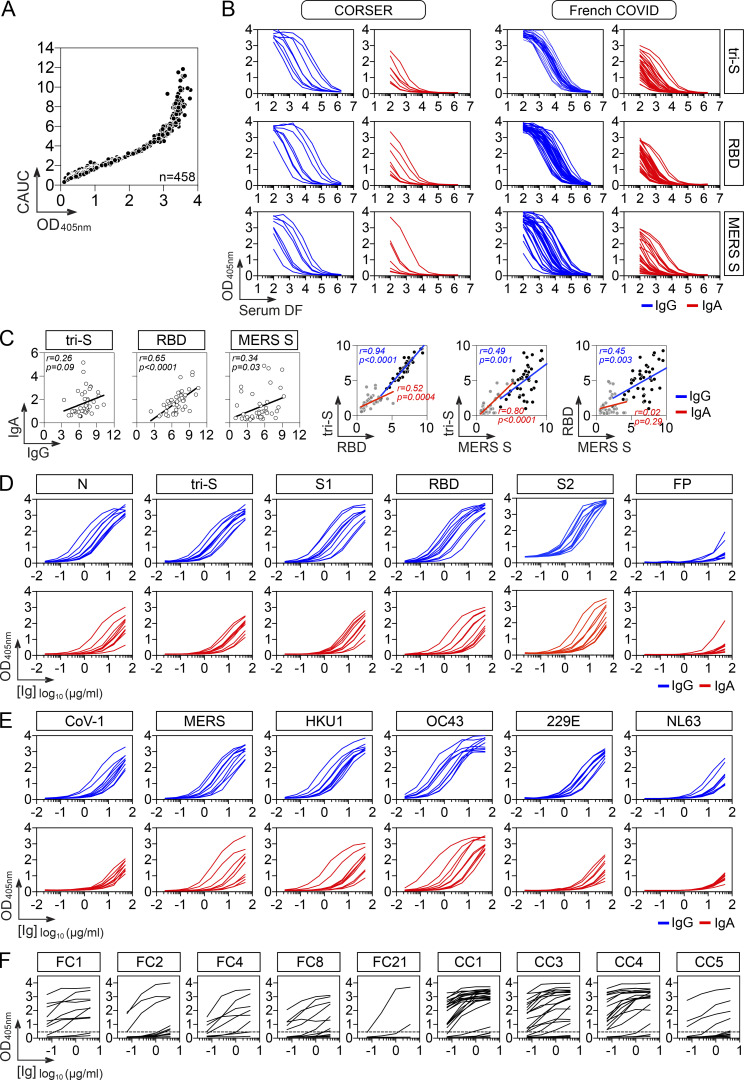
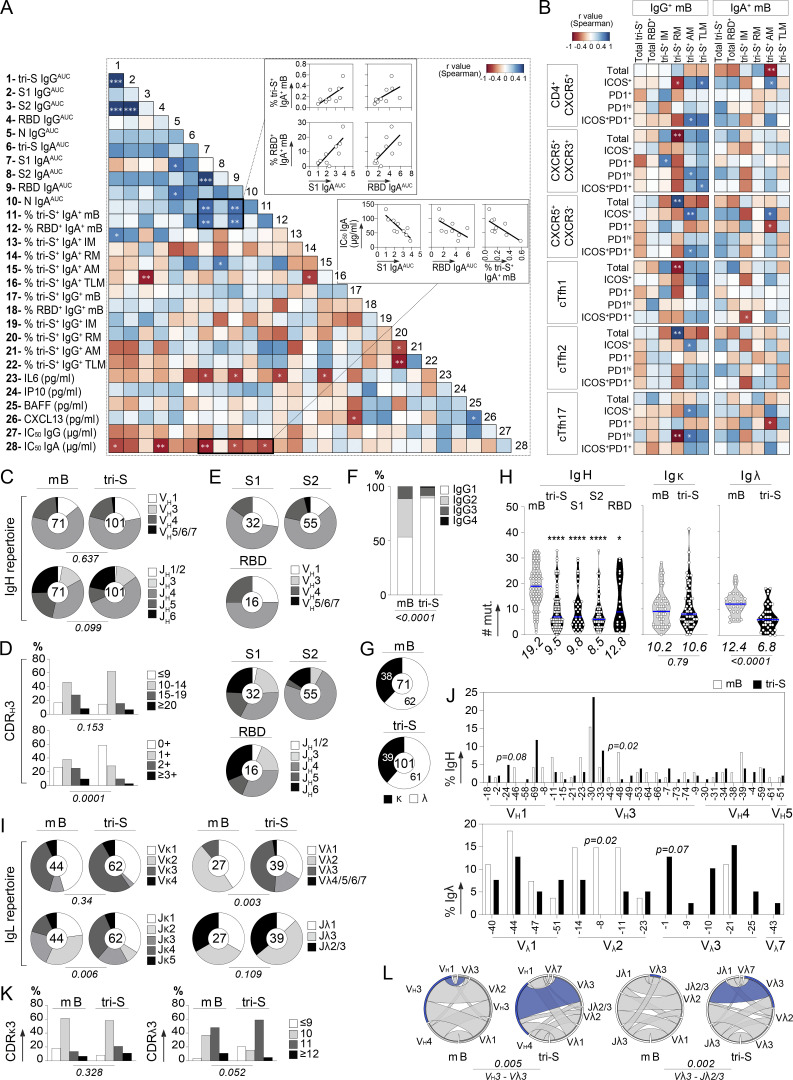
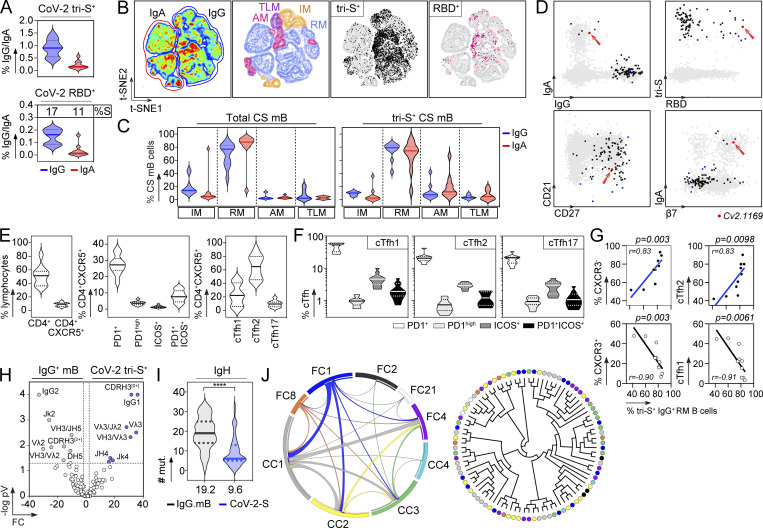
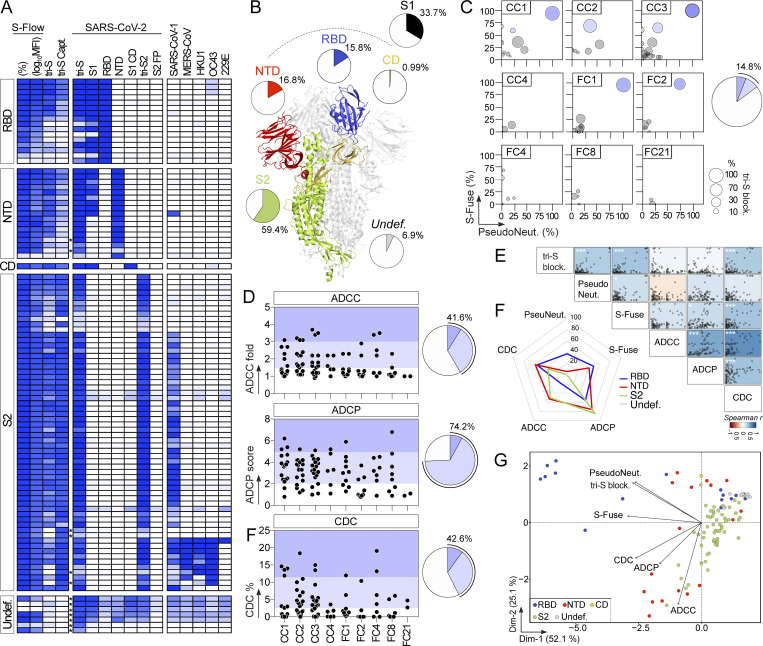
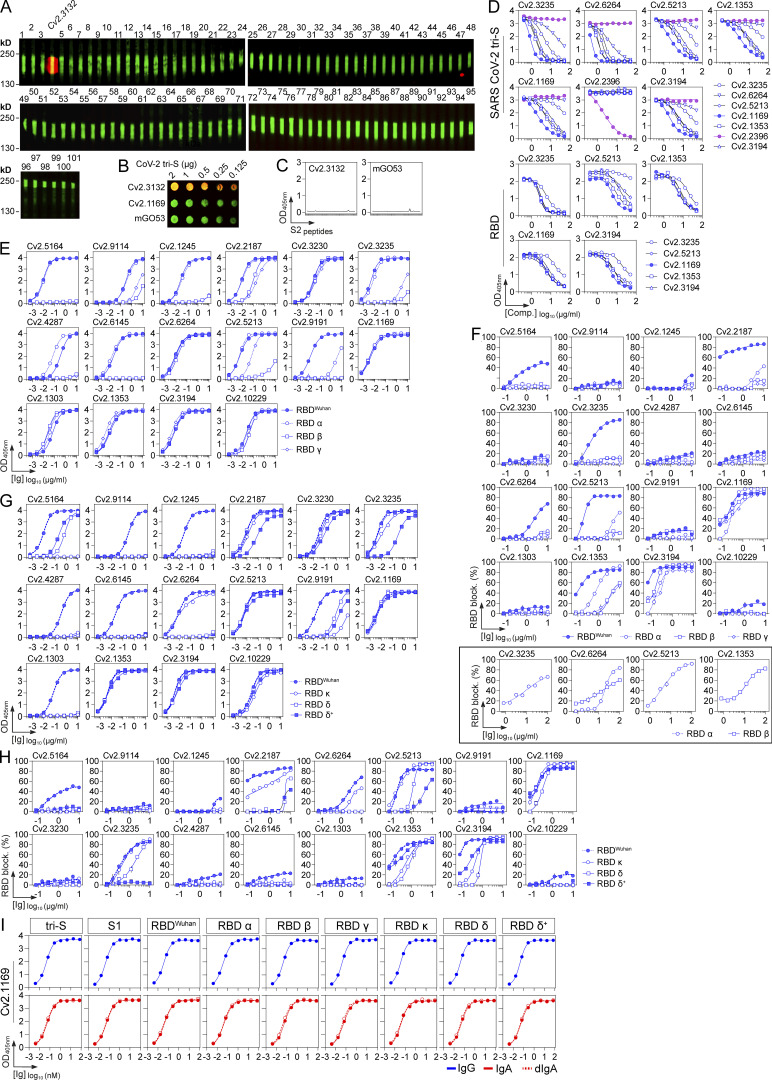
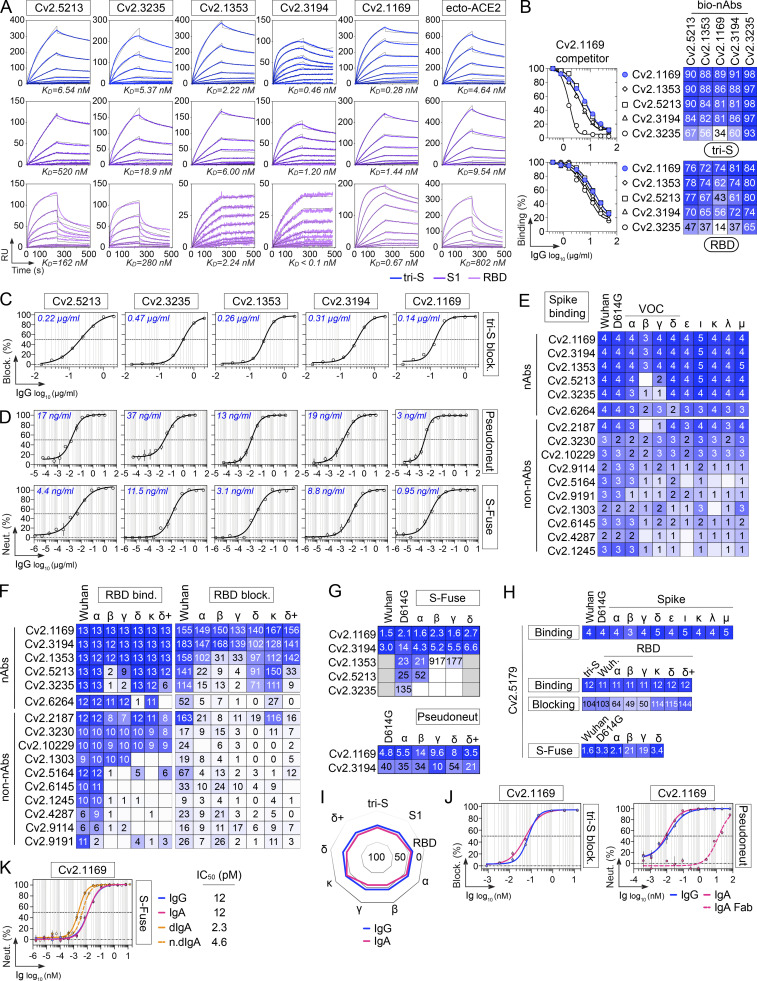
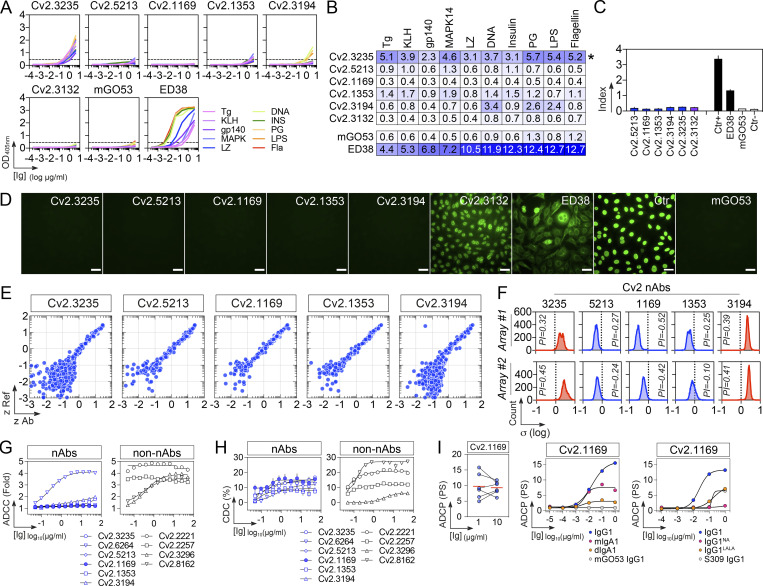
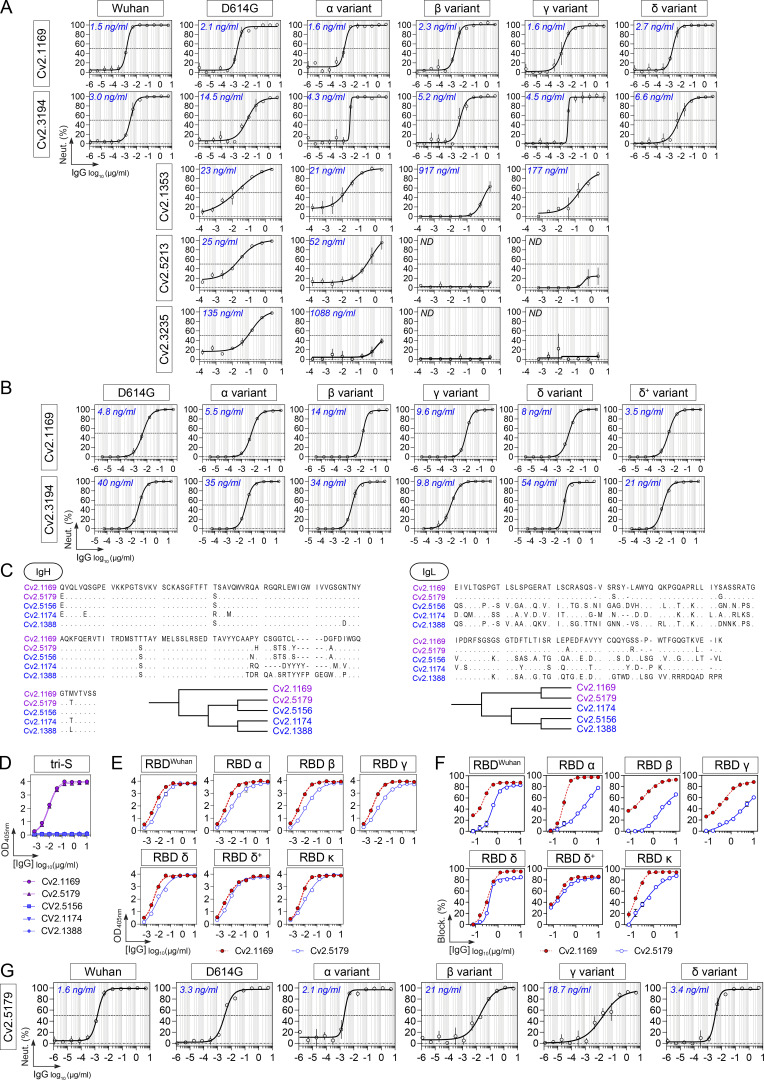
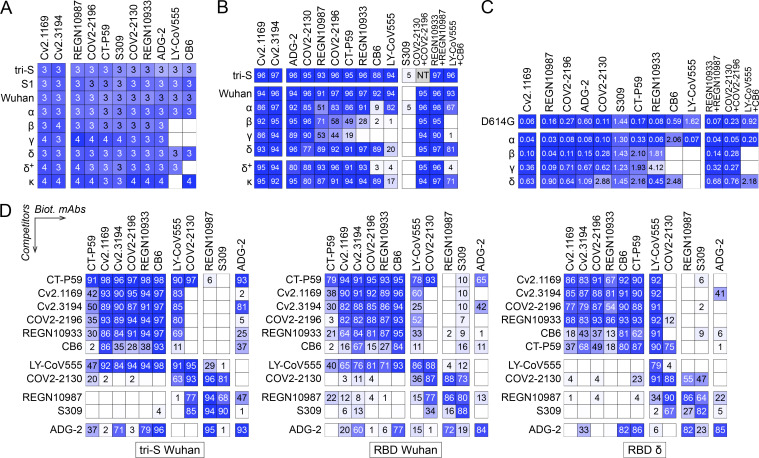
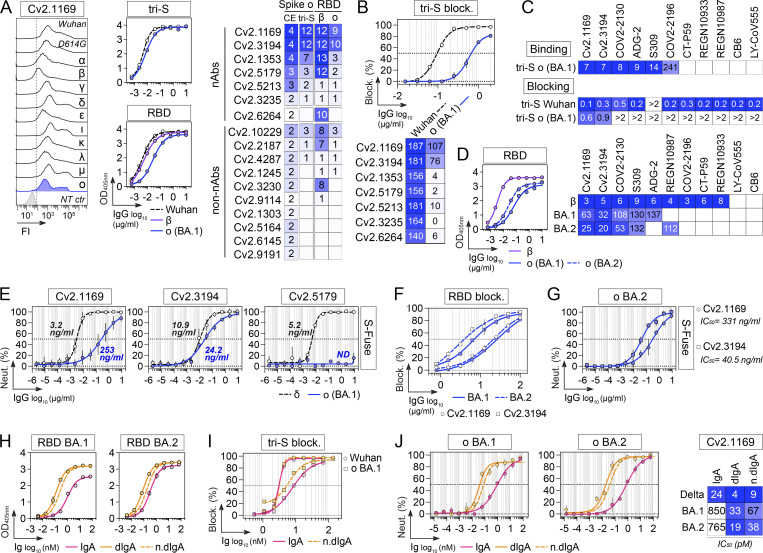
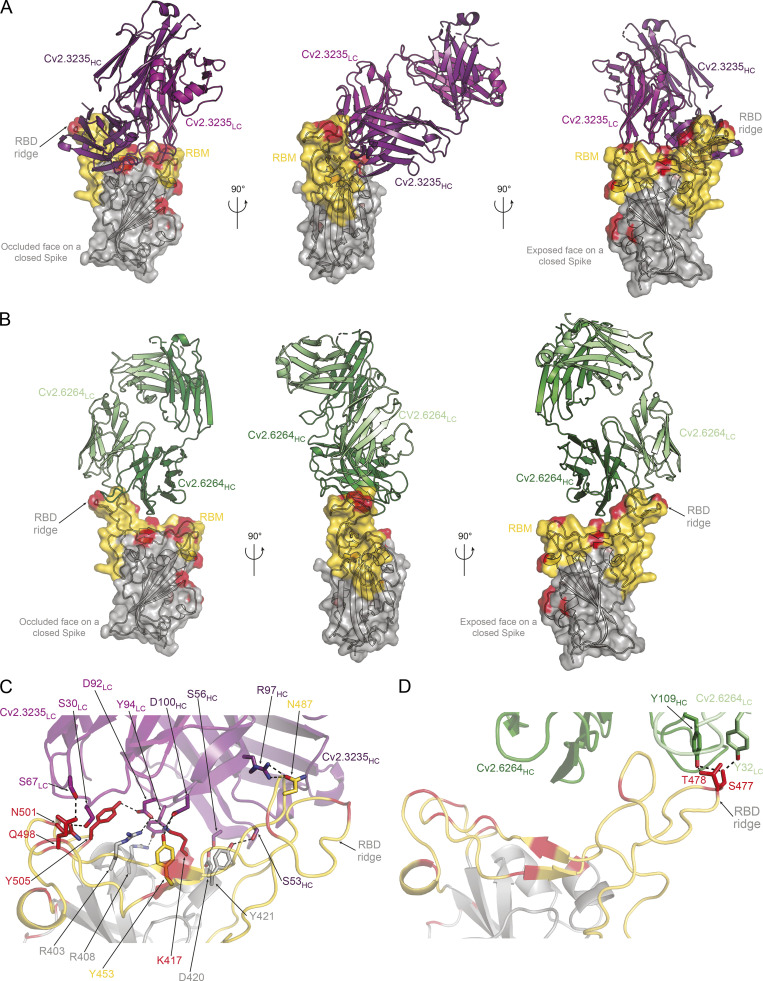
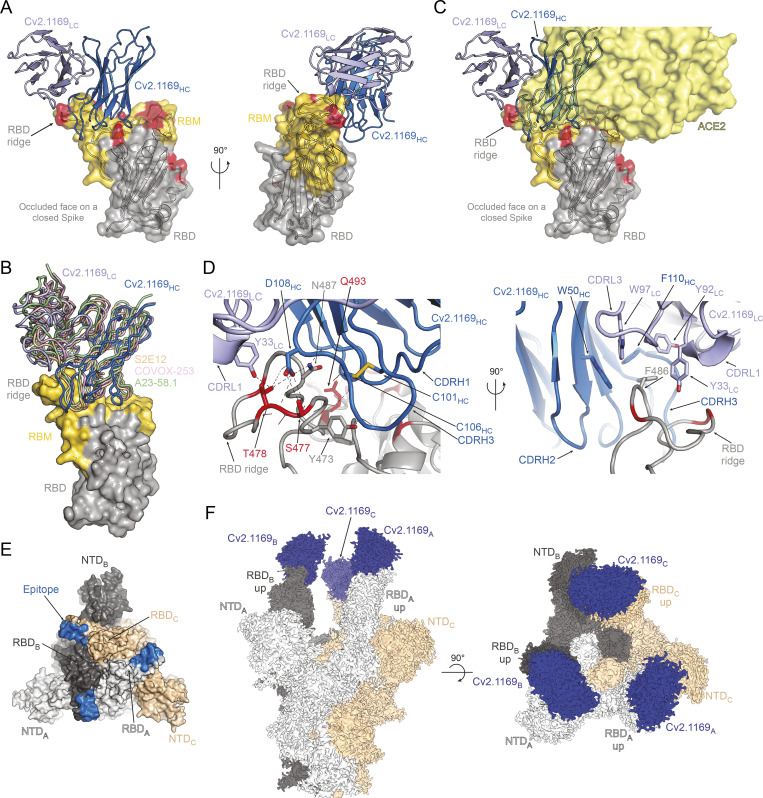
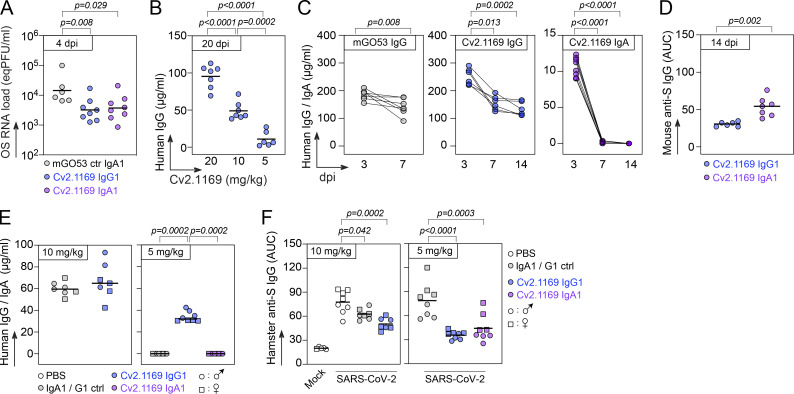
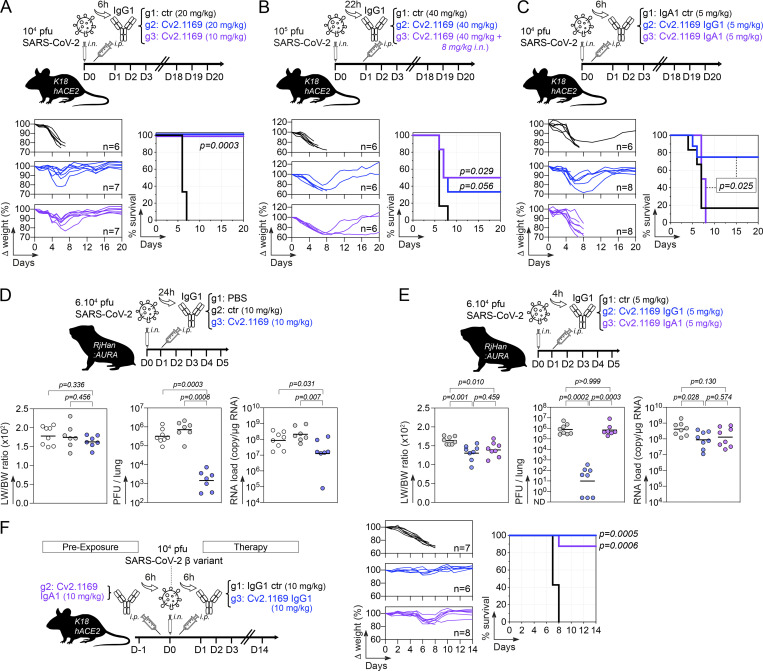
Memory B-cell and antibody responses to the SARS-CoV-2 spike protein contribute to long-term immune protection against severe COVID-19, which can also be prevented by antibody-based interventions. Here, wide SARS-CoV-2 immunoprofiling in Wuhan COVID-19 convalescents combining serological, cellular, and monoclonal antibody explorations revealed humoral immunity coordination. Detailed characterization of a hundred SARS-CoV-2 spike memory B-cell monoclonal antibodies uncovered diversity in their repertoire and antiviral functions. The latter were influenced by the targeted spike region with strong Fc-dependent effectors to the S2 subunit and potent neutralizers to the receptor-binding domain. Amongst those, Cv2.1169 and Cv2.3194 antibodies cross-neutralized SARS-CoV-2 variants of concern, including Omicron BA.1 and BA.2. Cv2.1169, isolated from a mucosa-derived IgA memory B cell demonstrated potency boost as IgA dimers and therapeutic efficacy as IgG antibodies in animal models. Structural data provided mechanistic clues to Cv2.1169 potency and breadth. Thus, potent broadly neutralizing IgA antibodies elicited in mucosal tissues can stem SARS-CoV-2 infection, and Cv2.1169 and Cv2.3194 are prime candidates for COVID-19 prevention and treatment.


Conflict of interest statement

Disclosures: C. Planchais reported a patent to PCT/EP2022/058777 licensed (SpikImm). I. Fernández reported a patent to PCT/EP2022/058777 licensed (SpikImm). T. Bruel reported a patent to PCT/EP2022/058777 licensed (SpikImm). G.D. de Melo reported a patent to PCT/EP2022/058777 licensed (SpikImm). P. Charneau reported personal fees from TheraVectys outside the submitted work; in addition, P. Charneau had a patent for seroneutralization pending. S. van der Werf reported a patent for the use of proteins and peptides coded by the genome of a novel strain of SARS-associated coronavirus issued and a patent for SARS-associated coronavirus diagnostics issued. H. Bourhy reported a patent to PCT/EP2022/058777 licensed (SpikImm) and a patent to PCT/IB2021/000314 issued. X. Montagutelli reported a patent to PCT/EP2022/058777 licensed (SpikImm). F.A. Rey reported a patent to PCT/EP2022/058777 licensed (SpikImm). O. Schwartz reported a patent to PCT/EP2022/058777 licensed (SpikImm). H. Mouquet reported grants from SpikImm and personal fees from SpikImm during the conduct of the study; in addition, H. Mouquet had a patent to PCT/EP2022/058777 licensed (SpikImm). No other disclosures were reported.

Figures

Figure 1.
Figure 1.
SARS-CoV-2 spikespecific memory B-cell antibodies cloned from convalescent COVID-19 individuals. (A) Dot plots showing the IgG antibody binding to SARS-CoV-2 tri-S as the area under the curve (AUC) values determined by ELISA with serially diluted sera from convalescent COVID-19 individuals in the CORSER (n = 212; two time-points, t1 and t2) and French COVID cohorts (n = 159; with a follow-up overtime for some samples). Colored dots (blue and purple) show selected samples tested in B. Purple dots indicate samples tested in C. (B) Heatmap showing the IgG, IgG subclass, and IgA seroreactivity of selected convalescent COVID-19 individuals from the CORSER (n = 8) and French COVID (n = 34) cohorts against SARS-CoV-2 tri-S and RBD proteins as measured in Fig. S1 B. Samples were also tested against MERS-CoV tri-S to assay for cross-reactivity against another β-coronavirus. Cells are color-coded according to AUC values with darker colors indicating high binding while light colors show moderate binding (white = no binding). (C) Heatmap showing the antibody binding of serum IgG and IgA antibodies purified from selected convalescent donors (n = 10) against SARS-CoV-2 antigens and tri-S proteins from other coronaviruses (α, α-coronaviruses; β, β-coronaviruses) as measured in Fig. S1, D and E. Cells are color-coded according to AUC values. FP, fusion peptide. (D) Graph showing the in vitro SARS-CoV-2–neutralizing activity (Neut. %) of purified serum IgG and IgA antibodies from selected COVID-19 convalescents (n = 10) measured by pseudoneutralization assay (left). Calculated IC50 values are presented in the heatmap on the right. (E) Flow-cytometric plots showing the SARS-CoV-2 S–binding IgG+ and IgA+ memory B cells (gated on alive CD19+ IgG+ or IgA+ lymphocyte singlets) in the blood of convalescent donors. Flow-cytometric histograms in the upper left-hand corner show the proportion of RBD+ cells among SARS-CoV-2 S–binding IgG+ and IgA+ memory B lymphocytes. (F) Bubble plots showing the reactivity of human IgG mAbs cloned from SARS-CoV-2 S–binding IgG+ and IgA+ memory B cells of convalescent donors against SARS-CoV-2 S protein as measured by S-Flow (y axis), tri-S ELISA (x axis) and tri-S-capture ELISA (bubble size). Values are presented in Table S1. For each donor (n = 10 total), the pie chart shows the proportion of SARS-CoV-2 S–specific mAbs from total cloned antibodies (top; total number indicated in the pie chart center) and the number (n) of variants in each SARS-CoV-2 S–specific B-cell clonal family.
Figure S1.
Figure S1.
SARS-CoV-2 reactivity of sera, purified polyclonal and mAbs from COVID-19 convalescents. (A) Graph comparing the single-dilution OD measurements (1:400; x axis) and AUC values (y axis) measured with serially diluted sera from convalescent COVID-19 individuals in the CORSER (n = 212) and French COVID cohorts (n = 159), and pre-epidemic donors (n = 100) for the ELISA IgG antibody binding to SARS-CoV-2 tri-S as previously reported (Grzelak et al., 2020). (B) ELISA graphs showing the reactivity of serum IgG (blue) and IgA (red) antibodies from selected convalescent COVID-19 individuals in the CORSER (n = 8) and French COVID (n = 34) cohorts against SARS-CoV-2 tri-S and RBD proteins. Samples were also tested against MERS tri-S to assay for cross-reactivity against another β-coronavirus. Means of duplicate values are shown. DF, dilution factor. (C) Correlation plots comparing the AUC binding values of serum IgG and IgA antibodies to SARS-CoV-2 tri-S, MERS-CoV tri-S, and RBD proteins as determined in B. P values were calculated using two-tailed Pearson correlation test. (D) ELISA graphs showing the reactivity of purified IgG (blue) and IgA (red) serum antibodies from selected donors (n = 10) against SARS-CoV-2 protein and protein subunits. Means of duplicate values are shown. (E) Same as in D but for tri-S proteins from other coronaviruses. (F) ELISA graphs showing the reactivity of antibodies cloned from SARS-CoV-2 S–captured memory B cells (n = 133) against the SARS-CoV-2 tri-S protein. Means of duplicate values are shown.
Figure S2.
Figure S2.
Humoral immune features of COVID-19 convalescents and SARS-CoV-2 S–specific memory B cells. (A) Correlograms showing the correlation analyses of the humoral immune parameters measured in COVID-19 convalescents including antibody titers, neutralizing activity, and memory B-cell subset frequencies. For each pair of compared parameters, Spearman correlation coefficients (color coded) with their corresponding P value are shown. ***, P < 0.001; **, P < 0.01; *, P < 0.05. (B) Heatmap showing the correlation analyses between the frequency of memory B-cell and cTfh cell subsets (%) measured in COVID-19 convalescents. Cells are color-coded according to the value of Spearman correlation coefficients with the corresponding P values indicated in the center. **, P < 0.01; *, P < 0.05. (C) Pie charts comparing the distribution of VH/JH gene usage of blood SARS-CoV-2 spike–specific IgG+/IgA+ memory B cells and IgG+ memory B cells from SARS-CoV-2–unexposed healthy individuals (mB; Prigent et al., 2016). The number of antibody sequences analyzed is indicated in the center of each pie chart. Groups were compared using 2 × 5 Fisher’s Exact test. (D) Bar graph comparing the distribution of CDRH3 lengths (top) and positive charge numbers (bottom) between blood SARS-CoV-2 spike–specific IgG+/IgA+ memory B cells and IgG+ memory B cells from unexposed individuals (mB; Prigent et al., 2016). Groups were compared using 2 × 5 Fisher’s Exact test. (E) Same as in C but according to the anti-spike antibody specificity (S1, S2, or RBD). (F) Bar graph comparing the distribution of IgG subtypes between blood SARS-CoV-2 spike–specific IgG+/IgA+ memory B cells and IgG+ memory B cells from unexposed individuals (mB; Prigent et al., 2016). Groups were compared using 2 × 5 Fisher’s Exact test. (G) Pie charts showing the κ- vs. λ-Ig chain usage of blood SARS-CoV-2 spike–specific IgG+/IgA+ memory B cells and IgG+ memory B cells from unexposed individuals (mB; Prigent et al., 2016). Groups were compared using 2 × 2 Fisher’s Exact test. (H) Violin plots comparing the number of mutations in VH, Vκ, and Vλ genes in SARS-CoV-2 spike–, S1–, S2–, and RBD–specific and control memory B cells. Numbers of mutations were compared across groups of antibodies using the unpaired Student t test with Welch’s correction. ****, P < 0.0001; *, P < 0.05. (I) Same as in C but for Vκ/Jκ and Vλ/Jλ gene usages. (J) Bar graphs comparing the distribution of single immunoglobulin genes, VH (top) and VL (bottom), expressed by SARS-CoV-2 spike–specific and control IgG+ memory B cells. Groups were compared using 2 × 2 Fisher’s Exact test. (K) Same as in D but for CDRκ3 and CDRλ3 lengths. (L) Circos plots comparing the VH(DH)JH and VLJL rearrangement frequencies between SARS-CoV-2 spike–specific IgA+/IgG+ memory B cells and IgG+ memory B cells from unexposed individuals (mB; Prigent et al., 2016). Groups were compared using 2 × 5 Fisher’s Exact test.
Figure 2.
Figure 2.
Immunophenotyping and antibody gene repertoire of SARS-CoV-2 spikespecific memory B cells. (A) Violin plots showing the percentage of SARS-CoV-2 tri-S+ cells among total IgG+ and IgA+ memory B cells (top) and of SARS-CoV-2 RBD+ cells among tri-S+ IgG+ and IgA+ memory B cells (bottom) in the blood of convalescent COVID-19 individuals (n = 10). (B) Pseudocolor plots showing the t-SNE analysis of concatenated VividCD19+CD10 B cells in convalescent COVID-19 individuals (n = 10). Density maps presenting the staining intensity of CD27 and CD21 markers used to define memory B-cell subsets. IM (intermediate memory, CD27CD21+), RM (resting memory CD27+CD21+), AM (activated memory, CD27+CD21), and TLM (tissue-like memory CD27CD21). Black and pink dots indicate tri-S+ and RBD+ IgG+ and IgA+ B memory cells in the density maps. (C) Violin plots showing the distribution of total and SARS-CoV-2 tri-S+ IgG+ and IgA+ memory B-cell subset frequencies as depicted in B. CS mB, class-switched memory B cells in convalescent COVID-19 individuals (n = 10). (D) Immunophenotyping flow cytometric plots showing the expression of B-cell surface markers on sorted SARS-CoV-2 tri-S–specific B cells (n = 101, black, blue, and red dots). Blue dots indicate potent neutralizing antibodies while the red dot is the ultra-potent neutralizer Cv2.1169 (red arrow). (E) Violin plots showing the frequency of total CD4+, CD4+CXCR5+ lymphocytes, and cTfh cell subsets in the blood of convalescent COVID-19 individuals (n = 10). (F) Violin plots comparing the frequency of PD1+, PD1hi, ICOS+, and ICOS+PD1+ cells among cTh1, cTfh2, and cTh17 cell subsets in the blood of convalescent COVID-19 individuals (n = 10). (G) Correlation plots showing the frequency of SARS-CoV-2 tri-S+ IgG+ RM B cells vs. CXCR3+ cTfh, CXCR3 cTfh, cTfh1, and cTfh2 cells. Spearman correlation coefficients with the corresponding P values are indicated. (H) Volcano plot analysis comparing the immunoglobulin gene repertoire of SARS-CoV-2 S–specific IgG+/IgA+ B cells from convalescent donors and IgG+ memory B cells from healthy individuals (IgG.mB, unexposed to SARS-CoV-2; Prigent et al., 2016). Gray and blue dots indicate statistically significant differences between both Ig gene repertoires. pV, P value; FC, fold changes. (I) Violin plots comparing the number of mutations in VH genes of SARS-CoV-2 S–specific (n = 101) and control IgG+ memory B cells from unexposed healthy individuals (n = 72; Prigent et al., 2016). The average number of mutations is indicated below. Numbers of mutations were compared across groups of antibodies using unpaired student t test with Welch’s correction. ****, P < 0.0001. (J) Circos plot (left) showing the clonal variants shared between distinct donors with the size of the links proportional to the number of clones sharing 75% CDRH3 amino acid identity. Cladogram (right) showing the distribution of individual shared clones between donors (n = 9).
Figure 3.
Figure 3.
Reactivity and antiviral properties of SARS-CoV-2 Sspecific memory B-cell antibodies. (A) Heatmap showing the ELISA reactivity of human anti-S mAbs (n = 101) against purified recombinant SARS-CoV-2 antigens and tri-S proteins from other coronaviruses (α-coronaviruses: SARS-CoV-1, MERS-CoV, HKU1; and β-coronaviruses: OC43, 229E). FP, fusion peptide. Cells are color-coded according to the binding values presented in Table S1 with darker colors indicating strong reactivities (white = no binding). Asterisks indicate the antibodies tested at a higher IgG concentration. Undef., undefined region. (B) Schematic diagram showing the distribution of specificities of anti-S antibodies (n = 101) on the highlighted regions of the SARS-CoV-2 spike as determined in A (ribbon representation of the PDB ID: 6VXX structure). (C) Bubble plots showing the neutralization activity of human SARS-CoV-2 S–specific antibodies (n = 101) tested at a concentration of 10 µg/ml in the S-Fuse (y axis), and pseudoneutralization (x axis, PseudoNeut.) assays against SARS-CoV-2. The bubble size corresponds to the blocking capacity of SARS-CoV-2 S-ACE2 interactions by the antibodies as measured by ELISA. Corresponding values are presented in Table S1. Pie chart (right) shows the distribution of non-active (white) vs. neutralizing (shades of blue) antibodies according to neutralization percentage measured with the S-Fuse assay. (D) Dot plot showing the in vitro Fc-dependent effector activities of anti-S IgG antibodies (n = 101). Pie charts (right) show for each measured effector function the distribution of non-active (white) vs. active (shades of blue) antibodies. (E) Matrix showing the correlation analyses between neutralization activities and Fc-dependent effector functions measured for SARS-CoV-2 S–specific IgG antibodies (n = 101). Spearman correlation coefficients (color coded) with their corresponding P values are shown. ***, P < 0.001; *, P < 0.05. (F) Radar plots comparing the in vitro neutralizing and Fc-dependent effector activities of anti-S IgG antibodies (n = 101) according to the targeted spike regions. Percent of antibodies per specificity group mediating a given antiviral activity as determined in D is shown. (G) PCA 2D-plot showing the antiviral-related variables discriminating anti-S mAbs (n = 101) color-coded by specificities. The two dimensions account for 77.2% of the variability. The location of the variables is associated with the distribution of the antibodies.
Figure S3.
Figure S3.
Binding characteristics of potent anti-RBD antibody neutralizers. (A) Infrared immunoblot showing the reactivity of SARS-CoV-2 S–specific IgG antibodies (n = 101) to denatured SARS-CoV-2 tri-S protein. Immunoreactive green bands correspond to denatured SARS-CoV-2 tri-S protein revealed with an anti-6xHis tag antibody. The red band (yellow when merged) indicates the SARS-CoV-2 antibody Cv2.3132 recognizing denatured tri-S protein. (B) Infrared dot blot showing the reactivity of Cv2.3132 antibody to denatured SARS-CoV-2 tri-S at various concentrations. mGO53 is a non–SARS-CoV-2 isotype control. Cv2.1169 was included for comparison. (C) Graphs showing the reactivity of Cv2.3132 IgG antibody against 5 amino acid–overlapping 15-mer S2 peptides (n = 52). mGO53 is a non–SARS-CoV-2 isotype control. Means ± SD of duplicate values are shown. (D) Competition ELISA graphs showing the IgG binding to SARS-CoV-2 tri-S (top) and RBD (bottom) of selected biotinylated SARS-CoV-2 S–specific antibodies in presence of the corresponding non-biotinylated IgG antibodies as potential competitors. Means ± SD of duplicate values are shown. (E) ELISA graphs showing the reactivity of SARS-CoV-2 RBD-specific IgG antibodies to RBD proteins from SARS-CoV-2 viral variants α, β, and γ. Means ± SD of duplicate values are shown. (F) Competition ELISA graphs showing the binding of biotinylated RBD proteins from SARS-CoV-2 and viral variants (α, β, and γ) to soluble ACE2 ectodomain in presence of SARS-CoV-2 S–specific IgG antibodies as potential competitors. Framed graphs show selected IgG competitors tested at a higher concentration against α and β RBD proteins. Means ± SD of duplicate values are shown. (G) Same as in E but for RBD proteins from SARS-CoV-2 viral variants κ, δ, and δ+. (H) Same as in F but for RBD proteins from SARS-CoV-2 viral variants κ, δ, and δ+. (I) ELISA graphs comparing the reactivity of the monomeric IgG/IgA and dimeric IgA (dIgA) antibody forms of Cv2.1169 to SARS-CoV-2 tri-S, S1, and RBD, and to RBD proteins from SARS-CoV-2 viral variants (α, β, γ, δ, δ+, and κ). Means ± SD of duplicate values are shown.
Figure 4.
Figure 4.
Binding and neutralizing activities of potent anti-RBD neutralizers. (A) SPR sensorgrams comparing the relative affinity of purified neutralizing anti-RBD IgG mAbs (n = 5) for the binding to trimeric SARS-CoV-2 S (tri-S; blue), S1 (purple) and RBD (pink) proteins. Calculated KD values are indicated at the bottom. ecto-ACE2, purified recombinant ACE2 ectodomain. (B) Representative competition ELISA graphs (left) comparing the IgG binding to SARS-CoV-2 tri-S (top) and RBD (bottom) of selected biotinylated anti-RBD antibodies (n = 5) in presence of Cv2.1169 as a potential competitor. Means ± SD of duplicate values are shown. Heatmaps (right) showing the competition of selected anti-RBD nAbs (n = 5) for tri-S and RBD binding as measured in Fig. S3 D. Dark blue indicates stronger inhibition; lighter colors indicate weaker competition, and white indicates no competition. (C) Competition ELISA graphs showing the binding of biotinylated SARS-CoV-2 tri-S protein to the immobilized soluble ACE2 ectodomain in presence of anti-RBD antibodies used as competitors. Means ± SD of duplicate values are shown. (D) Graphs showing the neutralization curves of Wuhan SARS-CoV-2 by selected anti-RBD IgG antibodies (n = 5) as determined with the pseudo-neutralization (top) and S-Fuse neutralization (bottom) assays. Error bars indicate the SD of assay triplicates. IC50 values are indicated in the top left-hand corner (in blue). (E) Heatmap comparing the binding of RBD-specific IgG antibodies to the cell-expressed spike proteins of SARS-CoV-2 and selected viral variants as measured by flow cytometry. Geometric means of duplicate log10 ΔMFI values are shown in each cell. (F) Heatmaps comparing the binding (left) and RBD-ACE2 blocking capacity (right) of RBD-specific IgG antibodies for the RBD proteins of SARS-CoV-2 and selected viral variants as measured in Fig. S3, E and H. Darker blue colors indicate high binding or competition while light colors show moderate binding or competition (white = no binding or competition). AUC values are shown in each cell. (G) Heatmaps comparing the IC50 neutralizing values of the selected anti-RBD antibodies against SARS-CoV-2 and selected VOCs with the pseudo-neutralization (top) and S-Fuse neutralization (bottom) assays as measured in Fig. S4, A and B. (H) Heatmap showing the binding to spike and RBD proteins (top), RBD-ACE2 blocking capacity (middle), and neutralizing activity (bottom) for Cv2.5179 antibody as measured in Fig. S4, D–G. (I) Radar plot comparing the binding of monomeric Cv2.1169 IgG and IgA antibodies to SARS-CoV-2 tri-S, S1, and RBD proteins, and to RBD from selected viral variants as measured in Fig. S4 I. (J) Competition ELISA graphs (left) comparing the binding of biotinylated SARS-CoV-2 tri-S protein to the immobilized soluble ACE2 ectodomain in presence of Cv2.1169 IgG or IgA as a competitor. Means ± SD of duplicate values are shown. Graphs (right) comparing the SARS-CoV-2–neutralizing activity of Cv2.1169 IgG, IgA, and IgA Fab as determined with the pseudo-neutralization assay. Error bars indicate the SD of duplicate values. (K) Graphs comparing the SARS-CoV-2–neutralizing activity of monomeric and dimeric IgA (dIgA) Cv2.1169 antibodies as determined with the S-Fuse neutralization assay. Error bars indicate the SD of triplicate values. n.dIgA, normalized values according to the number of binding sites.
Figure 5.
Figure 5.
Off-target binding and Fc-effector functions of potent SARS-CoV-2–neutralizing antibodies. (A) Representative ELISA graphs showing the reactivity of selected SARS-CoV-2–neutralizing antibodies (n = 5) against double-stranded DNA (DNA), flagellin (Fla), YU2 HIV-1 Env (gp140), insulin (INS), keyhole limpet hemocyanin (KLH), lipopolysaccharide (LPS), lysozyme (LZ), MAPK-14 (MAPK), proteoglycan (PG), and thyroglobulin (Tg). mGO53 (Wardemann, 2003) and ED38 (Meffre et al., 2004) are negative and positive control antibodies, respectively. Anti–SARS-CoV-2 S antibody Cv2.3132 showing HEp-2 reactivity in C was included for comparison. The mean of duplicate values are shown. (B) Heatmap comparing the AUC values determined from the ELISA binding analyses shown in A. Darker blue colors indicate high binding while light colors show moderate binding (white = no binding). (C) Bar graph showing the HEp-2 reactivity of selected SARS-CoV-2 antibodies as measured by ELISA. Means ± SD of duplicate values are shown. Ctr+ and Ctr− are the positive and negative control of the kit, respectively. (D) Microscopic images showing the reactivity of selected SARS-CoV-2–neutralizing mAbs (n = 5) to HEp2-expressing self-antigens assayed by indirect immunofluorescence assay. The negative (mGO53), low-positive (ED38), and kit’s positive (Ctr+) controls were included in the experiment. HEp-2–reactive anti–SARS-CoV-2 S antibody Cv2.3132 was also included for comparison. The scale bars represent 40 µm. (E) Representative microarray plots showing the z-scores given on a single human protein by the reference (Ref: mGO53, y axis) and test antibody (x axis). Each dot represents the average of duplicate array proteins. (F) Frequency histograms showing the log10 protein displacement (σ) of the MFI signals for the selected SARS-CoV-2 antibodies compared to non-reactive antibody mGO53 obtained from two independent experiments (array #1 and #2). The PI corresponds to the Gaussian mean of all microarray protein displacements. Blue and red histograms indicate non-polyreactive and polyreactive mAbs, respectively. (G) Graphs comparing the natural killer cell–mediated ADCC activity of selected neutralizing (nAbs) and non-neutralizing (non-nAbs) SARS-CoV-2 S–specific antibodies (n = 10). Means ± SD of duplicate values are shown. (H) Same as in G but for the CDC activity. (I) ADCP activity of Cv2.1169. The dot plot (left) shows the monocyte-mediated ADCP activity of Cv2.1169 IgG at a concentration of 1 and 10 µg/ml. Each dot corresponds to a donor of primary monocytes (n = 6). Graph comparing the ADCP activity of Cv2.1169 expressed as recombinant IgG1, IgG1NA, IgG1LALA, monomeric IgA1 (mIgA1), and dimeric IgA1 (dIgA1) antibodies. mGO53 is the negative isotype control, and ADCP-inducing IgG1 antibody S309 was included for comparison. PS, phagocytic score. Means of duplicate values are shown.
Figure S4.
Figure S4.
Cross-neutralizing activity of potent SARS-CoV-2 neutralizers. (A) Graphs showing the neutralization curves of SARS-CoV-2 and selected VOCs by potent anti-RBD IgG antibodies as determined with the S-Fuse neutralization assay. Error bars indicate the SD of duplicate values. IC50 values are indicated in the top left-hand corner (in blue). ND, not determined. (B) Graphs showing the neutralization curves of SARS-CoV-2 and selected VOCs by Cv2.1169 and Cv2.3194 IgG antibodies as determined with the pseudo-neutralization assay. Error bars indicate the SD of duplicate values. IC50 values are indicated in the top left-hand corner (in blue). (C) Amino acid alignment of the heavy chains (IgH, left) and light chains (IgL, right) of the VH1-58–encoded human antibodies produced from SARS-CoV-2 spike–captured memory B-cell antibodies. Dendrograms showing the relationship between VH1-58–encoded human antibodies generated from the IgH and IgL sequence alignments are shown at the bottom. (D) ELISA graphs showing the reactivity of VH1-58–encoded antibodies against the SARS-CoV-2 tri-S protein. Means ± SD of duplicate values are shown. (E) ELISA graphs comparing the binding of Cv2.5179 and Cv2.1169 antibodies to RBD proteins. Means ± SD of duplicate values are shown. (F) Competition ELISA graphs showing the binding of biotinylated SARS-CoV-2 tri-S and RBD proteins to the immobilized soluble ACE2 ectodomain in presence of Cv2.5179 or Cv2.1169 antibody as a competitor. Means ± SD of duplicate values are shown. (G) Graphs showing the neutralization curves of SARS-CoV-2 and VOCs by Cv2.5179 IgG antibody as determined with the S-Fuse neutralization assay. Means ± SD of duplicate values are shown. IC50 values are indicated in the top left-hand corner (in blue).
Figure 6.
Figure 6.
Comparative analyses of Cv2.1169 and Cv2.3194 with benchmarked antibodies. (A) Heatmap comparing the ELISA binding to the selected SARS-CoV-2 proteins of Cv2.1169, Cv2.3194, and benchmarked neutralizing antibodies in clinical use or in development. Darker blue colors indicate high binding while light colors show moderate binding or competition (white = 0, no binding). Means of duplicate AUC values are shown in each cell. (B) Heatmap comparing the tri-S- and RBD-ACE2 blocking capacity of Cv2.1169, Cv2.3194 and benchmarked neutralizing antibodies. Darker blue colors indicate high competition while light colors show moderate competition (white = 0, no competition). Means of duplicate values (% binding inhibition) are shown in each cell. NT, not tested. (C) Heatmap comparing the in vitro neutralizing activity of Cv2.1169 and benchmarked neutralizing antibodies against the selected SARS-CoV-2 viral variants. Means of triplicate IC50 values in pM are shown in each cell. White color indicates that 50% neutralization was not reached at the maximum antibody concentration of 25 nM. (D) Heatmaps showing the competition potential of Cv2.1169, Cv2.3194, and benchmarked neutralizing antibodies for the ELISA binding to tri-S and RBD proteins. Darker blue colors indicate high competition while light colors show moderate competition (white = 0, no competition). Means of duplicate values (% binding inhibition) are shown in each cell.
Figure 7.
Figure 7.
Activity of Cv2.1169 and Cv2.3194 against SARS-CoV-2 Omicron variants. (A) Heatmap (right) comparing the binding of RBD-specific IgG antibodies (n = 17) to the cell-expressed (CE) and soluble (tri-S) Omicron (ο) SARS-CoV-2 spike proteins as measured by flow cytometry (mean log10 ΔMFI from duplicate values) and ELISA (mean AUC from duplicate values), respectively, as shown on the left for Cv2.1169. NT ctr, non-transfected cell control. The heatmap also presents the comparative antibody reactivity (AUC values) against β and ο RBD proteins. White indicates no binding. (B) Heatmap (bottom) comparing the RBD-ACE2 blocking capacity of neutralizing anti-RBD antibodies (n = 7) for the RBD proteins of SARS-CoV-2 and ο variant BA.1 as shown for Cv2.1169 (top; means ± SD of duplicate values are shown). Darker blue colors indicate high competition while light colors show moderate competition (white = no binding or competition). Mean AUC from duplicate values are shown in each cell. (C) Heatmaps comparing the tri-S binding (top) and tri-S-ACE2 blocking capacity (bottom) of Cv2.1169 and Cv2.3194 with benchmarked RBD-specific SARS-CoV-2 IgG neutralizers (n = 9) to the SARS-CoV-2 proteins of the ο variant BA.1. Darker blue colors indicate high binding or competition while light colors show moderate binding or competition (white = no binding or competition). Mean EC50 from duplicate values are shown in each cell. (D) Heatmap (right) comparing the binding of Cv2.1169 and Cv2.3194 with benchmarked SARS-CoV-2 neutralizers for the RBD proteins of the ο variant BA.1 and BA.2 as measured by ELISA (means of duplicate AUC values) as shown on the left for Cv2.1169. Darker blue colors indicate high binding while light colors show moderate binding (white = no binding). Mean EC50 from duplicate values are shown in each cell. (E) Graphs showing the neutralization curves of SARS-CoV-2 δ and ο BA.1 by potent anti-RBD IgG antibodies as determined with the S-Fuse neutralization assay. Error bars indicate the SD of duplicate values from 2 (Cv2.5179) or 5 (Cv2.1169 and Cv2.3194) independent experiments. IC50 values are indicated (in blue for ο BA.1). (F) Competition ELISA graphs showing the binding of biotinylated RBD proteins from SARS-CoV-2 o BA.1 and BA.2 variants to soluble ACE2 ectodomain in presence of Cv2.1169 and Cv2.3194 antibodies as competitors. Means ± SD of duplicate values are shown. (G) Same as in E but for Cv2.1169 and Cv2.3194 against BA.2. Error bars indicate the SD of duplicate values. (H) Graphs comparing the ELISA binding of monomeric and dimeric Cv2.1169 IgA antibodies to the RBD proteins of SARS-CoV-2 o BA.1 and BA.2 variants. Means ± SD of duplicate values are shown. n.dIgA, normalized values according to the number of binding sites. (I) Same as in F but for Wuhan and o BA.1 tri-S proteins with monomeric and dimeric Cv2.1169 IgA antibodies. Means ± SD of duplicate values are shown. n.dIgA, normalized values according to the number of binding sites. (J) Same as in G but for Cv2.1169 IgA monomers and J-chain dimers (dIgA) against BA.1 and BA.2. Error bars indicate the SD of duplicate values. Heatmap (right) presents the IC50 values calculated from the curves (left). n.dIgA, normalized values according to the number of binding sites.
Figure 8.
Figure 8.
Structural analyses of the RBD-Cv2.3235 and RBD-Cv2.6264 complexes. (A) Crystal structure of the complex formed by the RBD and Cv2.3235 Fab (PDB ID: 7QF0). The RBD is represented in cartoon with a transparent gray surface, highlighting the RBM (yellow), and residues that are mutated in the VOCs (red). (B) Same as in A but for the RBD-Cv2.6264 complex (PDB ID: 7QF1). (C) Polar interactions (dashed lines) formed at the interface of the RBD-Cv2.3235 complex. For simplicity, only the interactions that involve side chains on both proteins are represented. (D) Same as in C but for the RBD-Cv2.6264 complex.
Figure 9.
Figure 9.
Structural analyses of the Cv2.1169 epitope. (A) Crystal structure of the complex formed by the RBD and Cv2.1169 (PDB ID: 7QEV). The RBD is represented in cartoon with a transparent surface, highlighting the RBM (yellow) and residues that are mutated in the VOCs (red). The constant domain from Cv2.1169 could not be built on the residual electron density and the variable domains are indicated in different shades of blue (IgH, dark blue; IgL, light blue). (B) Superposition of the RBD-Cv2.1169 crystal structure with the complexes formed by other VH1-58-encoded antibodies (S2E12 [PDB ID: 7R6X], COVOX-253 [PDB ID: 7BEN] and A23-58.1 [PDB ID: 7LRS]). (C) Superposition of the RBD-Cv2.1169 and RBD-ACE2 (PDB ID: 6M0J) structures, showing the ACE2 receptor on surface representation (light yellow) and its clashes with the antibody. (D) Close-up at the RBD-Cv2.1169 interface. For clarity, only the side chains from residues forming hydrogen bonds (dashed lines) are shown as sticks. Residues mutated in the VOCs are in red and the CDRH3 disulfide bond is indicated with yellow sticks (left). Details of the hydrophobic residues that anchor F486 at the interface between the light and heavy chains of Cv2.1169 (right). (E) Identification of the Cv2.1169 epitope (blue) on the structure of a closed spike (PDB ID: 6VXX). The different protomers are identified with a subscript letter and colored in light gray (protomer A), dark gray (protomer B), and wheat (protomer C). (F) Cryo-EM map from the tri-S ectodomain in complex with Cv2.1169 (EMDB ID: EMD-14853).
Figure S5.
Figure S5.
Cv2.1169 antibody treatment in SARS-CoV-2–infected mice and hamsters. (A) Dot plot comparing the SARS-CoV-2 RNA levels in the oral swabs (OS) of SARS-CoV-2–infected K18-hACE2 mice (at 4 dpi) treated with 5 mg/kg i.p. of Cv2.1169 IgG or IgA (n = 8/group) or mGO53 control (ctr) IgA antibody (n = 6) as shown in Fig. 10 C. Each dot corresponds to a mouse. Means of duplicate values are shown. (B) Dot plot comparing the human IgG concentrations in the serum of SARS-CoV-2–infected K18-hACE2 mice (at 20 dpi) receiving once 5, 10, or 20 mg/kg i.p. of antibody Cv2.1169 (n = 7/group) as shown in Fig. 10, A and C. Each dot corresponds to a mouse. Means of duplicate values are shown. (C) Dot plot comparing the human IgG and IgA concentrations in the serum of K18-hACE2 mice infected with the SARS-CoV-2 β variant, and pre-treated (IgA, n = 8) or treated (IgG, n = 6) with Cv2.1169, or with mGO53 IgG control (ctr, n = 7) as shown in Fig. 10 F. Each dot corresponds to a mouse. Means of duplicate values are shown. (D) Dot plot showing the ELISA SARS-CoV-2 tri-S binding of serum murine IgG antibodies in K18-hACE2 mice infected with the SARS-CoV-2 β variant, and pre-treated (IgA, n = 8) or treated (IgG, n = 6) with Cv2.1169 as shown in Fig. 10 F. Each dot corresponds to a mouse. Means of duplicate values are shown. (E) Dot plot comparing the human IgG and IgA concentrations in the serum of SARS-CoV-2–infected golden Syrian hamsters (at 5 dpi) treated once with Cv2.1169 or mGO53 control (5 mg/kg i.p., n = 8; or 10 mg/kg i.p., n = 7) as shown in Fig. 10, D and E (left and right, respectively). Each symbol corresponds to a mouse. Means of duplicate values are shown. (F) Dot plot showing the ELISA SARS-CoV-2 tri-S binding of serum hamster IgG antibodies in SARS-CoV-2–infected hamsters (at 5 dpi) treated once with Cv2.1169 or mGO53 control (5 mg/kg i.p., n = 8; or 10 mg/kg i.p., n = 7) as shown in Fig. 10, D and E (left and right, respectively). Each symbol corresponds to a mouse. Means of duplicate values are shown.
Figure 10.
Figure 10.
In vivo therapeutic activity of potent SARS-CoV-2 neutralizer Cv2.1169. (A) Schematic diagram showing the experimental design of Cv2.1169 antibody therapy in SARS-CoV-2–infected K18-hACE2 mice (top). Animals were infected i.n. with 104 PFU of SARS-CoV-2 and 6 h later received an i.p. injection of Cv2.1169 or isotypic control IgG antibody at ∼10 mg/kg (0.25 mg) and ∼20 mg/kg (0.5 mg). Graphs showing the evolution of initial body weight (% Δ weight, bottom left) and survival rate (bottom right) in animal groups. Groups of mice were compared in the Kaplan-Meier analysis using log-rank Mantel-Cox test. (B) Same as in A but with K18-hACE2 mice infected with 105 PFU and treated 22 h later with 1 mg i.p. of Cv2.1169 IgG antibody (∼40 mg/kg). (C) Same as in A but with infected mice treated with Cv2.1169 IgG and IgA antibodies at ∼5 mg/kg (0.125 mg). (D) Schematic diagram shows the experimental design of Cv2.1169 antibody therapy in SARS-CoV-2–infected golden Syrian hamsters (top). Animals (seven or eight per group) were infected i.n. with 6 × 10⁴ PFU of SARS-CoV-2 and 24 h later received an i.p. injection of PBS, Cv2.1169 or isotypic control IgG antibody at ∼10 mg/kg (1 mg). Dot plots showing LW/BW ratio × 100 (left), infectivity (center), and RNA load (right) measured in animal groups at 5 dpi. Groups of hamsters were compared using two-tailed Mann-Whitney test. (E) Same as in D but with infected animals treated 4 h later with Cv2.1169 IgG and IgA antibodies at ∼5 mg/kg (0.5 mg). (F) Same as in A but with K18-hACE2 mice infected with 104 PFU of the SARS-CoV-2 variant β (B.1.351), and either pre-treated 6 h before infection with ∼10 mg/kg (0.25 mg) of Cv2.1169 IgA or treated 6 h after infection with ∼10 mg/kg (0.25 mg) of Cv2.1169 IgG or isotype control (ctr).

References

    1. Andreano, E., Nicastri E., Paciello I., Pileri P., Manganaro N., Piccini G., Manenti A., Pantano E., Kabanova A., Troisi M., et al. 2021. Extremely potent human monoclonal antibodies from COVID-19 convalescent patients. Cell. 184:1821–1835.e16. 10.1016/j.cell.2021.02.035 - DOI - PMC - PubMed
    1. Anna, F., Goyard S., Lalanne A.I., Nevo F., Gransagne M., Souque P., Louis D., Gillon V., Turbiez I., Bidard F.C., et al. 2021. High seroprevalence but short-lived immune response to SARS-CoV-2 infection in Paris. Eur. J. Immunol. 51:180–190. 10.1002/eji.202049058 - DOI - PMC - PubMed
    1. Baer, A., and Kehn-Hall K.. 2014. Viral concentration determination through plaque assays: Using traditional and novel overlay systems. J. Vis. Exp. e52065. 10.3791/52065 - DOI - PMC - PubMed
    1. Barnes, C.O., West A.P., Huey-Tubman K.E., Hoffmann M.A.G., Sharaf N.G., Hoffman P.R., Koranda N., Gristick H.B., Gaebler C., Muecksch F., et al. 2020a. Structures of human antibodies bound to SARS-CoV-2 spike reveal common epitopes and Recurrent features of antibodies. Cell. 182:828–842.e16. 10.1016/j.cell.2020.06.025 - DOI - PMC - PubMed
    1. Barnes, C.O., Jette C.A., Abernathy M.E., Dam K.M.A., Esswein S.R., Gristick H.B., Malyutin A.G., Sharaf N.G., Huey-Tubman K.E., Lee Y.E., et al. 2020b. SARS-CoV-2 neutralizing antibody structures inform therapeutic strategies. Nature. 588:682–687. 10.1038/s41586-020-2852-1 - DOI - PMC - PubMed

Publication types

Supplementary concepts