. 2022 Jun 14;55(6):1032-1050.e14.
doi: 10.1016/j.immuni.2022.05.013.

Indoleamine 2,3-dioxygenase 1 activation in mature cDC1 promotes tolerogenic education of inflammatory cDC2 via metabolic communication

Affiliations

Indoleamine 2,3-dioxygenase 1 activation in mature cDC1 promotes tolerogenic education of inflammatory cDC2 via metabolic communication

Marco Gargaro et al. Immunity. .

Abstract

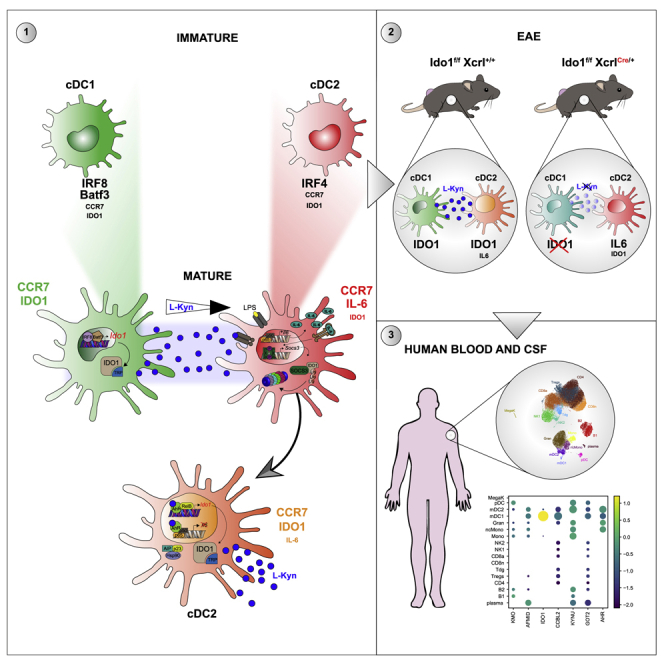
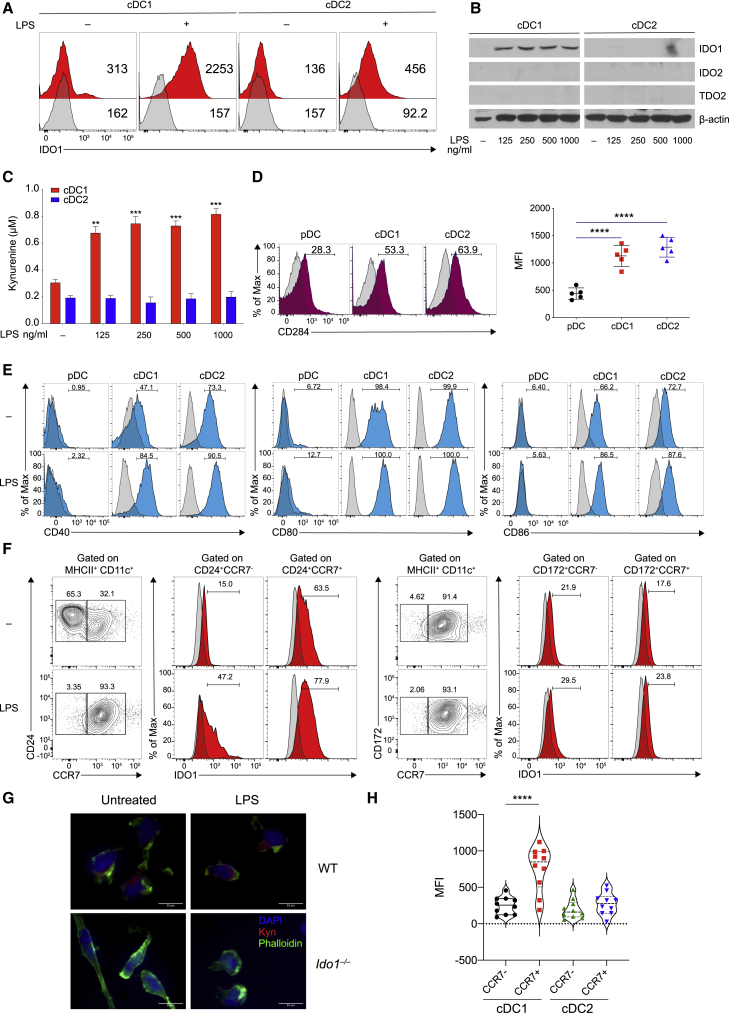
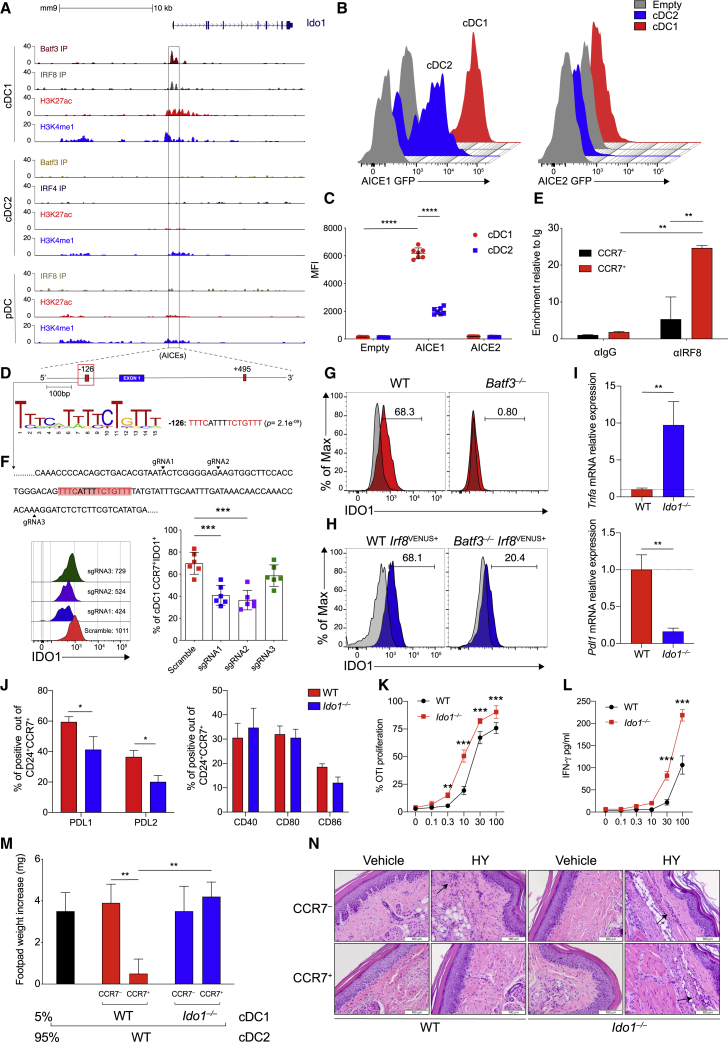
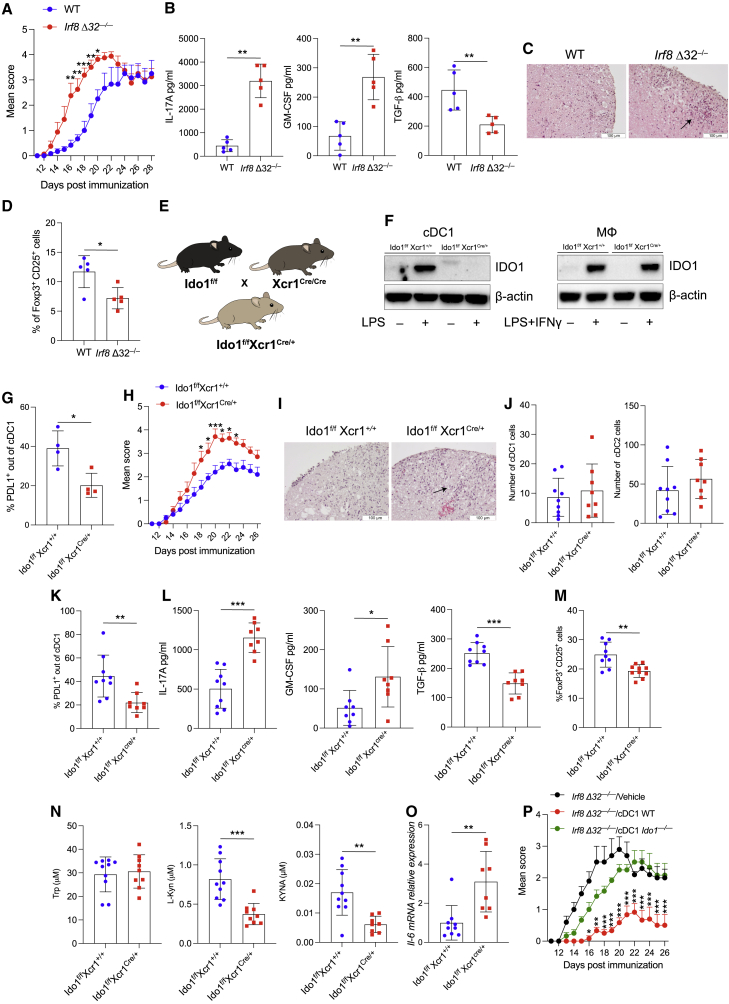
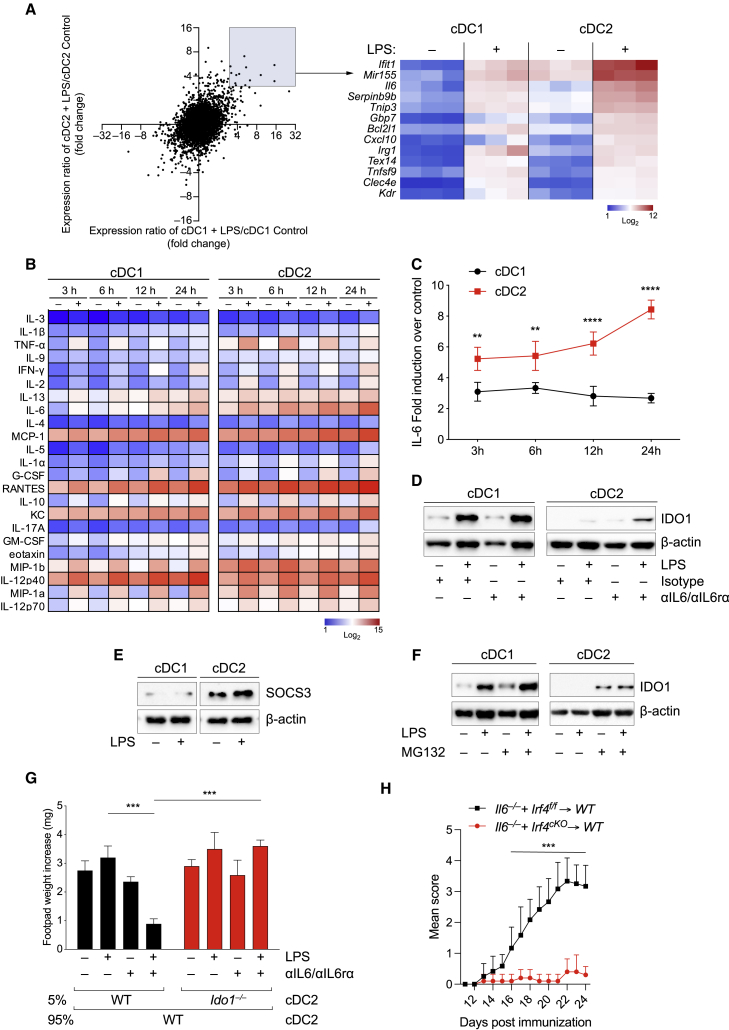
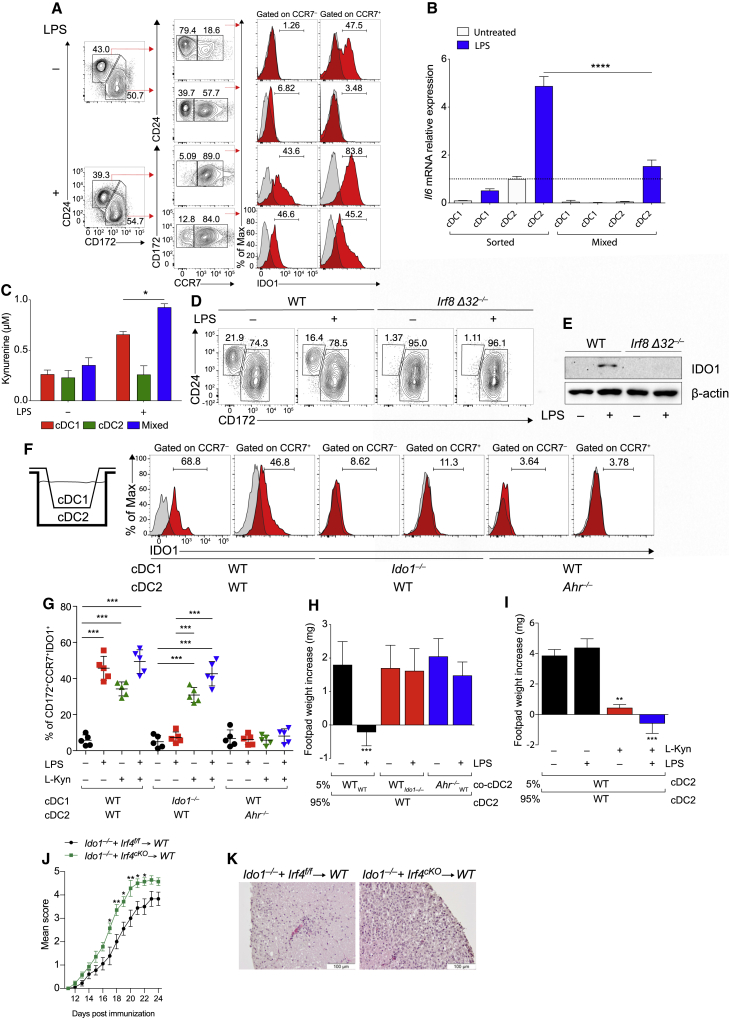
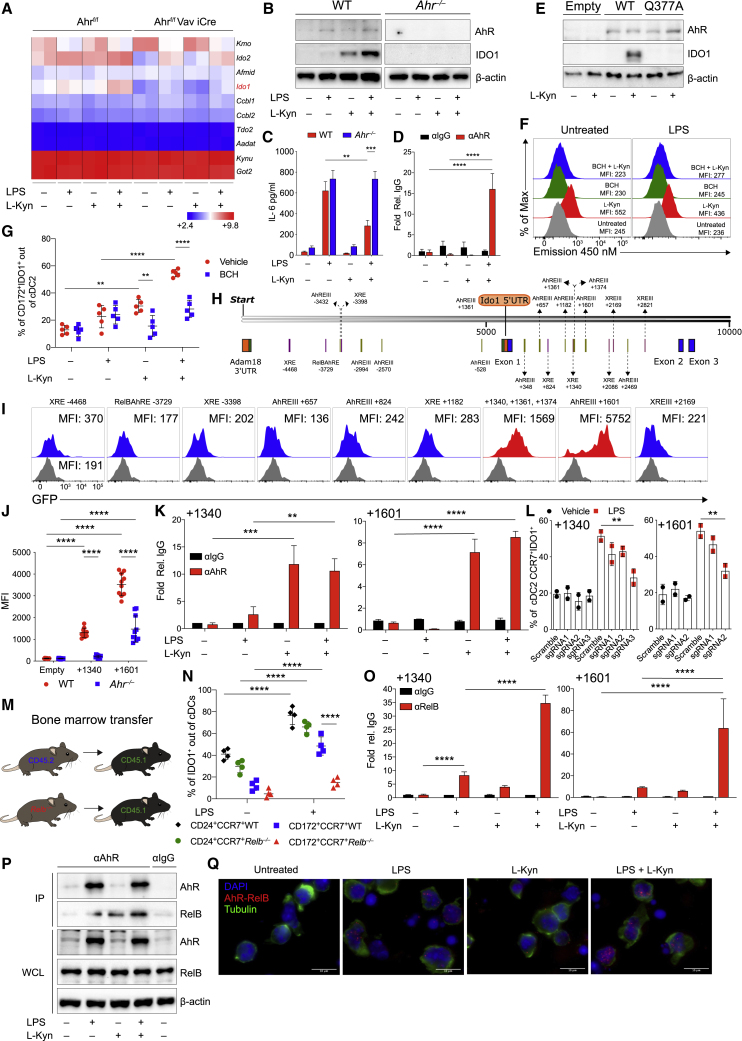
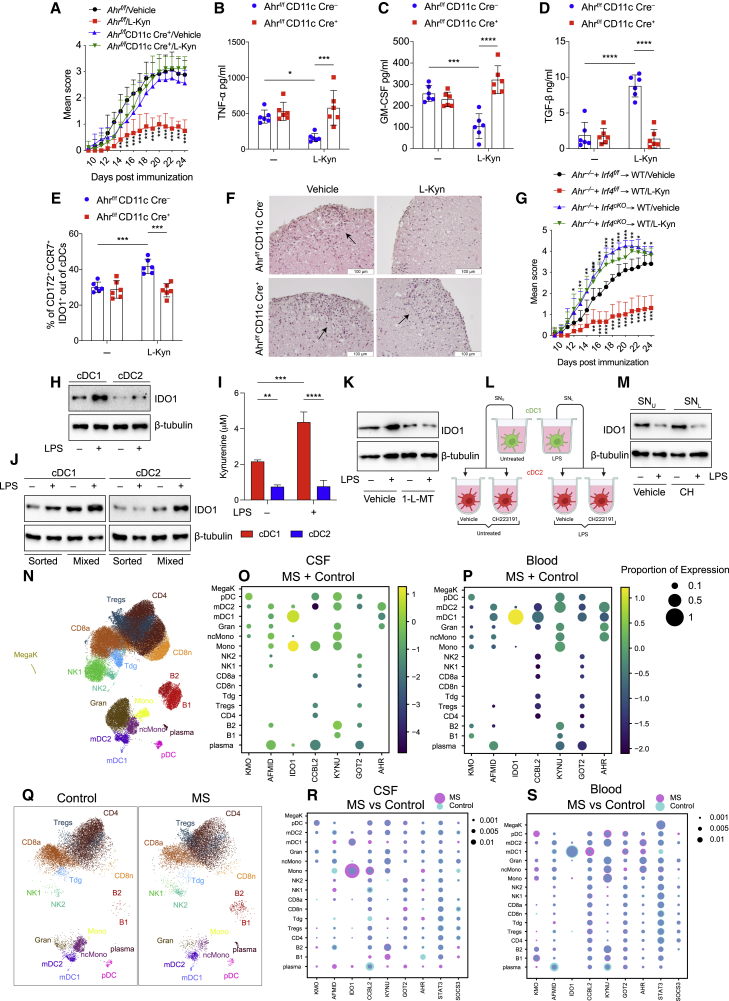
Conventional dendritic cells (cDCs), cDC1 and cDC2, act both to initiate immunity and maintain self-tolerance. The tryptophan metabolic enzyme indoleamine 2,3-dioxygenase 1 (IDO1) is used by cDCs in maintaining tolerance, but its role in different subsets remains unclear. At homeostasis, only mature CCR7+ cDC1 expressed IDO1 that was dependent on IRF8. Lipopolysaccharide treatment induced maturation and IDO1-dependent tolerogenic activity in isolated immature cDC1, but not isolated cDC2. However, both human and mouse cDC2 could induce IDO1 and acquire tolerogenic function when co-cultured with mature cDC1 through the action of cDC1-derived l-kynurenine. Accordingly, cDC1-specific inactivation of IDO1 in vivo exacerbated disease in experimental autoimmune encephalomyelitis. This study identifies a previously unrecognized metabolic communication in which IDO1-expressing cDC1 cells extend their immunoregulatory capacity to the cDC2 subset through their production of tryptophan metabolite l-kynurenine. This metabolic axis represents a potential therapeutic target in treating autoimmune demyelinating diseases.

Keywords: AhR; IDO1; IL-6; RelB; dendritic cells; immunotolerance; kynurenine; metabolites; neuroinflammation; tryptophan metabolism.


Conflict of interest statement

Declaration of interests The authors declare no competing interests.

Figures

None
Graphical abstract
Figure 1
Figure 1
IDO1 is selectively induced in cDC1 cells following LPS stimulation (A) IDO1 expression was analyzed by IS in BMDCs (n = 5). (B) Immunoblot analysis was carried out for IDO1, IDO2, TDO2, and β-actin expression (n = 3). (C) Supernatants from cells prepared as in (B) were analyzed for l-kynurenine content by HLPC. (D and E) Flow plot (left) and quantification (right) of CD284 (D), and flow plot of CD40, CD80, and CD86 (E) on DC subsets (n = 3). (F) BM-derived cDC1 and cDC2 were treated as in (B) and IDO1 expression evaluated in CCR7 and CCR7+ populations treated as in (B), pre-gated on cDC1 and cDC2 (n = 3). (G) Immunofluorescence analysis of l-kynurenine expression in sorted CCR7+ cDC1 of different genotypes treated as in (B) (n = 3). (H) IDO1 expression (MFI) in thymic CCR7 and CCR7+ dendritic cell subsets, gated on CD11c+MHCII+XCRI+CD117 and CD11c+MCHII+CD172+CD117 (n = 3). Data are shown as mean ± SD. ∗∗ p < 0.01, ∗∗∗ p < 0.001, ∗∗∗∗ p < 0.0001, one-way (D and H) or two-way (C) ANOVA followed by Bonferroni multiple comparison test. Isotype control as gray histogram. Please also see Figure S1.
Figure 2
Figure 2
IRF8 imprints constitutive IDO1 expression in cDC1 (A) ChIP-seq tracks display open chromatin areas and bindings of IRF8, BATF3, IRF4, H3K27ac, and H3K4me1 around Ido1 locus. Boxed areas at −126 bp or +495 bp from IDO1 TSS indicate regions assessed for enhancer activity. (B and C) Flow cytometric analysis showing GFP-reporter activities (B) and quantification (C) in cDC1s and cDC2s expressing IDO1 −126 bp and + 495-bp enhancers (n = 7). (D) FIMO analysis depicting p values of the two predicted AICEs (red boxes) in mouse Ido1 chr8: 25,694,453–25,713,138 (−126 bp from Ido1 TSS). (E) IRF8 enrichment at the AICEs sequences of Ido1 promoter in sorted CCR7+ and CCR7 cDC1 (n = 2). (F) IDO1 expression (MFI) in CCR7+ cDC1s differentiated from Rosa26Cas9−GFP/+ CD117hi BM progenitors expressing scramble RNA or sgRNA(s) (black arrowheads) targeting Ido1 −126 bp AICE1, as depicted in the single-color histograms (n = 3). (G and H) IDO1 expression by flow in WT and Batf3/ (H) and WT Irf8VENUS+ and Batf3/Irf8VENUS+ cDC1 (n = 3). (I) Tnf and Pdl1 mRNA expression in sorted CCR7+ cDC1 of indicated phenotypes (n = 4). (J) PDL1, PDL2, CD40, CD80, and CD86 expressions by flow in CCR7+ cDC1 (n = 3). (K) Sorted WT or Ido1/ cDC1 assayed for presentation to OT-I T cells in response to soluble OVA protein (n = 2). (L) IFN-γ production in supernatants from (K) (n =2). (M) Analysis of DTH is presented as change in footpad weight. n = 5 mice/group for (n = 2). (N) H&E staining of mice footpad from mice in (M). Data are shown as means ± SD. p < 0.05, ∗∗ p < 0.01, ∗∗∗ p < 0.001, ∗∗∗∗ p < 0.0001, two-way ANOVA followed by Bonferroni multiple comparison test (C, E, F, J, K, and L) or Tukey’s multiple comparison test (M) and unpaired t test (I). Isotype control is shown as gray histogram. Please also see Figure S2.
Figure 3
Figure 3
Selective IDO1 gene deletion in cDC1 worsens EAE (A) EAE score in WT and Irf8 Δ32−/− mice. Five mice per group, n = 3. (B) IL-17, GM-CFS, and TGF-β in supernatant of cervical LNs from EAE mice in (A) at day 28 and restimulated in vitro with MOG 20 μg/mL for 5 days. (C) H&E staining of spinal cord sections from EAE mice in (A). (D) Flow cytometric analysis of FoxP3+CD25+ cells in cervical LNs of mice immunized as in (A). (E) Schematic representation of Ido1f/fXcr1Cre/+ strain generation. (F) IDO1 immunoblot. Left: cDC1 untreated or treated with LPS 250 ng/mL for 48 h. Right: macrophages (MΦ) untreated or treated with LPS 250 ng/mL and IFN-γ 15 ng/mL for 48 h β-actin was used as loading control (n = 3). (G) Flow cytometric analysis of PDL1+ in thymic cDC1. (H) EAE score in Ido1f/f Xcr1+/+ and Ido1f/fXcr1cre/+ mice. 9 mice per group, n = 2. (I) H&E staining of spinal cord sections from mice treated in (H). (J) Quantification of cDC1 and cDC2 in spinal cords from EAE mice in (H) at day 26. (K) PDL1+ cDC1 frequency out cDC1 by flow cytometry in spinal cords of EAE mice in (H). (L) Cytokine analysis in supernatants from cervical LNs of EAE mice in (H) at day 26 stimulated as in (B). (M) Flow cytometric analysis of FoxP3+CD25+ cells in cervical LNs of mice immunized as in (H). (N) Tryptophan metabolites in plasma from EAE mice in (H) at day 26. (O) Il6 mRNA expression in cervical LNs from EAE mice in (H). (P) EAE score in Irf8 Δ32/ mice transferred with cDC1 genotypes at days 4 and 7 post immunization. 5 mice per group, n = 3. Data are mean ± SD. p < 0.05, ∗∗ p < 0.01, ∗∗∗ p < 0.001, two-way ANOVA followed by Bonferroni multiple comparison test (A, H, and P) or unpaired t test (B, D, G, and J–O). Each dot represents an individual value. Please also see Figure S3.
Figure 4
Figure 4
IL-6 production by cDC1 and cDC2 regulates differential IDO1 expression (A) Gene expression microarray analysis of cDC1 and cDC2 untreated or treated with LPS (250 ng/mL) for 24 h. Bright blue (lowest) to bright red (highest). (B) Heatmap of cytokines in supernatants from cDC1 and cDC2 cultures treated as (A) (n = 2). (C) IL-6-fold induction in LPS (250 ng/mL) stimulated cDC1 and cDC2 over the untreated control (n = 3). (D) IDO1 immunoblot in cDC1 and cDC2 treated as depicted for 48 h (n = 3). (E) SOCS3 immunoblot in cDC1 and cDC2 treated as depicted for 24 h (n = 3). (F) IDO1 immunoblot in cDC1 and cDC2 treated as depicted for 48 h (n = 4). (G) Analysis of skin reactivity is presented as change in footpad weight. n = 6 mice per group (n = 2). (H) EAE score of mixed bone marrow chimeras with bone marrow of indicated genotypes. 6 mice per group, n = 2. Data are shown as means ± SD. ∗∗ p < 0.01, ∗∗∗ p < 0.001, ∗∗∗∗ p < 0.0001, two-way ANOVA followed by Bonferroni multiple comparison test (C and H) or Tukey’s multiple comparison test (G). β-Actin used as loading control (D–F). Please also see Figure S4.
Figure 5
Figure 5
cDC2s cultured with cDC1s under LPS stimulation exhibit conditional and AhR-dependent IDO1 induction (A) IDO1 expression analyzed by IS in BMDCs (n = 5). (B) Il6 mRNA expression in sorted cDC1 and cDC2 treated in isolation or purified mixed LPS-treated or LPS-untreated BMDCs (n =3). (C) l-kynurenine content in supernatants from B (n = 3). (D) Flow cytometric analysis of cDCs differentiated from WT and Irf8 Δ32−/− treated as depicted for 48 h. (E) IDO1 and β-actin immunoblot in BMDCs as in (D) (n = 3). (F) IDO1 expression by IS in cDC2 harvested from cDC1 and cDC2 co-cultures in trans-well plates with or without LPS for 48 h (n = 3). (G) CCR7+IDO1+cDC2 cell frequency in cultures established as in (F) treated as depicted (n = 3). (H) Skin reactivity in mice treated with cDC2 either alone or in combination with 5% of WT, Ido1/ or Ahr/ cDC2 (co-cDC2) conditioned with cDC1 as in (F). 6 mice per group, n = 2. (I) Skin reactivity in mice transferred with cDC2 combinations treated as depicted. 6 mice per group, n = 2. (J) EAE score of mixed bone marrow chimeras with bone marrow of indicated genotypes. 8 mice per group, n = 2. (K) H&E staining of spinal cord sections from mice treated in (J). Data are shown as means ± SD. p < 0.05, ∗∗ p < 0.01, ∗∗∗ p < 0.001, ∗∗∗∗ p < 0.0001, one-way (B) or two-way (G and J) ANOVA followed by Bonferroni multiple comparison test. Two-way ANOVA followed by Tukey’s multiple comparison test (C, H, and I). Isotype control as gray histogram. Please also see Figure S5.
Figure 6
Figure 6
AhR cooperates with RelB to induce IDO1 in isolated cDC2 treated with l-kynurenine (A) Heatmap of tryptophan metabolic enzymes gene expression in cDC2 from AhRf/f mice versus Ahrf/fVav1 iCre mice treated as depicted. Bright blue (lowest) to bright red (highest). (B) IDO1 immunoblot in cDC2 treated as shown for 48 h (n = 4). (C) IL-6 analysis in supernatants of cDC2 treated as in (A) for 48 h (n = 4). (D) AhR enrichment at the κB sequences of Il6 promoter by ChIP in sorted cDC2 untreated or treated overnight with LPS and conditioned for 2 h with l-kynurenine (n = 2). (E) IDO1 immunoblot in purified cDC2 were transfected and treated as depicted for 48 h (n = 4). (F) l-kynurenine uptake in purified cDC2. MFI is shown (n = 4). (G) IDO1 expression by IS in cDC2 treated as (A) in the presence or absence of BCH for 48 h (n = 5). (H) Predicted canonical AhR binding sites in the murine Ido1 promoter. (I) MFI of GFP expression in pre-gated as Thy1.1+ cDC2 transduced with RV vector containing regions as described in (H). Gray histograms show empty reporter (n = 4). (J) Quantification of the +1,340 bp and +1,601 bp Ido1 enhancer activity in WT and Ahr/ cDC2s using retroviral reporters as in (I) (n = 3). (K) ChIP-PCR analysis of AhR binding on +1,340 bp and +1,601 bp Ido1 enhancer elements in cDC2 treated as in (C) (n = 3). (L) IDO1 expression by IS in gated CCR7+cDC2 derived from Rosa26Cas9−GFP/+ c-Kithi progenitors infected with RV expressing sgRNAs targeting +1,340 bp and +1,601 bp Ido1 enhancer elements treated as shown for 48 h (n = 2). (M) Schematic representation of BM chimera model. (N) IDO1 expression by IS in cDC1 and cDC2 from BMDC derived as in (M) and cultured as shown (n = 3). (O) ChIP-PCR analysis of RelB binding on +1,340 bp and +1,601 bp Ido1 enhancer elements in cDC2 treated as in (C) (n = 3). (P) AhR and RelB Immunoblot in purified cDC2 treated as in (K) where AhR was immunoprecipitated (n = 3). (Q) AhR and RelB interaction in purified cDC2 treated as indicated by PLA. Red spots show a single AhR/RelB interaction. Scale bars, 10 μm (n = 3). Data are shown as means ± SD. ∗∗ p < 0.01, ∗∗∗ p < 0.001, ∗∗∗∗ p < 0.0001, one-way (L) or two-way (C, D, G, J, K, N, and O) ANOVA followed by Bonferroni multiple comparison test. Dots represent a biological replicate (G and N). β-actin used as loading control (B, E, and P). Data are normalized to IgG control (D, K, and O). Please also see Figure S6.
Figure 7
Figure 7
l-kynurenine induces immune regulatory functions in EAE (A) EAE score in Ahrf/fItgax Cre or Ahrf/fItgax Cre+ mice treated with l-kyn or vehicle, from 11 to 22 days post immunization. 6 mice per group, n = 3. (B–D) TNF-α (B), GM-CSF (C), and TGFβ (D) in plasma from EAE mice in (A). (E) IDO1+CCR7+ cDC2 of cDCs by IS in cervical LNs from EAE mice treated as in (A). (F) H&E staining of spinal cord sections from mice treated in (A). Scale bar, 100 μM. (G) EAE score of mixed bone marrow chimeras with bone marrow of indicated genotypes. 9 mice per group, n = 2. (H) IDO1 immunoblot in cDC1 and cDC2, sorted from human PBMCs, were treated as depicted for 36 h (n = 3). (I) l-kynurenine content in supernatants from cells prepared as in (H) (n = 3). (J) IDO1 immunoblot in purified human cDC1 and cDC2 cultured alone (sorted) or together (mixed), in trans-well plates, with or without LPS for 36 h (n = 3). (K) IDO1 immunoblot in human cDC1 and cDC2 co-cultured in trans-well plates and treated as depicted for 36 h (n = 3). (L) Schematic representation of human cDC2 treatment with cDC1 conditioned media. cDC1 untreated (SNU), LPS treated (SNL) for 36 h, CH2223191 (CH) cDC2 pre-treated for 2 h and incubated with cDC1 conditioned media for 36 h. (M) IDO1 immunoblot in cDC2 treated as in (L) (n = 3). (N) UMAP plot representing 17 color-coded cell clusters identified in merged single-cell transcriptomes of blood (42,969) and CSF (22,357) cells from control (n = 4) and multiple sclerosis (MS; n = 4) patients. (O and P) Dot plot depicting selected genes of tryptophan metabolic pathway in cell clusters of CFS (O) and blood (P). (Q) Comparative UMAP plots depicting only CSF cells from control (12,705 cells, left plot) and MS (9,652 cells, right plot) donors. (R and S) Dot plot depicting selected genes differentially expressed in at least one cluster of MS cells compared with controls in CSF (R) or blood (S). Purple indicates higher and turquoise indicates lower expression in MS, respectively. Data are shown as means ± SD. p < 0.05, ∗∗ p < 0.01, ∗∗∗ p < 0.001, ∗∗∗∗ p < 0.0001, two-way ANOVA followed by Bonferroni multiple comparison test (A–E, G, and I). Dots represent a biological replicate (B–E). β-tubulin used as loading control (H, J, K, and M). Dot size encodes percentage of cells expressing the gene (O, P, R, and S). Please also see Figure S7.

Comment in

References

    1. Ardouin L., Luche H., Chelbi R., Carpentier S., Shawket A., Montanana Sanchis F., Santa Maria C., Grenot P., Alexandre Y., Gregoire C., et al. Broad and largely concordant molecular changes characterize tolerogenic and immunogenic dendritic cell maturation in thymus and periphery. Immunity. 2016;45:305–318. - PubMed
    1. Askew D., Harding C.V. Antigen processing and CD24 expression determine antigen presentation by splenic CD4+ and CD8+ dendritic cells. Immunology. 2008;123:447–455. - PMC - PubMed
    1. Bacsi S.G., Hankinson O. Functional characterization of DNA-binding domains of the subunits of the heterodimeric aryl hydrocarbon receptor complex imputing novel and canonical basic helix-loop-helix protein-DNA interactions. J. Biol. Chem. 1996;271:8843–8850. - PubMed
    1. Bajaña S., Turner S., Paul J., Ainsua-Enrich E., Kovats S. IRF4 and IRF8 act in CD11c+ cells to regulate terminal differentiation of lung tissue dendritic cells. J. Immunol. 2016;196:1666–1677. - PMC - PubMed
    1. Bessede A., Gargaro M., Pallotta M.T., Matino D., Servillo G., Brunacci C., Bicciato S., Mazza E.M., Macchiarulo A., Vacca C., et al. Aryl hydrocarbon receptor control of a disease tolerance defence pathway. Nature. 2014;511:184–190. - PMC - PubMed

Publication types