. 2022 Jun 14;39(11):110949.
doi: 10.1016/j.celrep.2022.110949.

Unravelling the sex-specific diversity and functions of adrenal gland macrophages

Affiliations

Unravelling the sex-specific diversity and functions of adrenal gland macrophages

Bastien Dolfi et al. Cell Rep. .

Abstract

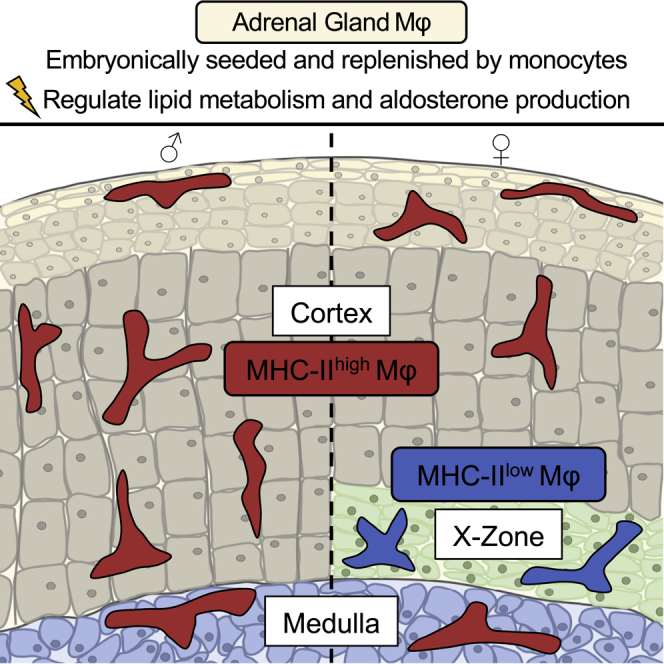
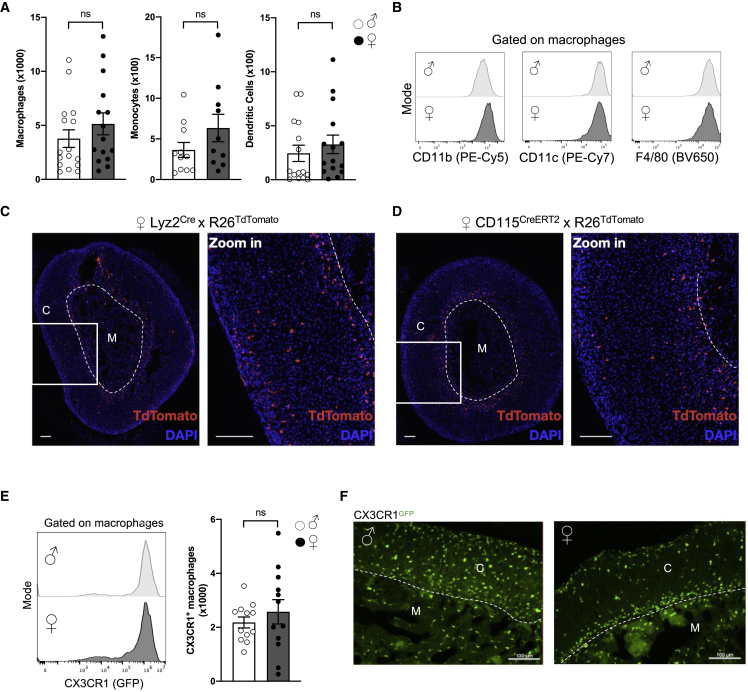
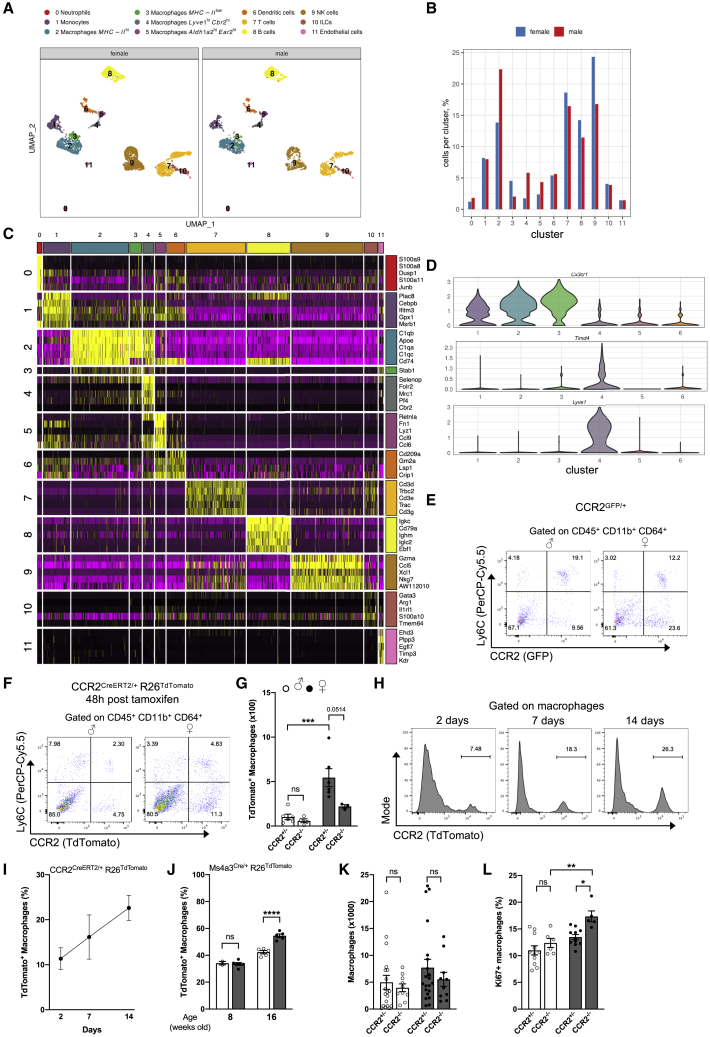
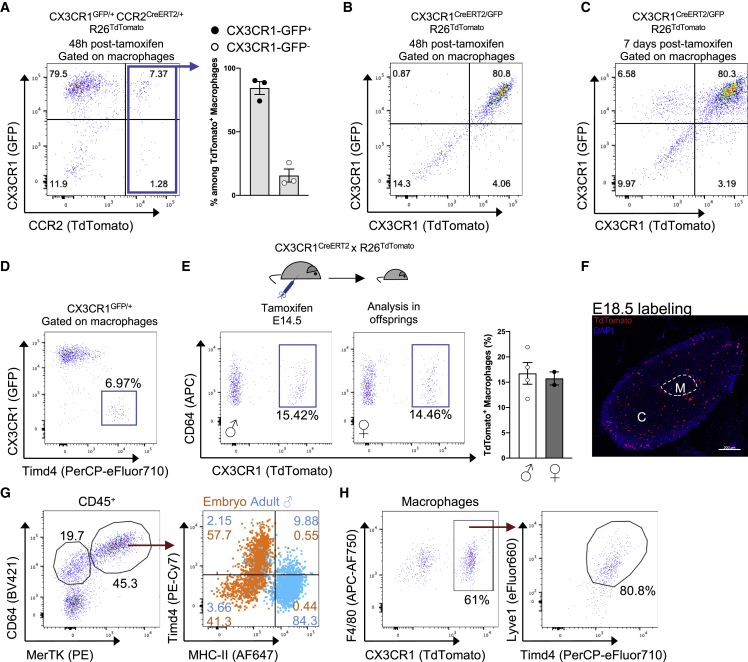
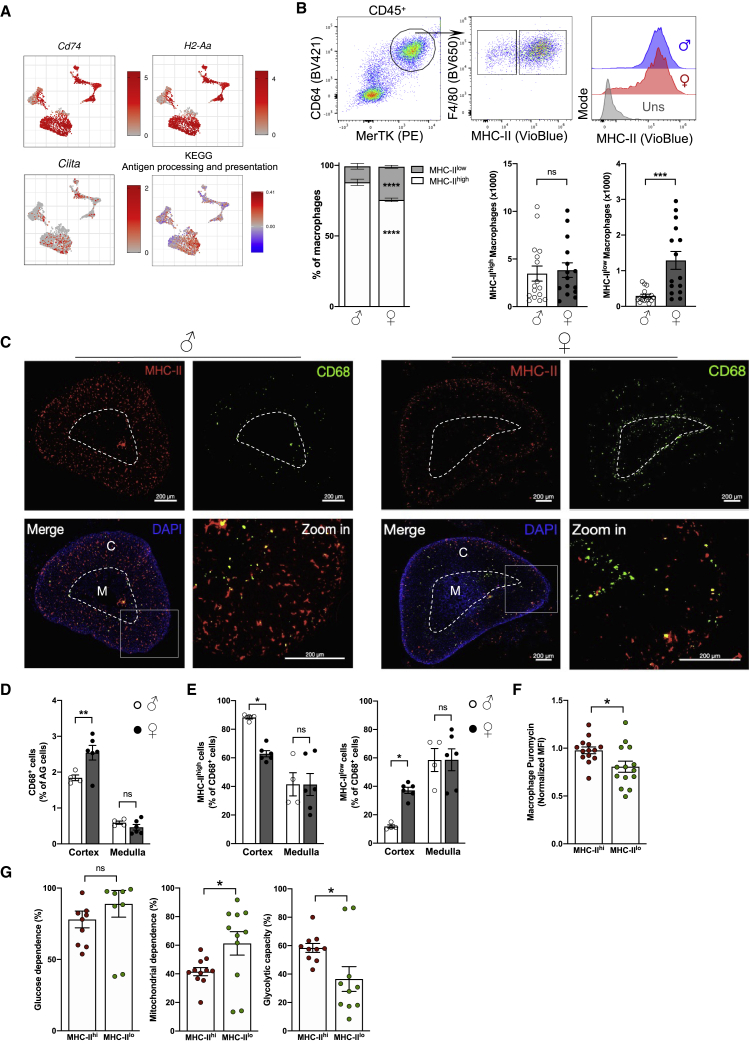
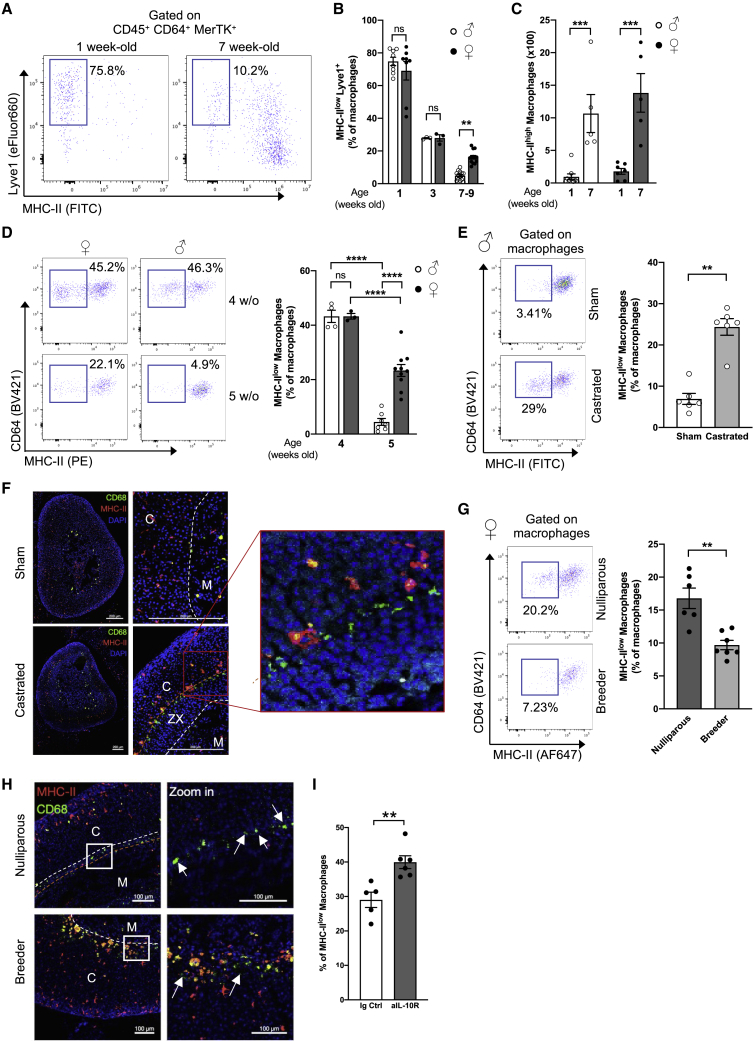
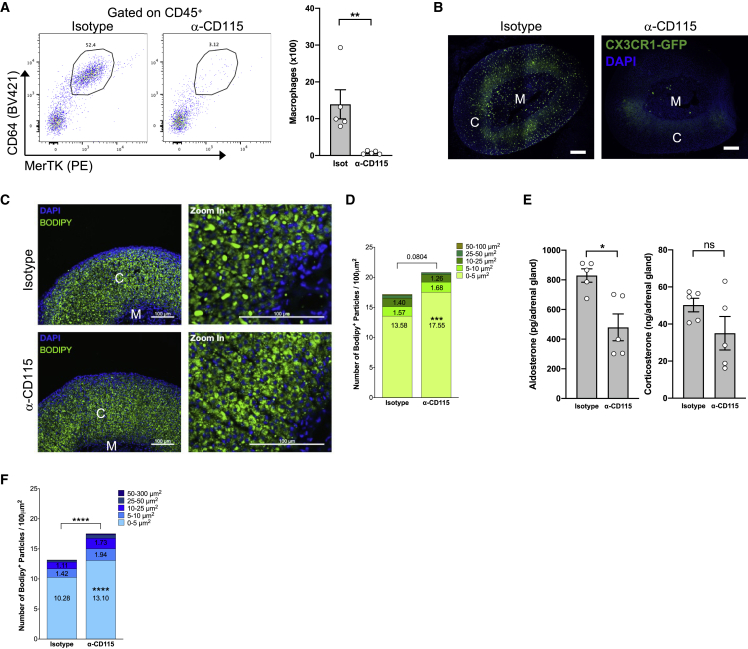
Despite the ubiquitous function of macrophages across the body, the diversity, origin, and function of adrenal gland macrophages remain largely unknown. We define the heterogeneity of adrenal gland immune cells using single-cell RNA sequencing and use genetic models to explore the developmental mechanisms yielding macrophage diversity. We define populations of monocyte-derived and embryonically seeded adrenal gland macrophages and identify a female-specific subset with low major histocompatibility complex (MHC) class II expression. In adulthood, monocyte recruitment dominates adrenal gland macrophage maintenance in female mice. Adrenal gland macrophage sub-tissular distribution follows a sex-dimorphic pattern, with MHC class IIlow macrophages located at the cortico-medullary junction. Macrophage sex dimorphism depends on the presence of the cortical X-zone. Adrenal gland macrophage depletion results in altered tissue homeostasis, modulated lipid metabolism, and decreased local aldosterone production during stress exposure. Overall, these data reveal the heterogeneity of adrenal gland macrophages and point toward sex-restricted distribution and functions of these cells.

Keywords: CP: Immunology; adrenal gland; macrophage; monocyte; sex dimorphism.


Conflict of interest statement

Declaration of interests The authors declare no competing interests.

Figures

None
Graphical abstract
Figure 1
Figure 1
Macrophages are the main adrenal gland immune subset and possess a sex-specific localization (A) Quantification of macrophages, monocytes, and DCs in the adrenal glands of 7-week-old male and female wild-type mice. Macrophages: ♂ n = 16 and ♀ n = 15. Monocytes: ♂ n = 11 and ♀ n = 10. DCs: ♂ and ♀ n = 15. Data pooled from 2 (monocytes) or 3 (macrophages and DCs) independent experiments. (B) Histograms representing CD11b, CD11c, and F4/80 expression on male and female AGMs. Data are representative of at least 4 independent experiments. (C and D) Representative images of R26TdTomato expression in adrenal glands from 10- to 12-week-old female Lyz2cre (C) and CD115creERT2 (D) mice 24 h after TAM administration. Scale bars: 100 μm. Data are from one experiment. (E) Flow-cytometry analysis of CX3CR1GFP expression in male and female AGMs. ♂ n = 12 and ♀ n = 12. Data are pooled from 3 independent experiments. (F) Microscopy analysis of CX3CR1+ cells localization in 8-week-old male and female (nulliparous) CX3CR1GFP/+ mice. Scale bar: 100 μm. Data are representative of at least 4 independent experiments. Two-tailed Mann-Whitney tests were used for statistical analysis. See also Figure S1 and Table S1.
Figure 2
Figure 2
scRNA-seq analysis reveals adrenal gland leukocyte diversity and monocyte contribution to the macrophage pool (A) scRNA-seq analysis of adrenal gland CD45+ cells from 7-week-old male and female wild-type mice. (B) Proportion of each cluster identified in scRNA-seq analysis. (C) Heatmap showing normalized expression levels of cluster-specific genes. (D) Violin plots showing Cx3cr1, Timd4, and Lyve1 expression by cells from clusters 1–6. (E) Flow-cytometry plot showing Ly6C and CCR2GFP expression among adrenal gland CD45+CD11b+CD64+ cells in male and female CCR2GFP/+ mice. Data are representative of three independent experiments. (F) Flow-cytometry plot showing Ly6C and TdTomato expression among adrenal gland CD45+CD11b+CD64+ cells from male and female CCR2creERT2 x R26TdTomato mice 48 h after TAM gavage. Data are representative of two independent experiments. (G) Quantification of TdTomato+ macrophages in 16- to 20-week-old male and female heterozygous (CCR2+/-, ♂ n = 6 and ♀ n = 6) or double knockin (CCR2-/-, ♂ n = 4 and ♀ n = 3) CCR2creERT2 x R26TdTomato mice 48 h after TAM gavage. Data are pooled from two independent experiments. (H) Histograms representing R26TdTomato expression in AGMs from 10-week-old female CCR2creERT2/+ x R26TdTomato mice 2, 7, and 14 days after TAM gavage. Data are representative of one (days 7 and 14) or two (day 2) experiments. (I) Proportions of TdTomato+ macrophages from 10-week-old female CCR2creERT2/+ x R26TdTomato mice 2 (n = 8), 7 (n = 4), and 14 (n = 3) days after TAM gavage. Data from one (days 7 and 14) or two (day 2) experiments. (J) Proportions of TdTomato+ macrophages from 8 (♂ n = 2, ♀ n = 6) or 16 (♂ n = 5, ♀ n = 5)-week-old male and female Ms4a3cre/+ x R26TdTomato mice. Data are from one experiment. (K) Quantification of AGMs in male and female CCR2+/- (♂ n = 18, ♀ n = 21) and CCR2-/- (♂ n = 10, ♀ n = 10) mice. Data are pooled from four independent experiments. (L) Proportions of Ki67+ AGMs in male and female CCR2+/- (♂ n = 11, ♀ n = 11) and CCR2-/- (♂ n = 6, ♀ n = 5) mice. Data are pooled from two independent experiments. Statistical analysis was performed using two-way ANOVA with Bonferroni’s post-test. See also Figure S2.
Figure 3
Figure 3
Embryonic and monocyte-derived adrenal gland macrophages are distinct subsets identified through CX3CR1 expression (A) (Left) Representative plot of macrophage CX3CR1-GFP and R26TdTomato expression and (right) proportions of CX3CR1-GFP+ and CX3CR1-GFP- cells among R26TdTomato+ AGMs from (n = 3) female CX3CR1GFP/+ CCR2CreERT2/+ R26TdTomato mice 48 h post TAM gavage. Data are from one experiment. (B) Representative plot of macrophage CX3CR1 and R26TdTomato expression in double reporter CX3CR1creERT2/GFP R26TdTomato mice 48 h post TAM administration. Data are from one experiment. (C) Representative plot of macrophage CX3CR1 and R26TdTomato expression in double reporter CX3CR1creERT2/GFP R26TdTomato mice 7 days post tamoxifen administration. Data are from one experiment. (D) Flow-cytometry plot showing Timd4 and CX3CR1 expression by AGMs. Data are representative of at least 4 independent experiments. (E) Embryonic labeling of CX3CR1creERT2 R26TdTomato mice was performed at E14.5. R26TdTomato+ cells were identified in 8-week-old male (n = 4) and female (n = 2) offspring. Data are representative of 2 independent experiments. (F) Embryonic labeling of CX3CR1creERT2 R26TdTomato mice was performed at E18.5. R26TdTomato+ cells were identified in 10-week-old female offspring. Scale bar: 200 μm. Data are representative of 2 independent experiments. (G) Flow-cytometry analysis of Timd4 and MHC class II expression in AGMs from E18–E20 embryos and male adult (9-week-old) mice. Data are from one experiment. (H) Embryonic labeling of CX3CR1creERT2 R26TdTomato mice was performed at E14.5. R26TdTomato+ cells were identified in 1-week-old male offspring (left panel), which comprised mainly Tidm4+ Lyve1+ cells (right panel). Data are representative of n = 2 mice. Data are from one experiment. Two-tailed Mann-Whitney tests were used for statistical analysis. See also Figure S3.
Figure 4
Figure 4
MHC class IIlow macrophages are a female-specific subset with restricted localization (A) scRNA-seq analysis of CD74, H2-Aa, Ciita, and the KEGG pathway “Antigen processing and presentation” expression among myeloid cells. (B) (Top) Flow-cytometry plots showing F4/80 and MHC class II expression among AGMs from 7-week-old male and female mice. (Bottom) Proportions and numbers of MHC class IIhigh and class IIlow AGMs from 7-week-old male and female wild-type mice. ♂ n = 16 and ♀ n = 15. Data are pooled from 3 independent experiments. (C) Fluorescence-microscopy analysis of CD68 and MHC class II expression in adrenal glands from 7-week-old male and female mice. Scale bar: 200 μm. M, medulla; C, cortex. Data are representative of at least 3 independent experiments. (D) Distribution of CD68+ cells between cortex and medulla from adrenal glands of 7-week-old male and female mice. Data are represented as proportion of CD68+ cells from each zone among total cells. ♂ n = 4 and ♀ n = 6. Quantification from one experiment. (E) Proportion of MHC-IIhigh and MHC-IIlow CD68+ cells in the cortex and medulla of adrenal glands from 7-week-old male and female mice. ♂ n = 4 and ♀ n = 6. Quantification from one experiment. (F) Analysis of macrophage metabolic activity using SCENITH, represented by Puromycin MFI (n = 14). Data pooled from 4 independent experiments. (G) Measure of glycolytic and mitochondrial metabolism in macrophages using SCENITH (n = 10–11). Data pooled from 3 independent experiments. Statistical analysis was performed using two-tailed Mann-Whitney tests (panel B, quantifications), two-way ANOVA with Bonferroni’s post-test (proportions in panel B, panel D and panel E), or paired Wilcoxon t-tests (panels F and G). See also Figure S4.
Figure 5
Figure 5
Adrenal gland macrophage sex-dimorphism is established with organ maturation and depends on X-zone presence (A) Representative plots showing AGM MHC-II and Lyve1 expression in male 1- or 7-week-old mice. Data representative of 2 independent experiments. (B) Proportions of MHC-IIlow Lyve1+ macrophages in male and female 1-(♂ n = 8, ♀ n = 8), 3-(♂ n = 3, ♀ n = 3) or 7 to 9-week-old (♂ n = 13, ♀ n = 13) mice. Data pooled from 2 independent experiments. (C) Quantification of MHC-IIhigh AGMs in male and female 1- (♂ n = 9, ♀ n = 7) or 7-week-old (♂ n = 5, ♀ n = 5) mice. Data are pooled from 2 independent experiments. (D) (Left) Representative plots showing MHC class II expression and (right) proportions of MHC class IIlow macrophages in male and female 4- (♂ n = 4, ♀ n = 3) and 5-week-old (♂ n = 7, ♀ n = 10) wild-type mice. Data are pooled from 2 independent experiments. (E) (Left) Representative plots showing MHC class II expression and (right) proportions of MHC class IIlow AGMs in 7-week-old castrated (n = 6) and sham-operated (n = 6) wild-type male mice. Data are pooled from 2 independent experiments. (F) Confocal-microscopy analysis of MHC class II and CD68 expression in 7-week-old castrated and sham-operated wild-type mice. The X-zone is comprised between white and orange dots. Scale bar: 200 μm. M, medulla; C, cortex; ZX, X- zone. Data are representative of 2 independent experiments. (G) (Left) Representative plots showing MHC class II expression and (right) proportions of MHC class IIlow AGMs in female retired breeders (n = 7) and age-matched nulliparous (n = 6) mice. Data are pooled from 2 independent experiments. (H) Fluorescence-microscopy analysis of CD68 and MHC class II expression in adrenal glands from 12-week-old female retired breeders and age-matched nulliparous mice. The X zone is comprised between white and orange dots. Scale bar: 100 μm. M, medulla; C, cortex. Data are representative of 2 independent experiments. (I) Proportions of MHC class IIlow macrophages in female mice treated with anti-IL-10R-blocking antibody or isotype control. Data are pooled from 3 independent experiments. Statistical analysis was performed using two-way ANOVA with Bonferroni’s post-test (B–D) or two-tailed Mann-Whitney tests (E, G, and I). See also Figure S5.
Figure 6
Figure 6
Adrenal gland macrophages control tissue lipid metabolism (A) (Left) Representative plots and (right) quantification of AGMs in 7- to 8-week-old CX3CR1GFP/+ mice after macrophage depletion using α-CD115 (n = 5) or isotype control (n = 5). (B) Microscopy analysis of adrenal glands from α-CD115- or isotype-control-treated CX3CR1GFP/+ mice. One microscopy experiment was performed to confirm depletion efficiency. (C) Microscopy analysis of adrenal glands from α-CD115- or isotype-control-treated male mice using Bodipy staining. Data are from one experiment. (D) Quantification of Bodipy+ particles of different sizes in adrenal glands from α-CD115- (n = 3) or isotype-control- (n = 3) treated male mice. Data are from one experiment. (E) Aldosterone and corticosterone levels in adrenal gland homogenates from 8-week-old α-CD115- (n = 5) or isotype-control- (n = 5) treated female mice submitted to a 12 h cold challenge. Data are from one experiment. (F) Quantification of Bodipy+ particles of different sizes in adrenal glands from 8-week-old α-CD115- (n = 5) or isotype-control- (n = 5) treated female mice submitted to a 12 h cold challenge. Statistical analysis was performed using two-way ANOVA with Bonferroni’s post-test (D and F) or two-tailed Mann-Whitney tests (A and E). See also Figure S6.

References

    1. Arguello R.J., Combes A.J., Char R., Gigan J.P., Baaziz A.I., Bousiquot E., Camosseto V., Samad B., Tsui J., Yan P., et al. SCENITH: a flow cytometry-based method to functionally profile energy metabolism with single-cell resolution. Cell Metabol. 2020;32:1063–1075.e7. doi: 10.1016/j.cmet.2020.11.007. - DOI - PMC - PubMed
    1. Audenet F., Mejean A., Chartier-Kastler E., Roupret M. Adrenal tumours are more predominant in females regardless of their histological subtype: a review. World J. Urol. 2013;31:1037–1043. doi: 10.1007/s00345-012-1011-1. - DOI - PubMed
    1. Bain C.C., Bravo-Blas A., Scott C.L., Gomez Perdiguero E., Geissmann F., Henri S., Malissen B., Osborne L.C., Artis D., Mowat A.M. Constant replenishment from circulating monocytes maintains the macrophage pool in the intestine of adult mice. Nat. Immunol. 2014;15:929–937. doi: 10.1038/ni.2967. - DOI - PMC - PubMed
    1. Bain C.C., Gibson D.A., Steers N.J., Boufea K., Louwe P.A., Doherty C., Gonzalez-Huici V., Gentek R., Magalhaes-Pinto M., Shaw T., et al. Rate of replenishment and microenvironment contribute to the sexually dimorphic phenotype and function of peritoneal macrophages. Sci. Immunol. 2020;5:eabc4466. doi: 10.1126/sciimmunol.abc4466. - DOI - PMC - PubMed
    1. Bain C.C., Hawley C.A., Garner H., Scott C.L., Schridde A., Steers N.J., Mack M., Joshi A., Guilliams M., Mowat A.M.I., et al. Long-lived self-renewing bone marrow-derived macrophages displace embryo-derived cells to inhabit adult serous cavities. Nat. Commun. 2016;7 doi: 10.1038/ncomms11852. ncomms11852. - DOI - PMC - PubMed

Publication types

Substances