. 2022 Jun 14;39(11):110959.
doi: 10.1016/j.celrep.2022.110959.

Primary and secondary functions of HLA-E are determined by stability and conformation of the peptide-bound complexes

Affiliations

Primary and secondary functions of HLA-E are determined by stability and conformation of the peptide-bound complexes

Lucy C Walters et al. Cell Rep. .

Abstract

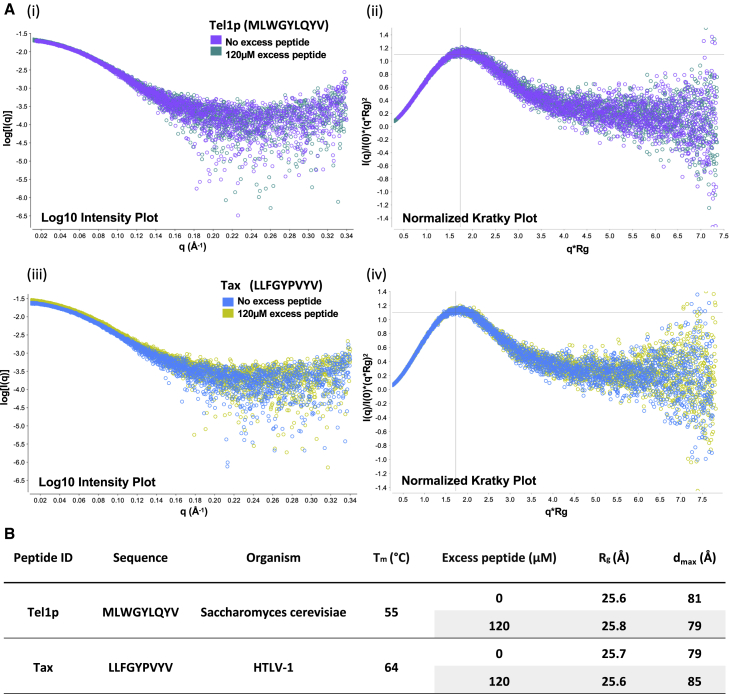
MHC-E regulates NK cells by displaying MHC class Ia signal peptides (VL9) to NKG2A:CD94 receptors. MHC-E can also present sequence-diverse, lower-affinity, pathogen-derived peptides to T cell receptors (TCRs) on CD8+ T cells. To understand these affinity differences, human MHC-E (HLA-E)-VL9 versus pathogen-derived peptide structures are compared. Small-angle X-ray scatter (SAXS) measures biophysical parameters in solution, allowing comparison with crystal structures. For HLA-E-VL9, there is concordance between SAXS and crystal parameters. In contrast, HLA-E-bound pathogen-derived peptides produce larger SAXS dimensions that reduce to their crystallographic dimensions only when excess peptide is supplied. Further crystallographic analysis demonstrates three amino acids, exclusive to MHC-E, that not only position VL9 close to the α2 helix, but also allow non-VL9 peptide binding with re-configuration of a key TCR-interacting α2 region. Thus, non-VL9-bound peptides introduce an alternative peptide-binding motif and surface recognition landscape, providing a likely basis for VL9- and non-VL9-HLA-E immune discrimination.

Keywords: CD8 T cells; CP: Immunology; HLA-E; MHC Ia; MHC-E; NK cells; NKG2A; SAXS; T cell receptor; VL9; X-ray crystallography; small-angle X-ray scatter.


Conflict of interest statement

Declaration of interests The authors declare no competing interests.

Figures

None
Graphical abstract
Figure 1
Figure 1
SEC-SAXS analysis of peptide-HLA-E complexes (A) (i), (iii), (v), (vii), (ix), and (xi): Log10 scattering intensity plots for HLA-E SEC-SAXS experiments. Scattering intensity curves for HLA-E refolds run in the absence or presence of 120 μM excess peptide during elution are plotted. On the x axis is the scattering vector q (Å−1) versus the scattered intensity, I(q), log-scale, on the y axis. (ii), (iv), (vi), (viii), (x), and (xii): Normalized Kratky plots with superimposed curves corresponding to HLA-E SEC-SAXS experiments with or without 120 μM excess peptide. Modulated Gaussian curves are color-coded according to legends in adjacent log10 intensity plots. The scattering vector multiplied by the radius of gyration is plotted on the x axis versus the scattering intensity I(q) divided by the experiment’s I(0) multiplied by (qRg)2 on the y axis. (B) Ab initio DAMMIF models (small dots) represent the average conformational protein state in solution. Top: SEC-SAXS runs where HLA-E complexes were injected onto the HPLC column in the presence of 120 μM excess peptide but without excess peptide during elution. Bottom: 120 μM excess peptide was present throughout injection and elution. HLA-E-peptide structural coordinates superimposed via SUPCOMB onto their peptide-equivalent SEC-SAXS-based bead models are reported for VL9 (PDB: 1MHE), Mtb44 HLA-Mtb44 (PDB: 6GH1), IL9 (structure reported here), Mtb14 (structure reported here) and RL9HIV (PDB: 6LH1).
Figure 2
Figure 2
SEC-SAXS analysis for peptide-HLA-A2 complexes (A) (i) and (iii): Log10 scattering intensity plots for HLA-A02:01 SEC-SAXS experiments. The scattering vector q (Å−1) is plotted (x axis) versus scattered intensity, I(q), log scale (y axis). Scattering intensity curves for HLA-A2 refolds run with or without 120 μM excess peptide during elution, are plotted. (ii) and (iv): Normalized Kratky plots with superimposed curves corresponding to HLA-A2 SEC-SAXS experiments with or without 120 μM excess peptide. Modulated Gaussian curves are color-coded according to figure legends in log10 intensity plots. The scattering vector multiplied by the radius of gyration is plotted (x axis) versus the scattering intensity I(q) divided by the experiment’s I(0) and multiplied by (qRg)2 (y axis). (B) HLA-A02:01-peptide refolds tested via SEC-SAXS. Each row represents SEC-SAXS experiments conducted in the absence or presence of 120 μM excess peptide. The radius of gyration (Rg) and maximum dimension (dmax), both measured in Å, are specified, along with circular dichroism-measured Tm values (Borbulevych et al., 2009).
Figure 3
Figure 3
DAMMIF model structural alignment negatively correlates with HLA-E thermal stability and peptide-binding signals (A) (i–iv): Scatter graphs where ELISA-derived HLA-E peptide-binding signals or Tm values are plotted on the x axis versus SEC-SAXS-obtained dmax values or molecular envelope volumes (denoted in Å), on the y axes. (v): Scatter graph with normalized ELISA-based HLA-E peptide-binding signals and Tm, denoted in A, plotted on the x and y axes, respectively. (vi): Figure legend for A (i–v). (B) (i–vii): Bar charts representing ELISA-based HLA-E peptide titration assays, with peptide concentration (x axis) versus average absorbance signals at 450 nm (y axis). The “peptide-free” negative control (dark gray) reflects the “no-rescue” exchange reaction. For (ii–vii), the positive control VL9 (VMAPRTVLL) peptide (dark red) corresponds to a 120 μM excess peptide exchange reaction. For (i–vii), Pearson’s correlation coefficients (r) are denoted, with corresponding p values or ns for non-significant correlations. Error bars depict SEM. Biological repeats, n = 3; technical replica n = 2.
Figure 4
Figure 4
Structural characterization of mycobacterial peptide binding to HLA-E (A) (i): PyMol visualization (side-on) of peptide Mtb14, from molecule 1 of the asymmetric unit (hot pink stick form). An electron density map contoured to 1 sigma is displayed (gray mesh) overlaying the peptide. (ii): Ribbon representation of the peptide backbone (hot pink) from the HLA-E-Mtb14 structure with a superimposed VL9 peptide backbone (PDB: 1MHE, violet). The peptide N and C termini are labeled for clarity. (B) (i): Side-on visualization of peptide IL9, from molecule 1 of the asymmetric unit (blue stick form). (ii): Side-on visualization of peptide IL9 from molecule 2 of the asymmetric unit (blue stick form). In B (i) and (ii), an electron density map contoured to 1 sigma is displayed (gray mesh) overlaying the peptide. (iii): Superimposed peptide backbones are depicted with the N and C termini labeled. The IL9 peptide backbones from molecules 1 and 2 of the asymmetric unit (blue ribbon) with the position 7 A side chains (blue stick form) are reported. The distance (1.9 Å) separating the position 7 Cα atom of the IL9 peptides from molecules 1 and 2 of the asymmetric unit is denoted. (iv): Superimposed peptide backbones are depicted in ribbon form with the N and C termini labeled. The IL9 peptide backbones from molecules 1 and 2 of the asymmetric unit are displayed (blue), with the VL9 peptide backbone from the published HLA-E-VL9 structure (PDB: 1MHE) in violet. The 2.0 Å distance separating the IL9 position 7 Cα atom from molecule 1 of the asymmetric unit and the VL9 position 7 Cα atom is denoted.
Figure 5
Figure 5
Suboptimal E pocket interactions compromise HLA-E complex stability (A) (i): HLA-A2 E pocket (PDB: 3MRG [Reiser et al., 2014]) visualization with side chains of pocket-forming residues depicted (gray or green sticks). The hepatitis C virus-derived CINGVCWTV peptide (pink ribbon) with the solvent-exposed position 7 side chain (stick form) projecting away from the E pocket. HLA-A2 groove regions including the α2 helix and β-sheet floor are shown (gray cartoon). (ii–v): Position 7 anchor side-chain-accommodating E pocket of HLA-E. E-pocket-forming residue side chains are depicted (gray sticks) with remaining regions of the PBG (gray cartoon). In (ii), the VL9 peptide main chain (purple ribbon) with the position 7 side chain (purple stick-form) projecting downward into the secondary E pocket is shown (PDB: 1MHE). (iii–v): Illustration of differential positioning at position 7 of HLA-E-bound pathogen-derived peptides relative to VL9 (PDB: 1MHE). The IL9, RL9HIV, and Mtb14 peptide backbones are depicted (blue [iii], yellow [iv], and magenta [v] ribbons, respectively), with position 7 side chains: Ala-7 of IL9, Ser-7 of RL9HIV, and Gln-7 of Mtb14 (blue [iii], yellow [iv], and magenta [v] stick form, respectively). The superimposed VL9 peptide main chain (PDB: 1MHE) is shown (purple ribbon), and the distance between the aligned peptide position 7 Cα atoms is indicated by dashed lines for the following: 2 Å for VL9 and IL9, 3.4 Å for VL9 and RL9HIV, and 1.1 Å for VL9 and Mtb14. In (v), water-mediated inter-chain hydrogen bonds (magenta dashed lines) with the coordinated H2O molecule (cyan-shaded sphere) are depicted. Four hydrogen bonds, which indirectly link the Mtb14 position 7 Gln side chain to the HLA-E α2-helix Ser-147 side chain and Ser-143 main chain, in addition to the Mtb14 peptide position 8 main chain, are shown. The Mtb14 Val-8 main chain and HLA-E Ser-143 main chain are labeled “MC” (magenta and gray sticks, respectively). (B) HLA-E-β2M-peptide thermal stability (Tm) in the presence of 12 M excess peptide. Tm values (°C) are listed for VL9, Mtb14, and the corresponding position (p)7 variant peptides VL9 p7Q and Mtb14 p7V. (C) (i): Bar chart of an ELISA-based HLA-E peptide-binding assay in which the wild-type Mtb14 peptide was compared with the Mtb14 p7V peptide. The VL9 peptide-positive control (dark red) and the negative peptide-free “no rescue” control (gray) are indicated. Test peptides are plotted (x axis) versus the average absorbance readings at 450 nm (y axis); p values from unpaired t tests are denoted no asterisk p > 0.05, p ≤ 0.05, ∗∗p ≤ 0.01, ∗∗∗p ≤ 0.001, ∗∗∗∗p ≤ 0.0001. Error bars depict SEM. Biological repeats, n = 3; technical replica, n = 2. (ii): Bar chart as described in (C) (i), in which HLA-E binding to VL9 was compared with a variant peptide containing p7Q. The Mtb14 peptide, which naturally contains p7Q, was included for reference. (D) (i) and (iii): Log10 scattering intensity plots for HLA-E SEC-SAXS experiments. Plotted on the x axis is the scattering vector q (Å−1) with scattered intensity, I(q), log scale on the y axis. Superimposed scattering intensity curves for peptide-HLA-E refolds are color coded according to the corresponding figure legend. (ii) and (iv): Normalized Kratky plots with superimposed curves from HLA-E SEC-SAXS experiments. Superimposed modulated Gaussian curves are color coded according to legends in log10 intensity plots. The scattering vector multiplied by the radius of gyration (x axis) is plotted versus the scattering intensity I(q) divided by the experiment’s I(0) and multiplied by (qRg)2 (y axis). (E) Summary detailing HLA-E-peptide refolds tested via SEC-SAXS. Peptide ID, sequence and origin are specified along with the radius of gyration (Rg) and maximum dimension (dmax), both measured in Å.
Figure 6
Figure 6
Distinct structural motifs emerge in the absence of HLA-E-bound VL9 peptide (A) (i): Superimposed HLA-E α2 helical kink regions depicted as lines with the α2 helix short-arm labeled “SA,” the long-arm labeled “LA,” and residue positions denoted. The HLA-E-VL9 α2 helix (PDB: 1MHE) is shaded gray. Superimposed pathogen peptide-bound HLA-E α2 helices are depicted, including HLA-E-Mtb44 (green), HLA-E-RL9HIV (yellow), HLA-E-Mtb14 (magenta), and HLA-E-IL9 (blue). (ii): The maximum distance in Å separating Cα atoms of HLA-E-VL9 α2 helix residues (1MHE) versus corresponding Cα atoms in pathogen peptide-bound HLA-E structures. (B) Aligned HLA-E-bound peptide Cα backbones are depicted as ribbons following whole HLA-E complex superposition. The VL9 peptide (PDB: 1MHE) is shaded gray. Pathogen-derived HLA-E-bound peptides are colored green (Mtb44), yellow (RL9HIV), magenta (Mtb14), and blue (IL9). HLA-E α1 and α2 helices plus N and C peptide termini positions are indicated. Position 5 Cα atoms are circled, and the maximum distance separating the VL9 peptide Arg-5 Cα from pathogen peptide position 5 Cα atoms are denoted and measure 2.3 Å for VL9 and RL9HIV, 1.9 Å for VL9 and IL9, 1.9 Å for V9 and Mtb14, and 1.5 Å for VL9 and Mtb44. (C) (i): Visualization of the HLA-E α2 helix (gray cartoon) with aligned pathogen-derived peptide backbones RL9HIV, IL9, and Mtb14, in yellow, blue, and magenta ribbon, respectively. The superimposed VL9 peptide backbone (PDB: 1MHE) is shown in gray ribbon. The two salt bridges connecting HLA-E Glu-152 and the Arg-5 side chain of the VL9 peptide are shown (gray dashed lines). The HLA-E Gln-156 side chain-VL9 Arg-5 oxygen main-chain hydrogen bond is also depicted (gray dashed lines). (ii): The HLA-E α2 helix is shown (gray cartoon) with the aligned Mtb44 (green) and VL9 (PBD: 1MHE[gray]) peptide backbones. Molecule 3 of the HLA-E-Mtb44 structure, in which a hydrogen bond (green dashed line) connects the HLA-E Gln-156 side chain to the main chain oxygen of Mtb44 Lys-5 (green sticks) is depicted. This hydrogen bond is present in one of the four molecules in the asymmetric unit. For C (i) and (ii), HLA-E α2 helix Ser-147, Glu-152, and Gln-156 side chains (stick form) are color-coded according to the corresponding peptide. (D) The HLA-E α2 helix is shown (gray cartoon) with the aligned RL9HIV and IL9 peptides (yellow and blue ribbon, respectively). The RL9HIV and IL9 Tyr-3 side chains are shown in yellow and blue stick form, respectively. HLA-E α2 helix Glu-152 side chains from the HLA-E-RL9HIV and HLA-E-IL9 structures are shown (yellow and blue sticks, respectively) with corresponding hydrogen bonds (yellow/blue dashed lines). The HLA-E-VL9 Glu-152 side chain (PBD : 1MHE) is shown in gray stick form for reference. (E) Details of published HLA-E-peptide structures plus the 2 HLA-E structures presented here. Peptide IDs, origins, and amino acid sequences are specified with the corresponding HLA-E allotype and PDB accession codes.

References

    1. Afonine P.V., Grosse-Kunstleve R.W., Echols N., Headd J.J., Moriarty N.W., Mustyakimov M., Terwilliger T.C., Urzhumtsev A., Zwart P.H., Adams P.D. Towards automated crystallographic structure refinement with phenix.refine. Acta. Crystallogr. D. Biol. Crystallogr. 2012;68:352–367. doi: 10.1107/S0907444912001308. - DOI - PMC - PubMed
    1. Anjanappa R., Garcia-Alai M., Kopicki J.D., Lockhauserbäumer J., Aboelmagd M., Hinrichs J., Nemtanu I.M., Uetrecht C., Zacharias M., Springer S., Meijers R. Structures of peptide-free and partially loaded MHC class I molecules reveal mechanisms of peptide selection. Nat. Commun. 2020;11:1314. doi: 10.1038/s41467-020-14862-4. - DOI - PMC - PubMed
    1. Bailey A., Dalchau N., Carter R., Emmott S., Phillips A., Werner J.M., Elliott T. Selector function of MHC I molecules is determined by protein plasticity. Sci. Rep. 2015;5:14928. doi: 10.1038/srep14928. - DOI - PMC - PubMed
    1. Birkinshaw R.W., Pellicci D.G., Cheng T.Y., Keller A.N., Sandoval-Romero M., Gras S., de Jong A., Uldrich A.P., Moody D.B., Godfrey D.I., Rossjohn J. αβ T cell antigen receptor recognition of CD1a presenting self lipid ligands. Nat. Immunol. 2015;16:258–266. doi: 10.1038/ni.3098. - DOI - PMC - PubMed
    1. Borbulevych O.Y., Piepenbrink K.H., Gloor B.E., Scott D.R., Sommese R.F., Cole D.K., Sewell A.K., Baker B.M. T cell receptor cross-reactivity directed by antigen-dependent tuning of peptide-MHC molecular flexibility. Immunity. 2009;31:885–896. doi: 10.1016/j.immuni.2009.11.003. - DOI - PMC - PubMed

Publication types

Substances