. 2022 Aug 17;110(16):2571-2587.e13.
doi: 10.1016/j.neuron.2022.05.017. Epub 2022 Jun 14.

Sodium-calcium exchanger-3 regulates pain "wind-up": From human psychophysics to spinal mechanisms

Affiliations

Sodium-calcium exchanger-3 regulates pain "wind-up": From human psychophysics to spinal mechanisms

Teodora Trendafilova et al. Neuron. .

Abstract

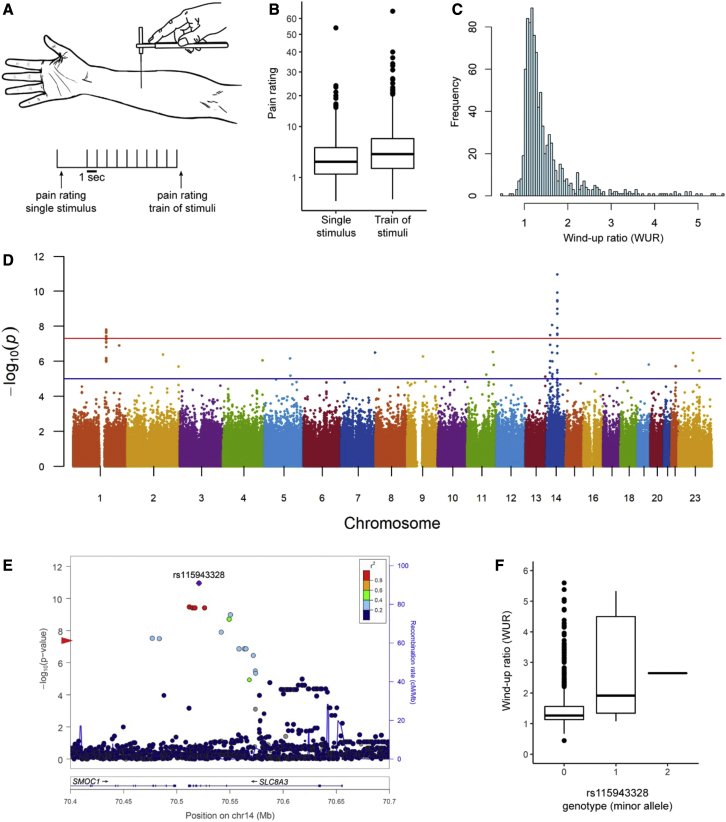
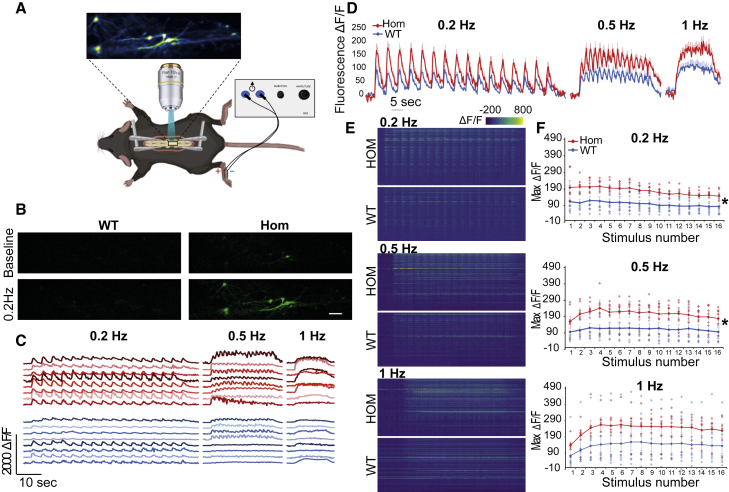
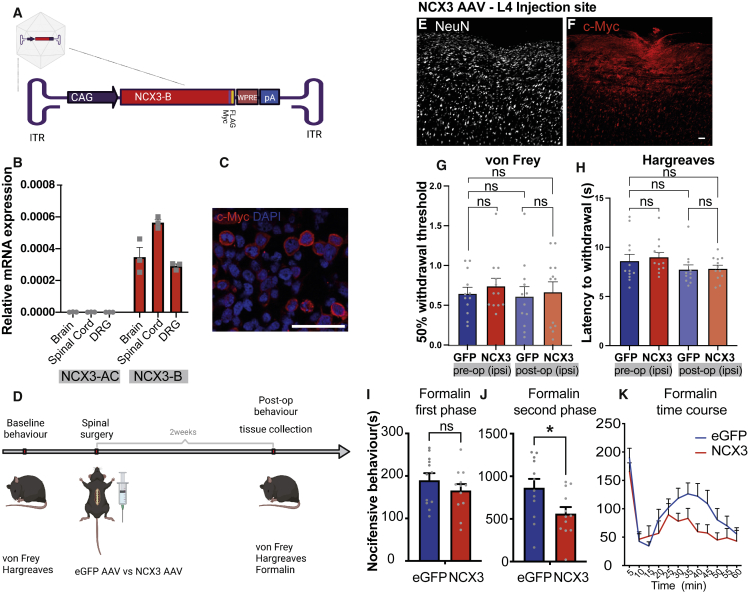
Repeated application of noxious stimuli leads to a progressively increased pain perception; this temporal summation is enhanced in and predictive of clinical pain disorders. Its electrophysiological correlate is "wind-up," in which dorsal horn spinal neurons increase their response to repeated nociceptor stimulation. To understand the genetic basis of temporal summation, we undertook a GWAS of wind-up in healthy human volunteers and found significant association with SLC8A3 encoding sodium-calcium exchanger type 3 (NCX3). NCX3 was expressed in mouse dorsal horn neurons, and mice lacking NCX3 showed normal, acute pain but hypersensitivity to the second phase of the formalin test and chronic constriction injury. Dorsal horn neurons lacking NCX3 showed increased intracellular calcium following repetitive stimulation, slowed calcium clearance, and increased wind-up. Moreover, virally mediated enhanced spinal expression of NCX3 reduced central sensitization. Our study highlights Ca2+ efflux as a pathway underlying temporal summation and persistent pain, which may be amenable to therapeutic targeting.

Keywords: GWAS; central sensitization; in vivo calcium imaging; in vivo electrophysiology; pain; spinal cord; temporal summation; wind-up.


Conflict of interest statement

Declaration of interests The authors declare no competing interests.

Figures

Figure 1
Figure 1
Clinical wind-up ratio is associated with SLC8A3/NCX3 (A) Clinical wind-up ratio (WUR) was performed over the mid ventral forearm using a 255-mN von Frey hair and recording a pain rating for a single stimulus followed by a series of 10 stimuli. (B) Boxplots of numerical pain ratings for the single stimulus and the train of 10 stimuli. (C) Frequency histogram of the WUR. (D) Manhattan plot of the GWAS results of WUR. The red and blue lines indicate genome-wide and suggestive p value significance thresholds, respectively. (E) LocusZoom plot of the association results around the index SNP rs115943328 in SLC8A3 (encoding NCX3). The red arrow on the y axis indicates the GWAS genome-wide significance threshold. (F) Boxplot of WUR values against the three genotype categories of rs115943328 (corresponding to the minor allele C).
Figure 2
Figure 2
NCX3 mRNA is strongly expressed in interneurons and projection neurons in the spinal DH (A) Representative composite image of NCX3 in situ hybridization (ISH) combined with immunofluorescence for NeuN (cyan) and IB4 (blue). (B–D) Representative composite images of ISH combined with immunofluorescence for interneuron markers in the spinal cord (GAD67-eGFP, GlyT2-eGFP, and vGluT2-eGFP). Right panels show magnified inserts. (E) Quantification of the data from (A)—percentage of NCX3-positive cells in the NeuN-positive neuronal population in laminae I to V in the spinal DH (3 images per animal, n = 3 animals). (F) Quantification of the images from (B) to (D)—data were quantified as percentage of NCX3-positive cells in the respective eGFP-positive populations (3 images per animal, n = 3 animals). (G) Quantification of the images from (H) to (K)—percentage of NCX3-positive cells in the Phox2a population (n = 3 animals). Scale bars, 50 μm. (H–K) Example composite images showing multiplex ISH for NCX3 and tdTomato (labeling Phox2a-positive projection neurons) mRNA in the spinal dorsal horn. (H) and (I), co-localization in the superficial laminae. (J) and (K), co-localization in the deep laminae. Scale bars, 50 μm.
Figure 3
Figure 3
Mice lacking NCX3 show normal motor and acute pain behavior but hypersensitivity in the second phase of the formalin test (A–E) Behavioral response to acute sensory stimuli. (F) Rota-rod assessment of sensorimotor function in WT, NCX3HET, and NCX3HOM mice. (G) Formalin test. (H) Mean results from the first phase of the formalin test (first 5 min). (I) Results from the second phase of the formalin test (20–60 min). Data from behavioral tests are mean ± SEM, WT n = 16, NCX3HET n = 11, and NCX3HOM n = 13. (J) von Frey at baseline (BL) and days 7, 14, and 28 post-chronic constriction injury (CCI). Data are mean ± SEM, WT n = 8, and NCX3HOM n = 8. Significance shows comparison with WT (NS p > 0.05, p < 0.05, ∗∗ p < 0.01, ∗∗∗ p < 0.001, ∗∗∗∗ p < 0.0001). Data analysis: one-way ANOVA, Dunnett’s multiple comparisons test for all bar charts; two-way ANOVA, Dunnett’s multiple comparisons test for formalin scatterplot.
Figure 4
Figure 4
Altered Ca2+ dynamics in cultured NCX3HOM DH neurons (A) Mean Ca2+ traces during 3 K+ pulses (mean ± SEM). (B) Mean Ca2+ traces after baseline normalization. (C–F) Calcium imaging parameters—baselines, peaks, AUC, exponential decay constant (tau) shown as violin plots. One-way ANOVA (C)–(F) and Tukey multiple comparisons test. Significance shows comparison with WT p < 0.05, ∗∗p < 0.01, ∗∗∗∗ p < 0.0001). n = 529 WT and 550 NCX3HOM DH neurons, from WT n = 5 and NCX3HOM n = 5 mice.
Figure 5
Figure 5
In vivo Ca2+ imaging of WT versus NCX3HOM lamina I projection neurons (A) Setup: a laminectomy in an anesthetized mouse (WT and NCX3HOM) was used to expose the lumbar spinal cord. Standard single-photon microscopy was then applied to visualize calcium transients in lamina I projection neurons labeled with GCaMP6s. Electrical stimuli were applied across the plantar surface of the paw while calcium responses in neurons were visualized. (B) Sample images of lamina I projection neurons labeled with GCaMP6s at baseline and during electrical stimulation. Scale bars, 100 μm. (C) Sample fluorescence traces of neurons in NCX3HOM (red) and WT (blue) mice during 0.2-, 0.5-, and 1-Hz electrical stimulation. (D) Summary trace of all responding cells (see definition of response in image processing and statistical analysis section). Data displayed as mean of WT n = 94, NCX3HOM n = 98 + SEM. (E) Heatmap of all recorded cells during electrical stimulation. WT n = 111 cells, NCX3HOM n = 118 cells. (F) Average of the maximal fluorescence intensity of each animal (dots). Average of WT n = 8, NCX3HOM n = 6 displayed as line ± SEM. p < 0.05.
Figure 6
Figure 6
In vivo electrophysiology suggests normal sensory coding of deep dorsal horn neurons in WT, NCX3HET, and NCX3HOM mice (A–H) (A) and (C), comparable evoked neuronal responses to punctate mechanical (A) and heat stimulation (C). (B) and (D), histogram traces depicting representative single unit responses. (E) and (F), evoked neuronal responses to dynamic brush and histogram traces of single unit responses. (G) and (H), evoked neuronal responses to noxious evaporative cooling and histogram traces of single unit responses. (I) Receptive field size to a noxious punctate mechanical stimulus. Data represent mean ± SEM. WT n = 21, NCX3HET n = 20, NCX3HOM n = 20. No significant changes found.
Figure 7
Figure 7
Increased wind-up and flexion reflex motoneuron responses in NCX3 mutant mice versus WT controls (A) Wind-up of deep DH neurons (0.2 Hz) expressed as mean number of spikes per stimulus number. (AI) Total spikes evoked separated according to latency: A: 0–50 ms; C: 50–250 ms, PD (post-discharge) > 250 ms (AII). Representative spike traces (AIII). (B) Wind-up of deep DH neurons (0.5 Hz) expressed as mean number of spikes per stimulus number. Curve analysis was performed, and rate constants are displayed. Statistics show comparison with WT. (BI) Total spikes evoked separated according to latency (BII), representative spike traces (BIII). (C) Electrical thresholds for activation of A- and C-fibers. (D) Non-potentiated response (NPR) and wind-up following 0.2- and 0.5-Hz stimulation. Data represent mean ± SEM. (E) Reflex responses and example traces at 0.2, 0.5, and 1 Hz. Note the increased response was observed at C-fiber (i.e., nociceptor) latency in the NCX3 mutant mice, and there was no change at Aδ or Aβ. Significance was assessed with two-way ANOVA (A) or one-way ANOVA (A)–(D), Bonferroni multiple comparisons test. p < 0.05, ∗∗p < 0.01. WT n = 21, NCX3HET n = 20, NCX3HOM n = 20. Two-way ANOVA and Sidak’s multiple comparisons test were applied in (E)—WT n = 5, NCX3HOM n = 5 p < 0.05, ∗∗p < 0.01, ∗∗∗p < 0.00. Rate constant was calculated using non-linear regression analysis (p = 0.0005).
Figure 8
Figure 8
Spinal administration of viral NCX3 reduces the second phase of the formalin response (A) Design of AAV, expressing the NCX3-B gene, tagged with c-Myc. (B) Splice variant NCX3-B, and not NCX3-AC, is neuronally expressed. (C) Viral transduction of HEK cells leads to membranous expression of NCX3-B. (D) Experimental timeline. (E and F) Expression of NCX3-B (c-Myc) in spinal cord sagittal sections. (G and H) Behavioral response to mechanical and thermal acute stimulation. (I–K) (I and J) Nocifensive behavior to first and second phase of the formalin test. (K) Formalin response over time. Data are mean ± SEM, eGFP n = 12, NCX3 n = 12. NS p > 0.05, p < 0.05. Unpaired Student’s t test. Scale bars, 50 μm.

Comment in

References

    1. Adhikari K., Fuentes-Guajardo M., Quinto-Sánchez M., Mendoza-Revilla J., Camilo Chacón-Duque J., Acuña-Alonzo V., Jaramillo C., Arias W., Lozano R.B., Pérez G.M., et al. A genome-wide association scan implicates DCHS2, RUNX2, GLI3, PAX1 and EDAR in human facial variation. Nat. Commun. 2016;7:11616. doi: 10.1038/ncomms11616. - DOI - PMC - PubMed
    1. Adhikari K., Mendoza-Revilla J., Sohail A., Fuentes-Guajardo M., Lampert J., Chacón-Duque J.C., Hurtado M., Villegas V., Granja V., Acuña-Alonzo V., et al. A GWAS in Latin Americans highlights the convergent evolution of lighter skin pigmentation in Eurasia. Nat. Commun. 2019;10:358. doi: 10.1038/s41467-018-08147-0. - DOI - PMC - PubMed
    1. Albuquerque C., Joseph D.J., Choudhury P., MacDermott A.B. Dissection, plating, and maintenance of dorsal horn neuron cultures. Cold Spring Harbor Protoc. 2009;2009 doi: 10.1101/pdb.prot5274. pdb.prot5274. - DOI - PubMed
    1. Alexander D.H., Novembre J., Lange K. Fast model-based estimation of ancestry in unrelated individuals. Genome Res. 2009;19:1655–1664. - PMC - PubMed
    1. Alsulaiman W.A.A., Quillet R., Bell A.M., Dickie A.C., Polgár E., Boyle K.A., Watanabe M., Roome R.B., Kania A., Todd A.J., et al. Characterisation of lamina I anterolateral system neurons that express Cre in a Phox2a-Cre mouse line. Sci. Rep. 2021;11:17912. doi: 10.1038/s41598-021-97105-w. - DOI - PMC - PubMed

Publication types