. 2022 Jun 21;3(6):100658.
doi: 10.1016/j.xcrm.2022.100658. Epub 2022 Jun 14.

Immunization with a self-assembling nanoparticle vaccine displaying EBV gH/gL protects humanized mice against lethal viral challenge

Affiliations

Immunization with a self-assembling nanoparticle vaccine displaying EBV gH/gL protects humanized mice against lethal viral challenge

Harman Malhi et al. Cell Rep Med. .

Abstract

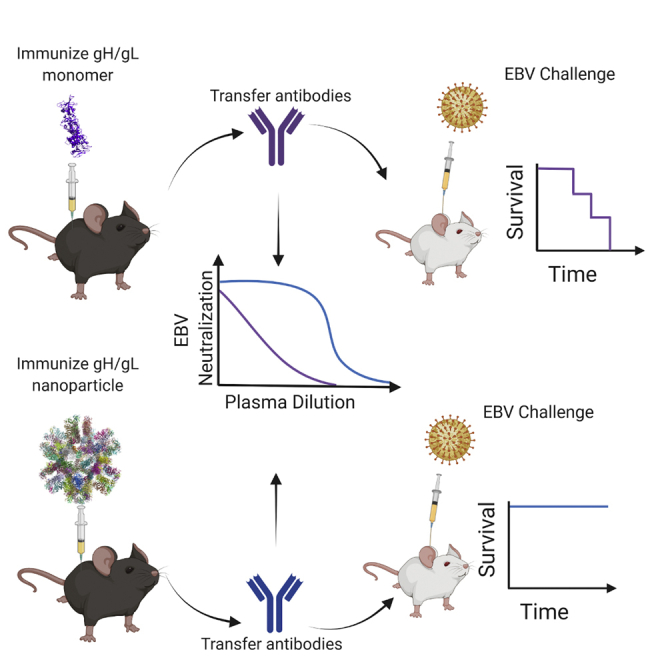
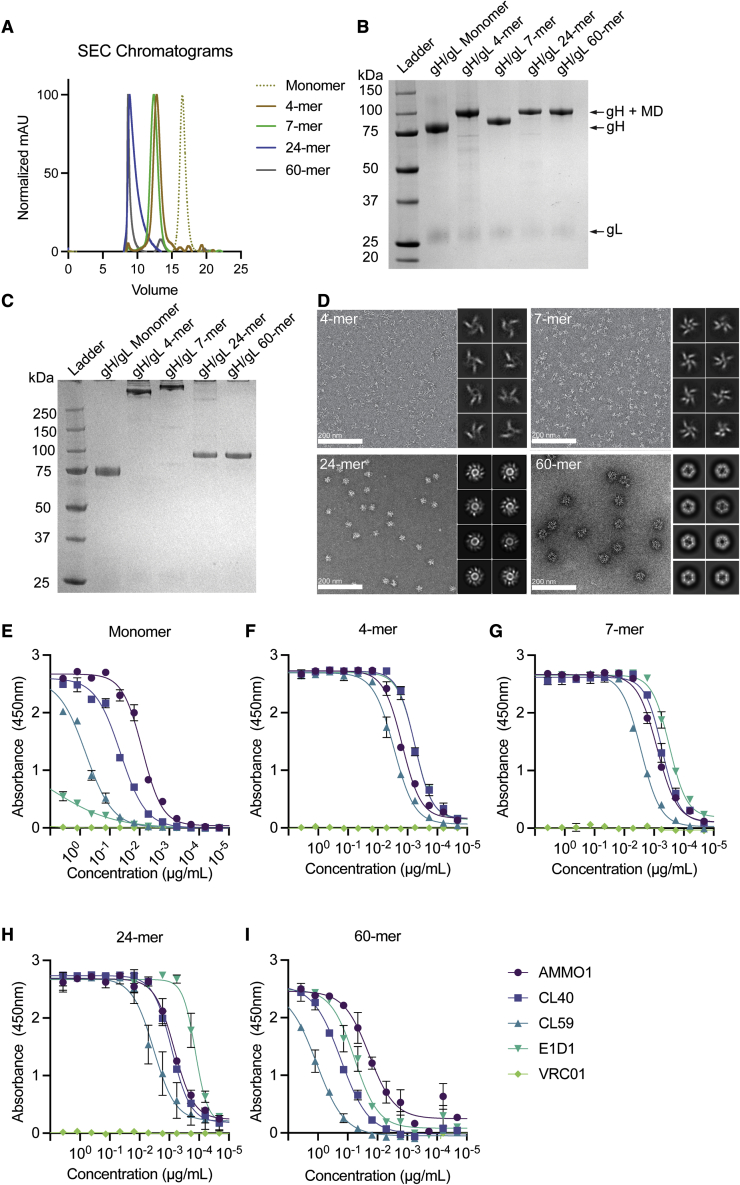
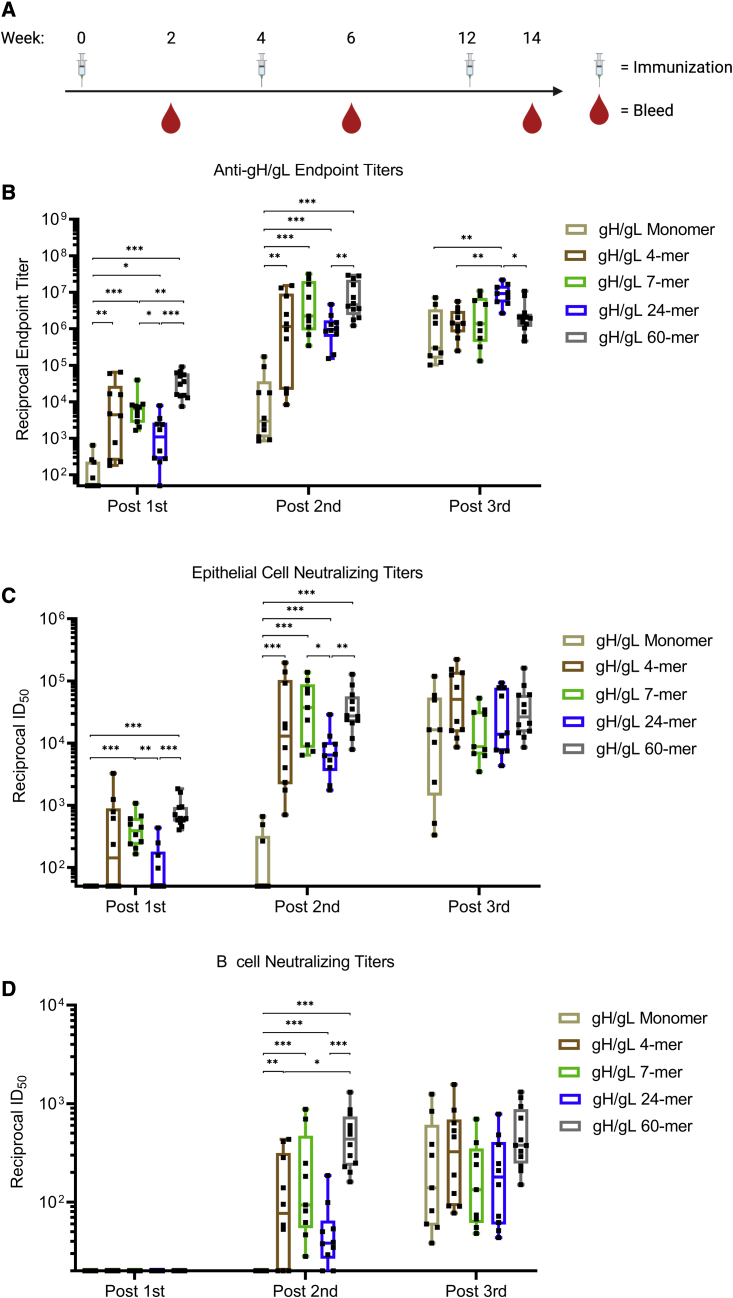
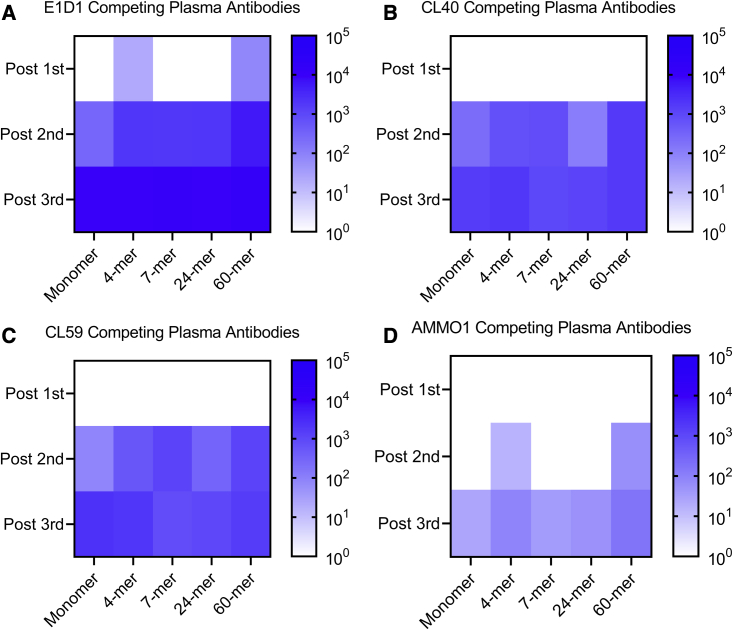
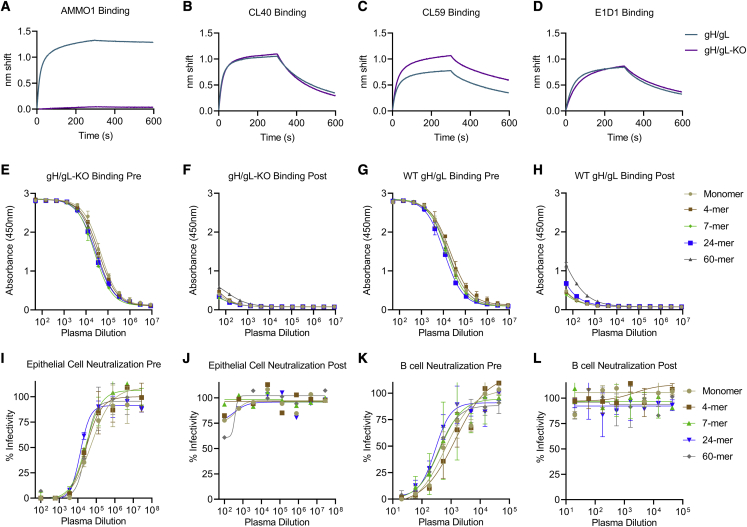
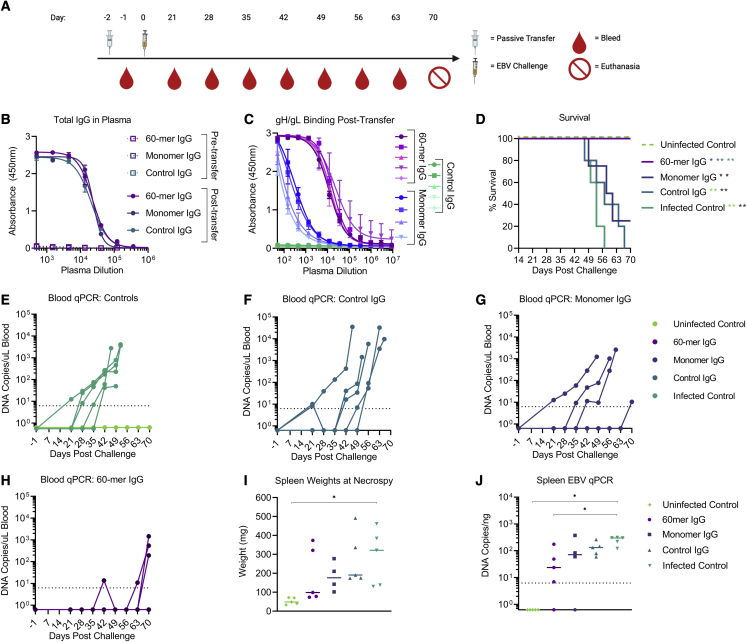
Epstein-Barr virus (EBV) is a cancer-associated pathogen responsible for 165,000 deaths annually. EBV is also the etiological agent of infectious mononucleosis and is linked to multiple sclerosis and rheumatoid arthritis. Thus, an EBV vaccine would have a significant global health impact. EBV is orally transmitted and has tropism for epithelial and B cells. Therefore, a vaccine would need to prevent infection of both in the oral cavity. Passive transfer of monoclonal antibodies against the gH/gL glycoprotein complex prevent experimental EBV infection in humanized mice and rhesus macaques, suggesting that gH/gL is an attractive vaccine candidate. Here, we evaluate the immunogenicity of several gH/gL nanoparticle vaccines. All display superior immunogenicity relative to monomeric gH/gL. A nanoparticle displaying 60 copies of gH/gL elicits antibodies that protect against lethal EBV challenge in humanized mice, whereas antibodies elicited by monomeric gH/gL do not. These data motivate further development of gH/gL nanoparticle vaccines for EBV.

Keywords: Epstein-Barr virus; antibodies; gH/gL; immunity; nanoparticles; vaccines.


Conflict of interest statement

Declaration of interests A.T.M. holds a patent (US11116835B2) on the AMMO1 mAb. N.P.K., J.Y.W., B.F., and C.W. have filed a non-provisional patent application on the secretion-optimized I3-01 variant used herein. N.P.K. is a co-founder, shareholder, paid consultant, and chair of the scientific advisory board of Icosavax, Inc. The N.P.K. lab has received an unrelated sponsored research agreement from Pfizer and GSK.

Figures

None
Graphical abstract
Figure 1
Figure 1
Biochemical and biophysical characterization of multimeric gH/gL nanoparticles (A) Monomeric gH/gL and multimeric gH/gL nanoparticles were analyzed by size-exclusion chromatography (SEC) on a Superose 6 column as indicated. (B) Reducing SDS-PAGE analysis of 1 μg of monomeric gH/gL or multimeric gH/gL nanoparticles. Bands corresponding to gL, gH, and gH fused to 4-, 7-, 24-, or 60-mer multimerization domains (MDs) are indicated with arrows. (C) Non-reducing SDS-PAGE analysis of 1 μg of the proteins in (B). (D) Negative-stain electron microscopy was performed on 4-, 7-, 24-, or 60-mer gH/gL nanoparticles as indicated. The eight most frequent 2D class averages for each particle are shown in the inlay. Scale bars represent 200 nm. (E–I) Binding of the anti-gH/gL mAbs E1D1, CL40, CL59, and AMMO1 to monomeric gH/gL (E) or multimeric gH/gL nanoparticles (F–I) were measured by ELISA as indicated. Each data point represents the mean, and error bars represent the standard deviation of two technical replicates. The anti-HIV-1 Env mAb VRC01 was used as a control for non-specific binding. See also Tables S1 and S2.
Figure 2
Figure 2
Immunogenicity of gH/gL nanoparticles (A) C57BL/6 mice (n = 10 mice for gH/gL monomer and 4-, 7-, and 24-mer, and n = 12 for gH/gL 60-mer) were immunized with monomeric gH/gL or multimeric gH/gL nanoparticles at weeks 0, 4, and 12. Blood was collected 2 weeks after each immunization. (B) Endpoint plasma binding titers to gH/gL were measured by ELISA. Each dot represents the reciprocal endpoint titer for an individual mouse measured in duplicate. Box and whisker plots represent the minimum, 25th percentile, median, 75th percentile, and maximum values. (C and D) The ability of plasma from individual mice to neutralize EBV infection of epithelial cells (C) or B cells (D). Each dot represents the reciprocal half-maximal inhibitory dilution (ID50) titer of an individual mouse. Plasma that did not achieve 50% neutralization at the lowest dilution tested (1:20) was assigned a value of 10. Box and whisker plots represent the minimum, 25th percentile, median, 75th percentile, and maximum values. Significant differences in B–D were determined using Mann-Whitney tests with Holm-adjusted p values (∗p < 0.05, ∗∗p < 0.01, ∗∗∗p < 0.001). See also Figures S1 and S2.
Figure 3
Figure 3
Plasma competition against monoclonal anti-gH/gL antibodies The ability of plasma pooled from groups of mice immunized with monomeric gH/gL or multimeric gH/gL nanoparticles to inhibit binding to a panel of anti-gH/gL antibodies to monomeric gH/gL was measured by ELISA. (A–D) The heatmap depicts the log reciprocal plasma dilution titers resulting in a 50% inhibition of (A) E1D1, (B) CL40, (C) CL59, or (D) AMMO1 antibodies at each time point. See Figure S3 for titration curves.
Figure 4
Figure 4
Depletion of AMMO1-KO-insensitive antibodies from pooled plasma (A–D) The binding of AMMO1 (A), CL40 (B), CL59 (C), and E1D1 (D) binding to gH/gL and gH/gL-KO (gH K73W,Y76A/gL) were measured using biolayer interferometry. (E–H) Antibodies were depleted from pooled plasma collected following three immunizations with gH/gL or gH/gL nanoparticles using gH/gL-KO conjugated magnetic beads. Pre- and post-depletion plasma samples were assayed for binding to gH/gL and gH/gL-KO by ELISA as indicated. Each data point represents mean, and error bars represent the standard deviation of two technical replicates. (I–L) The ability of plasma pre- and post-depletion to neutralize EBV infection was measured in B cells and epithelial cells. Each data point represents the mean, and error bars represent the standard deviation of two technical replicates.
Figure 5
Figure 5
gH/gL-nanoparticle-elicited antibodies protect humanized mice from lethal EBV challenge C57 BL6 mice were immunized with either monomeric or gH/gL 60-mer (n = 20 per group) at weeks 0 and 4. Blood was collected by cardiac puncture at week 6 and pooled, and the serum IgG was purified. (A) 0.5 mg of total IgG from monomer (n = 4) or 60-mer (n = 5) immunized mice was administered to humanized mice. A control group of mice received 0.5 mg total IgG purified from naive C57 BL6 mice (n = 5). (B) Total IgG was measured in pooled plasma from each group collected 3 days prior to and 1 day after IgG transfer. Each data point represents mean, and error bars represent the standard deviation of two technical replicates. (C) Anti-gH/gL IgG antibodies from plasma collected from individual humanized mice 1 day after transfer was measured by ELISA as indicated. Each data point represents mean, and error bars represent the standard deviation of two technical replicates. (D) Survival of humanized mice that received IgG purified from the indicated groups was monitored over a 70 day period following EBV challenge. An infected control group (n = 5) did not receive IgG prior to challenge, and an uninfected control group (n = 5) did not receive IgG or viral challenge. Significant differences in the survival data were determined using log rank tests (∗p < 0.05, ∗∗p < 0.01). (E–H) Viral DNA was quantified in the peripheral blood of infected and uninfected control (E), control IgG (F), monomer IgG (G), and 60-mer IgG (H) groups collected at the indicated time points via qPCR. Each series of connected dots represents an individual mouse at each time point analyzed, and the dashed line represents the limit of detection. (I) At necropsy, spleens were harvested and weighed. Each dot represents an individual mouse, and the bar represents the median weight in milligrams. Significant differences in spleen weight were determined using Mann-Whitney tests with Holm-adjusted p values (∗p < 0.05). Photographs of individual spleens are shown in Figure S5. (J) Viral DNA copy number was quantified in splenic DNA extracts at necropsy. Each dot represents an individual mouse, the bar represents the median copy number, and the dashed line indicates the limit of detection. Significant differences in viral DNA copy number were determined using Mann-Whitney tests with Holm-adjusted p values (∗p < 0.05). See also Figures S4 and S5.

Similar articles

Cited by

References

    1. Shannon-Lowe C., Rickinson A. The global landscape of EBV-associated tumors. Front. Oncol. 2019;9:713. doi: 10.3389/fonc.2019.00713. - DOI - PMC - PubMed
    1. Taylor G.S., Long H.M., Brooks J.M., Rickinson A.B., Hislop A.D. The immunology of Epstein-Barr virus-induced disease. Annu. Rev. Immunol. 2015;33:787–821. doi: 10.1146/annurev-immunol-032414-112326. - DOI - PubMed
    1. Cohen J.I. Vaccine development for Epstein-Barr virus. Adv. Exp. Med. Biol. 2018;1045:477–493. doi: 10.1007/978-981-10-7230-7_22. - DOI - PMC - PubMed
    1. Kutok J.L., Wang F. Spectrum of Epstein-Barr virus-associated diseases. Annu. Rev. Pathol. 2006;1:375–404. doi: 10.1146/annurev.pathol.1.110304.100209. - DOI - PubMed
    1. Khan G., Hashim M.J. Global burden of deaths from Epstein-Barr virus attributable malignancies 1990-2010. Infect. Agents Cancer. 2014;9:38. doi: 10.1186/1750-9378-9-38. - DOI - PMC - PubMed

Publication types