. 2022 Oct;194(10):1119-1131.
doi: 10.1055/a-1826-0049. Epub 2022 Jun 15.

MR Enterography in Crohn's Disease: Comparison of Contrast Imaging with Diffusion-weighted Imaging and a special Form of Color Coding

[Article in English, German]
Affiliations

MR Enterography in Crohn's Disease: Comparison of Contrast Imaging with Diffusion-weighted Imaging and a special Form of Color Coding

[Article in English, German]
Maja Jakob et al. Rofo. 2022 Oct.

Erratum in

Abstract

Purpose: We compared contrast-enhanced MR enterography with diffusion-weighted sequences to evaluate the validity of diffusion-weighted sequences for activity assessment in Crohn's disease compared to endoscopy. In addition, we investigated a new color-coded image post-processing technique in comparison with standard sequences and endoscopy.

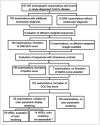
Materials and methods: Included were 197 MR enterographies (2015-2017) performed by using standardized examination protocols. The intestine was divided into 7 segments, which were compared separately. The accuracy of the MR examinations with regard to disease activity was validated using the Seo and MaRIA score and endoscopy findings. In addition, the image data were post-processed using a color-coded evaluation method (DCE tool on OsiriX).

Results: The comparison between contrast-enhanced and diffusion-weighted sequences showed a highly significant correlation for all bowel sections with a mean Spearman correlation coefficient of 0.876 (0.809-0.928). The color-coded image post-processing showed a sensitivity of 83.2 % and a specificity of 70.5 % in comparison with the MaRIA score. In comparison to endoscopy, a sensitivity of 81.3 % and a specificity of 70.5 %. In comparison with endoscopy, the MaRIA score showed a sensitivity of 80.2 % and a specificity of 84.0 % at a cut-off of 7. The visual score according to Seo showed a sensitivity of 85.7 % with a specificity of 77.0 % in the contrast-weighted examination and a sensitivity of 87.9 % and a specificity of 71.8 % for diffusion weighted images.

Conclusion: Diffusion-weighted sequences are as good as contrast-weighted sequences for assessing inflammatory activity in Crohn's disease. Contrast is often helpful for assessing complications, but this was not the purpose of this study. Visual imaging using color-coded data sets was similarly good at detecting inflammation.

Key points: · MR enterography is possible without contrast using diffusion-weighted imaging with comparable high informative value.. · Inflammatory activity in MR correlates sufficiently well with endoscopy. · The MaRIA and Seo scores are comparable in their validity.. · The colored representation of inflamed bowel sections is a promising technique..

Citation format: · Jakob M, Backes M, Schaefer C et al. MR Enterography in Crohn's Disease: Comparison of Contrast Imaging with Diffusion-weighted Imaging and a special Form of Color Coding. Fortschr Röntgenstr 2022; 194: 1119 - 1131.

Vergleich der entzündlichen Aktivität verschiedener Darmabschnitte in der kontrastmittelgestützten MR-Enterografie mit diffusionsgewichteten Sequenzen und dem endoskopischen Befund. Eine neue farbcodierte Bildnachverarbeitung wurde im Vergleich zu den Standardsequenzen und der Endoskopie untersucht.Eingeschlossen wurden 197 MR-Enterografien aus den Jahren 2015–2017. Der Darm wurde in 7 Segmente unterteilt, die separat verglichen wurden. Die Treffsicherheit der MR-Untersuchungen bezüglich entzündlicher Darmwandveränderungen wurde mittels Endoskopie sowie Seo- und MaRIA-Scores validiert. Zusätzlich wurden die Bilddaten mithilfe eines farbcodierten Auswerteverfahrens (DCE-Tool auf OsiriX) nachverarbeitet.Der Vergleich zwischen kontrastgestützten und diffusionsgewichteten Sequenzen ergab für alle Darmabschnitte eine hochsignifikante Korrelation mit einem mittleren Korrelationskoeffizienten nach Spearman von 0,876 (0,809–0,928). Die farbcodierte Bildnachverarbeitung zeigte im Vergleich mit dem MaRIA-Score eine Sensitivität von 83,2 % und eine Spezifität von 70,5 %. Im Vergleich zur Endoskopie fand sich eine Sensitivität von 81,3 % und eine Spezifität von 70,5 %. Der MaRIA-Score zeigte im Vergleich mit der Endoskopie beim Cut-Off von 7 eine Sensitivität von 80,2 % bei einer Spezifität von 84,0 %. Der visuelle Score nach Seo zeigte bei der kontrastgestützten Untersuchung eine Sensitivität 85,7 % bei einer Spezifität von 77,0 %, bei der diffusionsgewichteten Sequenz eine Sensitivität von 87,9 % und einer Spezifität von 71,8 %.Diffusionsgewichtete Sequenzen sind zur Beurteilung der Entzündungsaktivität bei Morbus Crohn ebenso gut geeignet wie kontrastgestützte Sequenzen. Zur Beurteilung von Komplikationen ist eine Kontrastmittelgabe oft hilfreich. Die Darstellung mittels farbcodierter Datensätze konnte Entzündungen ähnlich gut nachweisen und könnte die Befunddemonstration in der interdisziplinären Zusammenarbeit verbessern helfen. · Die MR-Enterografie ist auch ohne Kontrastmittel mittels diffusionsgewichteter Bildgebung mit vergleichbar hoher Aussagekraft möglich.. · Die Entzündungsaktivität in der MRT korreliert ausreichend gut mit dem endoskopischen Befund.. · Die verwendeten Scores MaRIA und Seo sind in ihrer Aussage vergleichbar.. · Die farbige Darstellung entzündeter Darmabschnitte kann eine rasche Einschätzung der regionären Verteilung einer Crohn-Manifestation ‚auf einen Blick‘ erleichtern und könnte die Befunddemonstration in der interdisziplinären Zusammenarbeit verbessern.. · Jakob M, Backes M, Schaefer C et al. MR Enterography in Crohnʼs Disease: Comparison of Contrast Imaging with Diffusion-weighted Imaging and a special Form of Color Coding. Fortschr Röntgenstr 2022; 194: 1119 – 1131.


Conflict of interest statement

The authors declare that they have no conflict of interest.

Figures

Fig. 1
Fig. 1
Contrast-enhanced image and parametric representation of the “area under the curve” with image subtraction. Below the colour gradient of the “Jet” colour scale.
Fig. 2
Fig. 2
Overview of the evaluation. * Absence of the native angio sequence; therefore no calculation of the MaRIA score possible. In another 2 cases, only the transverse colon could not be assessed, as this section of the intestine was outside the selected FOV. ** In 10 cases, one of the 4 required sequences (native or post-KM) was missing, whereby it was not possible to determine whether these were not measured or were lost during transfer to the archive; in 2 cases, the movement artefacts were too strong and the image overlay could not be evaluated; in 2 cases, the position of the FOV was changed during the angio images and an overlay or calculation of the parametric map was not possible.
Fig. 3
Fig. 3
Scatterplot and histogram of the evaluation for the intestinal segment of the jejunum. Seo DCE = Seo score including contrast-enhanced imaging. Seo DWI = Seo score including diffusion-weighted imaging.
Fig. 4
Fig. 4
Scatterplot and histogram of the evaluation for the intestinal segment of the ileum. Seo DCE = Seo score including contrast-enhanced imaging. Seo DWI = Seo score including diffusion-weighted imaging.
Fig. 5
Fig. 5
Scatterplot and histogram of the evaluation for the intestinal segment of the terminal ileum. Seo DCE = Seo score including contrast-enhanced imaging. Seo DWI = Seo score including diffusion-weighted imaging.
Fig. 6
Fig. 6
Scatterplot and histogram of the evaluation for the intestinal segment of the ascending colon. Seo DCE = Seo score including contrast-enhanced imaging. Seo DWI = Seo score including diffusion-weighted imaging.
Fig. 7
Fig. 7
Scatterplot and histogram of the evaluation for the intestinal segment of the transverse colon. Seo DCE = Seo score including contrast-enhanced imaging. Seo DWI = Seo score including diffusion-weighted imaging.
Fig. 8
Fig. 8
Scatterplot and histogram of the evaluation for the intestinal segment of the descending colon. Seo DCE = Seo score including contrast-enhanced imaging. Seo DWI = Seo score including diffusion-weighted imaging.
Fig. 9
Fig. 9
Scatterplot and histogram of the evaluation for the intestinal segment of the sigma. Seo DCE = Seo score including contrast-enhanced imaging. Seo DWI = Seo score including diffusion-weighted imaging.
Fig. 10
Fig. 10
Area under the curve ROC value: Seo score DCE vs. MaRIA.
Fig. 11
Fig. 11
ROC curve: Seo score DCE vs. endoscopy.
Fig. 12
Fig. 12
ROC curve: Seo DWI vs. endoscopy.
Fig. 13
Fig. 13
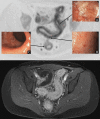
Crohnʼs colitis in a 23-year-old female patient: comparison of endoscopy vs. diffusion imaging: A. proximal sigmoid, B. distal sigmoid, C. rectum. In A and B, clear evidence of inflammation in both procedures, in localisation C endoscopically relatively bland appearance compared to the clearly recognisable transmural inflammation in the diffusion image. The contrast-enhanced image shows the massive inflammation and, more impressively, a small abscess.
Fig. 14
Fig. 14
ROC curve: MaRIA score vs. endoscopy.
Fig. 15
Fig. 15
ROC curve: colour integral vs. endoscopy.
Fig. 16
Fig. 16
Left side: Parametric representation of the “area under the curve” without image subtraction. Right side: Parametric representation of the same structures after image subtraction.
Abb. 1
Abb. 1
KM Aufnahme und parametrische Darstellung der „area under the curve“ mit erfolgter Bildersubtraktion. Darunter der Farbverlauf der Farbskala „Jet“.
Abb. 2
Abb. 2
Übersicht über die erfolgte Auswertung. * Fehlen der nativen Angio-Sequenz; daher keine Berechnung des MaRIA-Scores möglich. In weiteren 2 Fällen konnte lediglich das Colon transversum nicht mitbeurteilt werden, da dieser Darmabschnitt außerhalb des gewählten FOV lag. ** In 10 Fällen Fehlen einer der 4 benötigten Sequenzen (nativ oder post-KM), wobei nicht eruierbar war, ob diese nicht gemessen wurden oder beim Übertrag ins Archiv verloren gingen; in 2 Fällen waren die Bewegungsartefakte zu stark und die Bilderüberlagerung nicht auswertbar; bei 2 Fällen wurde während den Angio-Aufnahmen die Position des FOV verändert und eine Überlagerung bzw. Berechnung der parametrischen Karte war nicht möglich.
Abb. 3
Abb. 3
Scatterplot und Histogramm der Auswertung für den Darmabschnitt Jejunum. Seo DCE = Seo-Score inklusive kontrastmittelgestützter Bildgebung. Seo DWI = Seo-Score inklusive diffusionsgewichteter Bildgebung.
Abb. 4
Abb. 4
Scatterplot und Histogramm der Auswertung für den Darmabschnitt Ileum. Seo DCE = Seo-Score inklusive kontrastmittelgestützter Bildgebung. Seo DWI = Seo-Score inklusive diffusionsgewichteter Bildgebung.
Abb. 5
Abb. 5
Scatterplot und Histogramm der Auswertung für den Darmabschnitt terminales Ileum. Seo DCE = Seo-Score inklusive kontrastmittelgestützter Bildgebung. Seo DWI = Seo-Score inklusive diffusionsgewichteter Bildgebung.
Abb. 6
Abb. 6
Scatterplot und Histogramm der Auswertung für den Darmabschnitt Colon ascendens. Seo DCE = Seo-Score inklusive kontrastmittelgestützter Bildgebung. Seo DWI = Seo-Score inklusive diffusionsgewichteter Bildgebung.
Abb. 7
Abb. 7
Scatterplot und Histogramm der Auswertung für den Darmabschnitt Colon transversum. Seo DCE = Seo-Score inklusive kontrastmittelgestützter Bildgebung. Seo DWI = Seo-Score inklusive diffusionsgewichteter Bildgebung.
Abb. 8
Abb. 8
Scatterplot und Histogramm der Auswertung für den Darmabschnitt Colon descendens. Seo DCE = Seo-Score inklusive kontrastmittelgestützter Bildgebung. Seo DWI = Seo-Score inklusive diffusionsgewichteter Bildgebung.
Abb. 9
Abb. 9
Scatterplot und Histogramm der Auswertung für den Darmabschnitt Sigma. Seo DCE = Seo-Score inklusive kontrastmittelgestützter Bildgebung. Seo DWI = Seo-Score inklusive diffusionsgewichteter Bildgebung.
Abb. 10
Abb. 10
Fläche unter der Kurve ROC-Wert: Seo-Score DCE gegen MaRIA.
Abb. 11
Abb. 11
ROC-Kurve: Seo-Score DCE gegen Endoskopie.
Abb. 12
Abb. 12
ROC-Kurve: Seo DWI gegen Endoskopie.
Abb. 13
Abb. 13
Crohn-Colitis bei einer 23-jährigen Patientin: Vergleich Endoskopie vs. Diffusionsaufnahme: A. proximales Sigma, B. distales Sigma, C. Rectum. Bei A und B in beiden Verfahren deutliche Hinweise auf Entzündung, bei Lokalisation C endoskopisch blanderes Erscheinungsbild im Vergleich zu der deutlich erkennbaren transmuralen Entzündung in der Diffusionsaufnahme. In der kontrastmittelgestützten Aufnahme zeigt sich die massive Entzündung und eindrucksvoller eine kleine Abszedierung.
Abb. 14
Abb. 14
ROC-Kurve: MaRIA-Score gegen Endoskopie.
Abb. 15
Abb. 15
ROC-Kurve: Farbintegral gegen Endoskopie.
Abb. 16
Abb. 16
Links parametrische Darstellung der „area under the curve“ ohne Bildersubtraktion. Rechts parametrische Darstellung derselben Strukturen nach erfolgter Bildersubtraktion.

References

    1. Griffin N, Grant L A, Anderson S et al.Small bowel MR enterography: problem solving in Crohnʼs disease. Insights Imaging. 2012;3:251–263. doi: 10.1007/s13244-012-0154-3. - DOI - PMC - PubMed
    1. Albert J G, Martiny F, Krummenerl A et al.Diagnosis of small bowel Crohnʼs disease: a prospective comparison of capsule endoscopy with magnetic resonance imaging and fluoroscopic enteroclysis. Gut. 2005;54:1721–1727. doi: 10.1136/gut.2005.069427. - DOI - PMC - PubMed
    1. Schreyer A GLD, Koletzko S, Hoffmann J C et al.Aktualisierte S3-Leitlinie zur Diagnostik des M. Crohn – Radiologische Untersuchungstechniken. RöFo. 2010;182(02):116–121. - PubMed
    1. Friedrich C, Fajfar A, Pawlik M et al.Magnetic resonance enterography with and without biphasic contrast agent enema compared to conventional ileocolonoscopy in patients with Crohnʼs disease. Inflamm Bowel Dis. 2012;18:1842–1848. doi: 10.1002/ibd.22843. - DOI - PubMed
    1. Golder S K, Schreyer A G, Endlicher E et al.Comparison of capsule endoscopy and magnetic resonance (MR) enteroclysis in suspected small bowel disease. Int J Colorectal Dis. 2006;21:97–104. doi: 10.1007/s00384-005-0755-0. - DOI - PubMed