. 2022 Jul 1;209(1):77-92.
doi: 10.4049/jimmunol.2100366. Epub 2022 Jun 15.

Realization of the T Lineage Program Involves GATA-3 Induction of Bcl11b and Repression of Cdkn2b Expression

Affiliations

Realization of the T Lineage Program Involves GATA-3 Induction of Bcl11b and Repression of Cdkn2b Expression

Patrycja K Thompson et al. J Immunol. .

Abstract

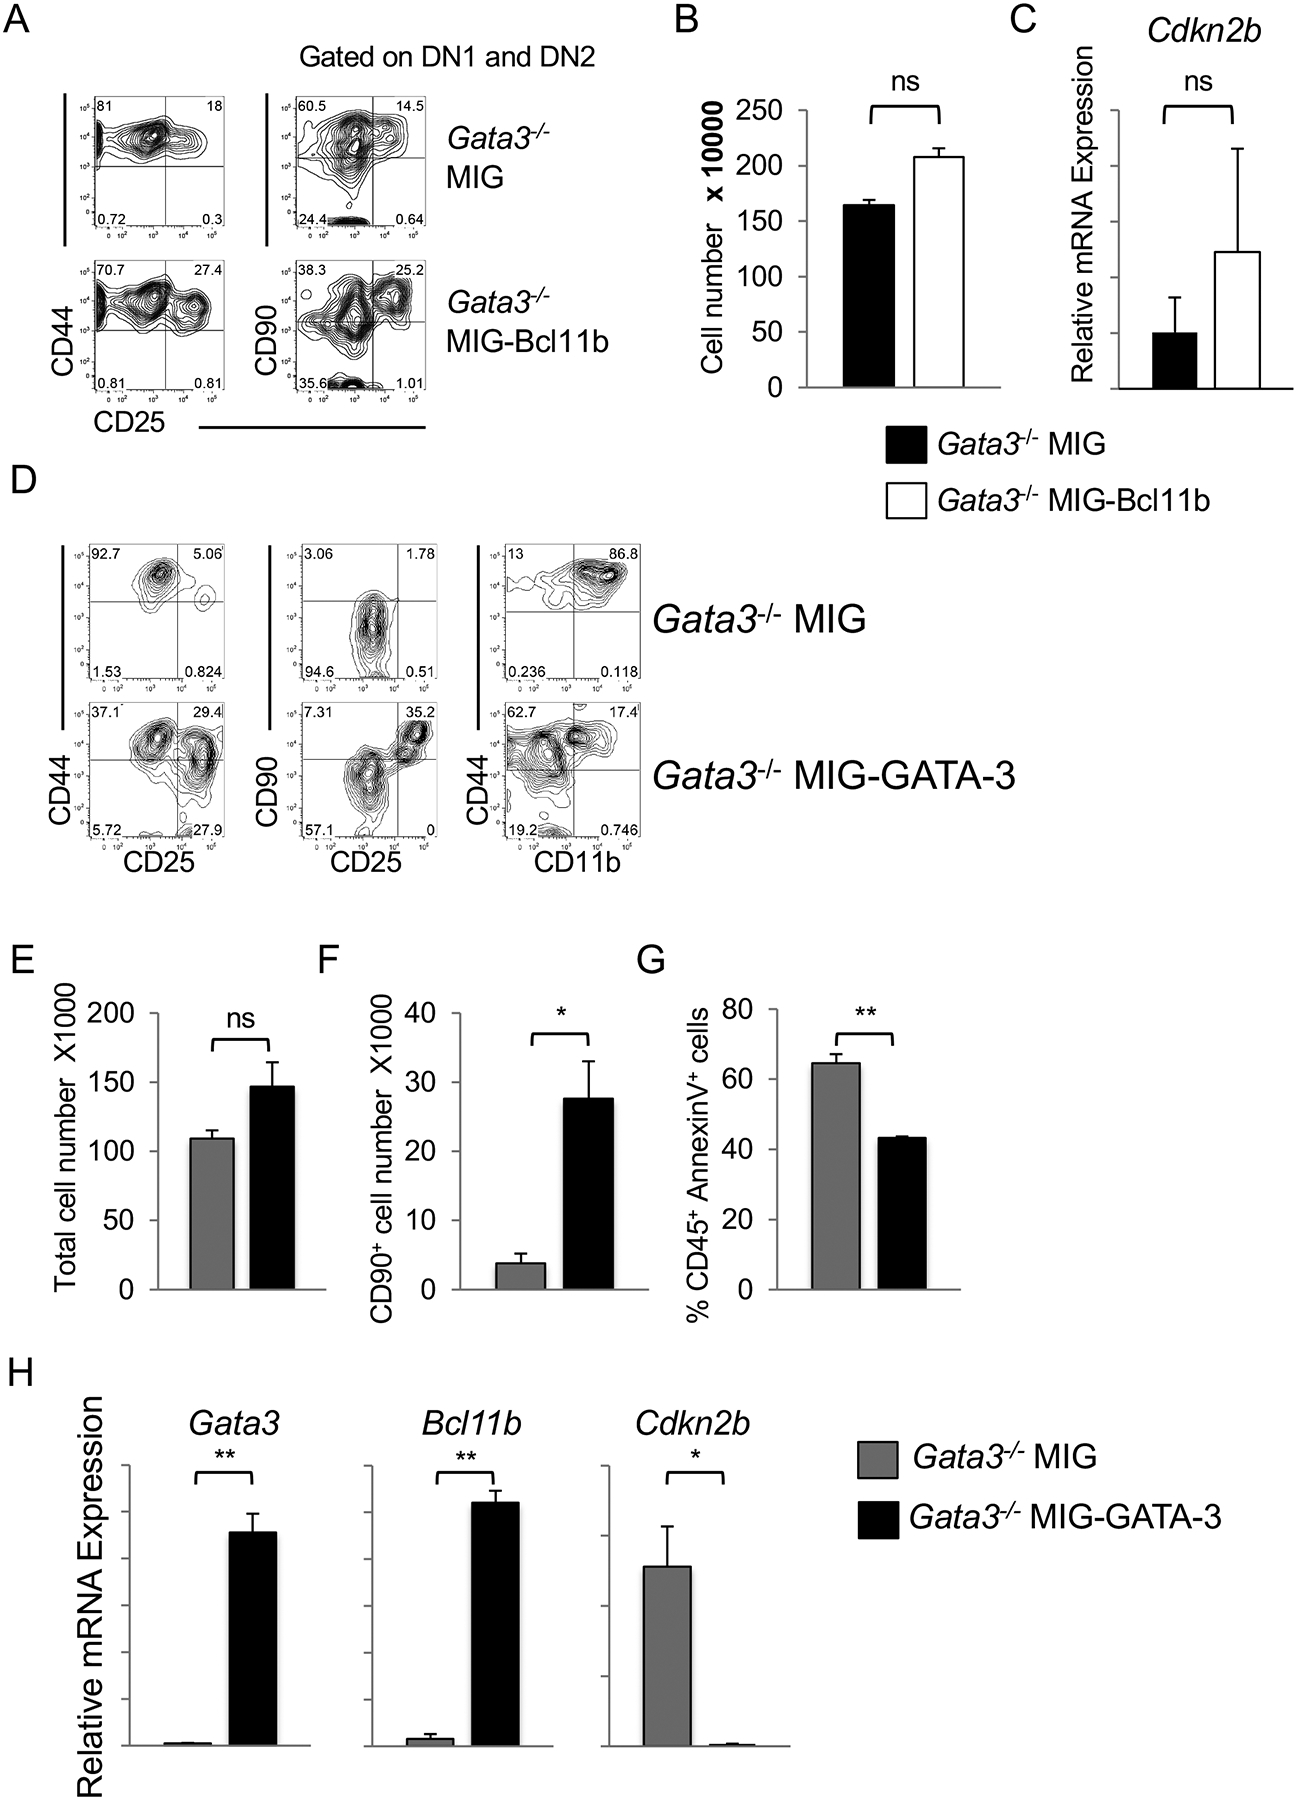
The zinc-finger transcription factor GATA-3 plays a crucial role during early T cell development and also dictates later T cell differentiation outcomes. However, its role and collaboration with the Notch signaling pathway in the induction of T lineage specification and commitment have not been fully elucidated. We show that GATA-3 deficiency in mouse hematopoietic progenitors results in an early block in T cell development despite the presence of Notch signals, with a failure to upregulate Bcl11b expression, leading to a diversion along a myeloid, but not a B cell, lineage fate. GATA-3 deficiency in the presence of Notch signaling results in the apoptosis of early T lineage cells, as seen with inhibition of CDK4/6 (cyclin-dependent kinases 4 and 6) function, and dysregulated cyclin-dependent kinase inhibitor 2b (Cdkn2b) expression. We also show that GATA-3 induces Bcl11b, and together with Bcl11b represses Cdkn2b expression; however, loss of Cdkn2b failed to rescue the developmental block of GATA-3-deficient T cell progenitor. Our findings provide a signaling and transcriptional network by which the T lineage program in response to Notch signals is realized.


Figures

Figure 1.
Figure 1.. Analysis of GATA-3 expression in double negative thymocytes.
(A) Immunofluorescence analysis of GATA-3 expression in DN thymocyte subsets. Cells were sorted, fixed, permeabilized and stained for GATA-3, or with IgG isotype control, and DNA counterstained with DAPI. Representative images are shown. (B) Whole cell and nuclear fluorescence pixel intensities were summed for individual cells in microscopy images. The nuclear perimeter was traced in the DAPI-stained images and duplicated in the GATA3-stained images, as detailed in (53). The measurements are plotted as the mean ratio of nuclear to cytoplasmic fluorescence signal (n=6 or 7 cells for each value) with SEMs and *p ≥0.05 or **p≥0.005 (relative to DN1d), indicated. (C) Whole cell fluorescence pixel intensities were summed for individual cells in microscopy images. Each bar represents a number of cells at a given fluorescence level. Statistical analyses are relative to DN1d population, *p < 0.05 and **p < 0.005 (one-tailed Student t-test).
Figure 2.
Figure 2.. GATA-3 deficiency abrogates early T-lymphopoiesis in ESC-derived progenitors cultured in the presence of Notch signals and results in gene expression changes.
(A) Flow cytometry analysis for cell surface expression of CD44 and CD25 and (B) CD8 and CD4 of Gata3+/− and Gata3−/− ESC-derived hematopoietic progenitors cultured, for the indicated time points, on OP9-DL1, after an initial 8 d co-culture on OP9-C cells to induce hematopoiesis. Live cells were gated as CD45+. Results are representative of at least three independent experiments. (C) Gata3+/− and Gata3−/− ESC-derived progenitors were cultured on OP9-C cells until inception of hematopoiesis and then transferred to and maintained on OP9-DL1 cells for the remainder of the co-culture. Flow cytometry analysis was performed at indicated time points for presence of CD45+ Annexin V+ cells. Data shows fold difference in Annexin V staining in CD45+ cells from each culture (mean + SEM; n = 3). (D) Co-cultures of Gata3+/− and Gata3−/− ESC and OP9-DL1 cells were sorted 36 hours after the initial transfer from OP9-C cells and CD45+ cells analyzed for global gene expression changes by microarray. Present/absent/moderate calls were established by GCOS and probe sets where Affy mas5 detection were present in 2 out of 3 or 3 out of 3 independent experiments were selected. Genes with absent/moderate calls were excluded from further analysis. Probe sets mapping to designated EntrezGene IDs were identified and multiple probe sets mapping to a single gene were collapsed. Results are shown as z-score. Student t-test, p-value < 0.05 (Gata3+/− vs Gata3−/−). (E) Heat map showing cell cycle regulators and pro-apoptotic genes that were differentially expressed between Gata3+/− and Gata3−/− ESC-derived progenitors cultured on OP9-DL1 cells.
Figure 3.
Figure 3.. GATA-3 is required for T-lymphopoiesis and inhibits myeloid fate in developing thymocytes.
Bone marrow-derived LSK progenitors from 6–8 week old GATA-3+/f-, GATA-3f/f-, or GATA-3f/f Cdkn2bf/f-Vav-Cre+ mice were isolated by flow cytometry. (A) Cells were cultured on OP9-DL4 cells for 8 days and analyzed by flow cytometry for the expression of the indicated markers, with the cellularity of DN2, DN3 and CD11b+ cells indicated in the side bar graphs. (B) Cells were cultured on OP9-DL4 cells for 14 days and further analyzed for the expression of the indicated markers, with the analysis of CD44 and CD25 expression on CD4CD8 DN gated cells. Results are representative of at least three independent experiments, and cellularity for the indicated subsets are shown in the side bar graphs.
Figure 4.
Figure 4.. GATA-3 is required to inhibit apoptosis but is not required to inhibit B-lymphopoiesis in the presence of Notch signals.
(A) Gata3+/− and Gata3−/− bone marrow LSK progenitors were cultured on either OP9-DL1 or OP9-C cells and analyzed for presence of CD45+AnnexinV+ cells by flow cytometry at designated time points. All data is representative of at least three independent experiments. The AnnexinV+ PI+ cell frequencies of the day 8 cultures are indicated in the side bar graph (n=3). (B-C) ESCs of indicated genotypes were cultured on OP9-C cells until day 8 of co-culture, and thereafter placed on OP9-DL1 cells (B) or on OP9-C cells (C). Gata3+/− and Gata3−/− cultures were analyzed by flow cytometry on day 19 and Rbpj+/− and Rbpj−/− cultures, on day 17. Results are representative of at least three independent experiments.
Figure 5.
Figure 5.. GATA-3 inhibits myeloid but not B-lineage fate in response to Notch signals.
(A, B) Co-cultures of Gata3+/− and Gata3−/− LSKs with OP9-DL1 cells were sorted for CD44+CD25CD117+ DN1 or CD44CD25+CD117+ DN2 cells and re-seeded on either OP9-DL1 or OP9-C cells for 7 days. Lympho- and myelopoiesis were assessed by flow cytometry. (C) Bone marrow-derived LSKs from Gata3+/− and Gata3−/− mice were cultured on OP9-C cells and presence of CD11b+ and CD19+ cells analyzed by flow cytometry on day 11 of co-culture. All plots in (A-C) were gated on CD45+ cells. Numbers within each plot indicate the percentage of cells in the indicated gates or quadrants. Representative plots from at least 3 independent experiments are shown. (D) qPCR for transcripts expressed in DN2 cells derived from Gata3+/− (white bars) and Gata3−/− (black bars) bone marrow LSK-OP9-DL1 co-cultures sorted on day 8. All samples were normalized to β-actin. Mean and SEM were calculated from 3 independent qPCR analyses.
Figure 6.
Figure 6.. GATA-3-deficient progenitors express cell cycle inhibitory and pro-apoptotic genes, which block early T cell development.
(A) qPCR for transcripts expressed by DN2 cells sorted after 8 days of co-culture of Gata3+/− (white bars) and Gata3−/− (black bars) bone marrow LSKs with OP9-DL1. All samples were normalized to β-actin. Mean and SEM were calculated from 3 independent qPCR analyses. (B) Wild type bone marrow sorted LSKs co-cultured with OP9-DL4 were retrovirally transduced with either MIY or MIY-Cdkn2b vector on day 5. Cells were sorted 24 hours post-transduction as CD45+ YFP+ CD44+CD25 DN1, cultured on OP9-DL4 cells for 3 days. Cultures were analyzed by flow cytometry for expression of CD44 and CD25 as well as (C) Annexin V and PI. (D) Percentage of Annexin V+ CD45+ cells present in the wells of wild type YFP+ DN1 progenitors expressing MIY (white bar) or MIY-Cdkn2b (black bar) co-cultured with OP9-DL4 for 3 days. (E) Wild type bone marrow LSKs were cultured with OP9-DL4 cells for 5 days and DN1 (CD44+CD25) or DN2 (CD44+CD25+) cells purified by flow cytometry. Sorted DN1 or DN2 cells were cultured on OP9-DL4 cells in the presence or absence of PD0332991 (2 μg/ml) and co-cultures analyzed after 3 days for presence of CD44 and CD25 as well as (F) Annexin V+ and PI+ cells. (G) Percentage of Annexin V+ CD45+ untreated (white bar) or PD0332991-treated (black bar) DN1 and DN2 cells 3 days after the DN1/DN2 sort. All data is represented as mean ± SEM; n = 2, *p < 0.05 (Student t-test).
Figure 7.
Figure 7.. GATA-3 and Bcl11b bind to and mediate repression of the Cdkn2b locus in developing thymocytes.
(A) Location of primers spanning all predicted GATA-3 bindings sites upstream of Cdkn2b and Cdkn2a TSS as identified by rVista, genomatix MatlInspector and manual scan in VectorNTI. (B) Putative GATA-3 RES were identified by rVista, genomatix MatlInspector and manual scan in VectorNTI. ChIP assay was performed on wild type DN1, DN2 and DN3 thymocytes with anti-GATA-3 and control IgG antibodies. Enrichment was quantified by qPCR, normalized to β-actin and calculated as percentage of input. Enrichment was further compared to a known GATA-3 DNA target located in a Tcrb enhancer region. Data is presented as fold increase of GATA-3 enrichment over the control IgG. (C) Chromatin was immunoprecipitated with anti-GATA-3, anti- H3K273me or control IgG antibodies from a combination of wild type DN1, DN2 and DN3 thymocytes. Enrichment for GATA-3 (mean ± SEM, n = 3) and (D) repressive H3K273me epigenetic signature (mean ± SEM, n = 2) at promoter regions of Cdkn2a/b and percentage of input samples before ChIP (1% of total starting cell population) were quantified by qPCR and data normalized to β-globin gene expression (*p < 0.05, Student t-test). (E) Location of primers spanning Bcl11b RES upstream of Cdkn2b as identified by ChIP-seq (See Supplemental Figure 2B) and USC genome browser. (F) Chromatin immunoprecipitation from wild type DN1, DN2 and DN3 cells with anti-CTIP2 (Bcl11b) or control IgG antibodies. Enrichment for Bcl11b (mean ± SEM, n = 3) at promoter region of Cdkn2b, along with 1% of percentage input, were quantified by qPCR and data normalized to β-globin gene expression (*p < 0.05, Student t-test).
Figure 8.
Figure 8.. GATA-3, in collaboration with Bcl11b, induces cell survival and repression of the Cdkn2b locus in early T cell development in the presence of Notch signals.
(A) Gata3−/− bone marrow-derived LSKs were retrovirally transduced with MIG or MIG-Bcl11b vector for 24 hours and sorted GFP+ cells cultured on OP9-DL4. GFP+ CD45+ cells were analyzed by flow cytometry on day 9 of co-culture for presence of CD44 and CD25 expression (left panels) with additional gating on CD44+CD25 DN1 and CD44CD25+ DN2 cells (right panels) to assess CD90 expression. Plots are representative of at least three independent experiments. (B) Cellular fold expansion of MIG (black bar) or MIG-Bcl11b (white bar) Gata3−/−-OP9-DL4 co-cultures on day 9 (mean ± SEM; n = 2). (C) qPCR for Cdkn2b transcript expression by CD45+ GFP+ cells sorted from Gata3−/−-MIG or –MIG-Bcl11b cultured on OP9-DL4 cells for 9 days (mean ± SEM; n = 2). (D) Gata3−/− bone marrow-derived LSKs cultured on OP9-DL4 for 4 days were retrovirally transduced with either MIG or MIG-GATA-3 construct for 24 hours. CD45+ GFP+ cells were sorted and cultured on OP9-DL4 cells and GFP+ CD45+ cells analyzed by flow cytometry 3 days later with additional gating on CD44+CD25 DN1 and CD44CD25+ DN2 cells (middle panels). Plots are representative of at least three separate experiments. (E) Cellular fold expansion of MIG (grey bar) or MIG-GATA-3 (black bar) Gata3−/−-OP9-DL4 co-cultures 3 days post-transduction (mean ± SEM; n = 3). (F) Percentage of GFP+ CD45+ CD90+ CD25+ and (G) Annexin+ cells arising from MIG- or MIG-GATA-3 transduced Gata3−/− cells cultured on OP9-DL4 for 3 and 6 days, respectively (mean ± SEM; n = 3). (H) qPCR for transcripts expressed by Gata3−/− MIG- or MIG-GATA-3-transduced cells (CD45+ GFP+) 3 days post-transduction and co-cultured with OP9-DL4 cells (mean ± SEM; n = 3), *p < 0.05, **p < 0.01; Student t-test.

References

    1. Petrie HT, and Zuniga-Pflucker JC. 2007. Zoned out: functional mapping of stromal signaling microenvironments in the thymus. Annu Rev Immunol 25: 649–679. - PubMed
    1. Bhandoola A, von Boehmer H, Petrie HT, and Zuniga-Pflucker JC. 2007. Commitment and developmental potential of extrathymic and intrathymic T cell precursors: plenty to choose from. Immunity 26: 678–689. - PubMed
    1. Sambandam A, Maillard I, Zediak VP, Xu L, Gerstein RM, Aster JC, Pear WS, and Bhandoola A. 2005. Notch signaling controls the generation and differentiation of early T lineage progenitors. Nat Immunol 6: 663–670. - PubMed
    1. Heinzel K, Benz C, Martins VC, Haidl ID, and Bleul CC. 2007. Bone marrow-derived hemopoietic precursors commit to the T cell lineage only after arrival in the thymic microenvironment. J Immunol 178: 858–868. - PubMed
    1. Benz C, Martins VC, Radtke F, and Bleul CC. 2008. The stream of precursors that colonizes the thymus proceeds selectively through the early T lineage precursor stage of T cell development. J Exp Med 205: 1187–1199. - PMC - PubMed

Publication types

Substances