. 2023 Feb;72(2):325-337.
doi: 10.1136/gutjnl-2021-325808. Epub 2022 Jun 15.

Blockade of interleukin 10 potentiates antitumour immune function in human colorectal cancer liver metastases

Affiliations

Blockade of interleukin 10 potentiates antitumour immune function in human colorectal cancer liver metastases

Kevin M Sullivan et al. Gut. 2023 Feb.

Abstract

Objective: Programmed cell death protein 1 (PD-1) checkpoint inhibition and adoptive cellular therapy have had limited success in patients with microsatellite stable colorectal cancer liver metastases (CRLM). We sought to evaluate the effect of interleukin 10 (IL-10) blockade on endogenous T cell and chimeric antigen receptor T (CAR-T) cell antitumour function in CRLM slice cultures.

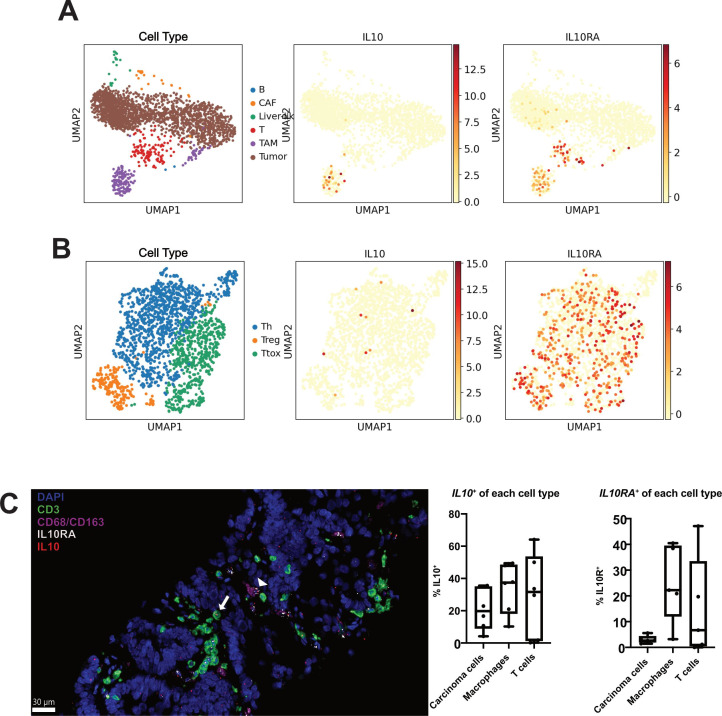
Design: We created organotypic slice cultures from human CRLM (n=38 patients' tumours) and tested the antitumour effects of a neutralising antibody against IL-10 (αIL-10) both alone as treatment and in combination with exogenously administered carcinoembryonic antigen (CEA)-specific CAR-T cells. We evaluated slice cultures with single and multiplex immunohistochemistry, in situ hybridisation, single-cell RNA sequencing, reverse-phase protein arrays and time-lapse fluorescent microscopy.

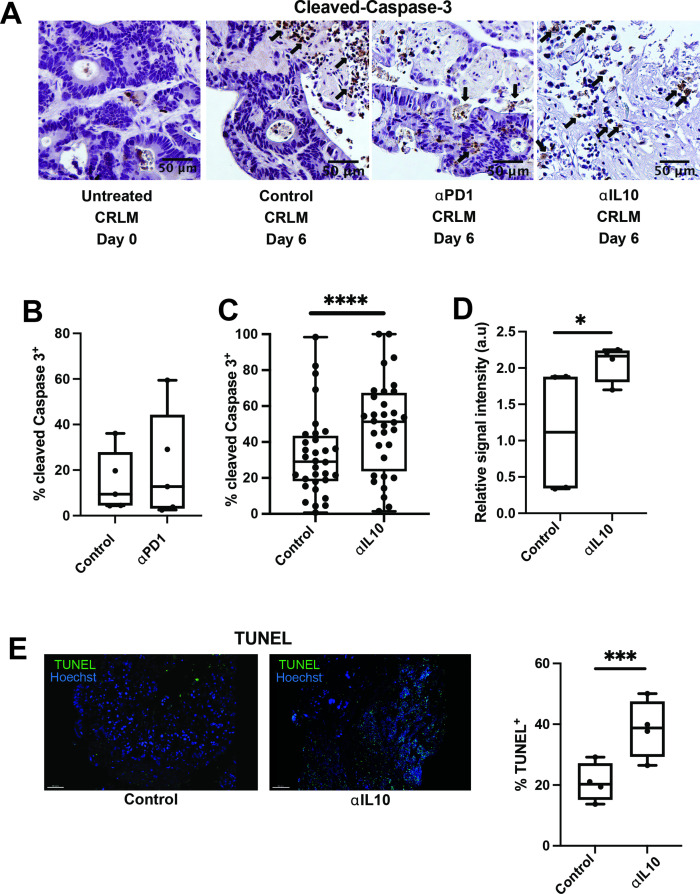
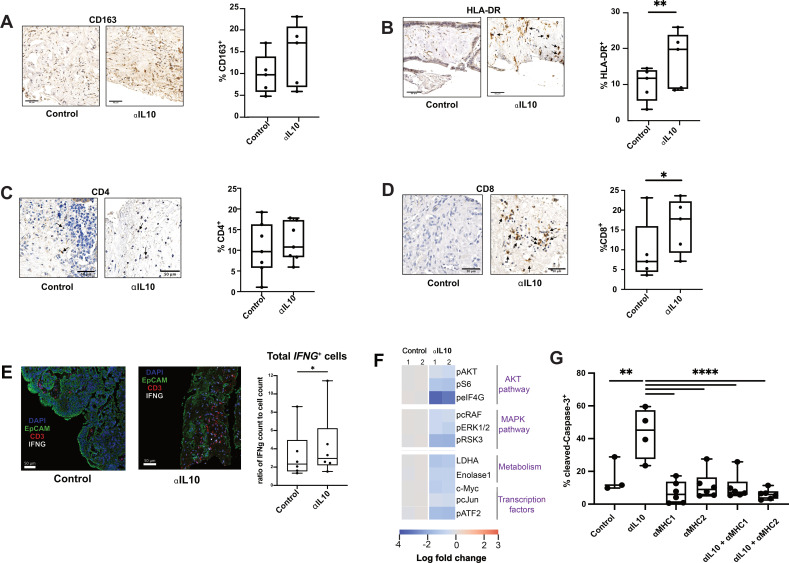
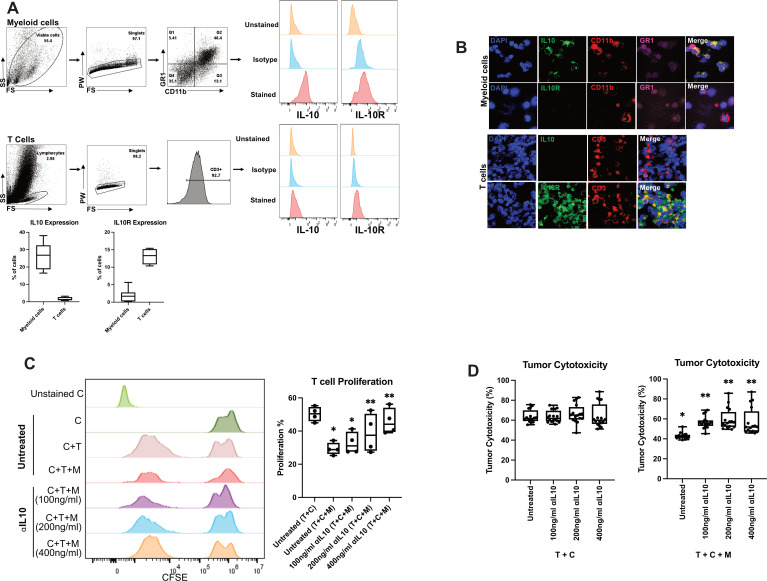
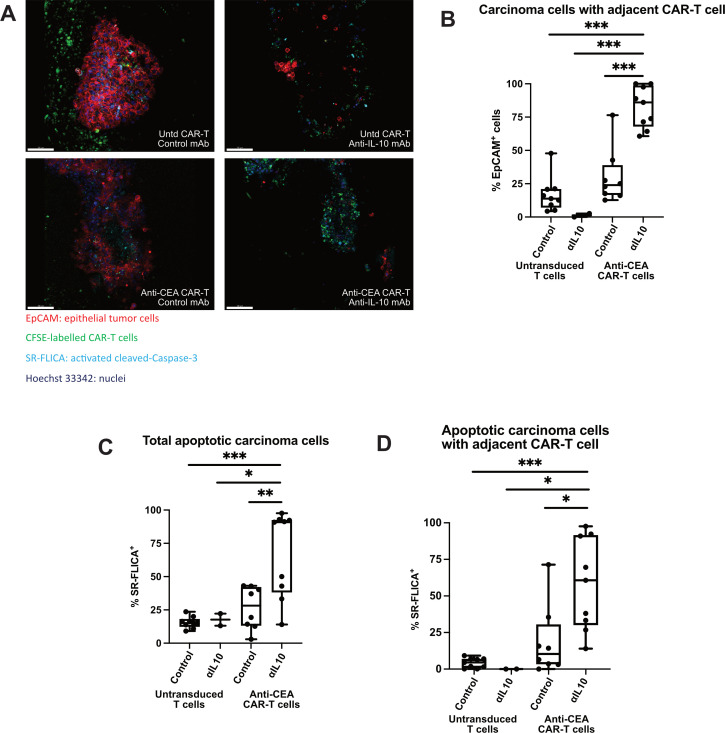
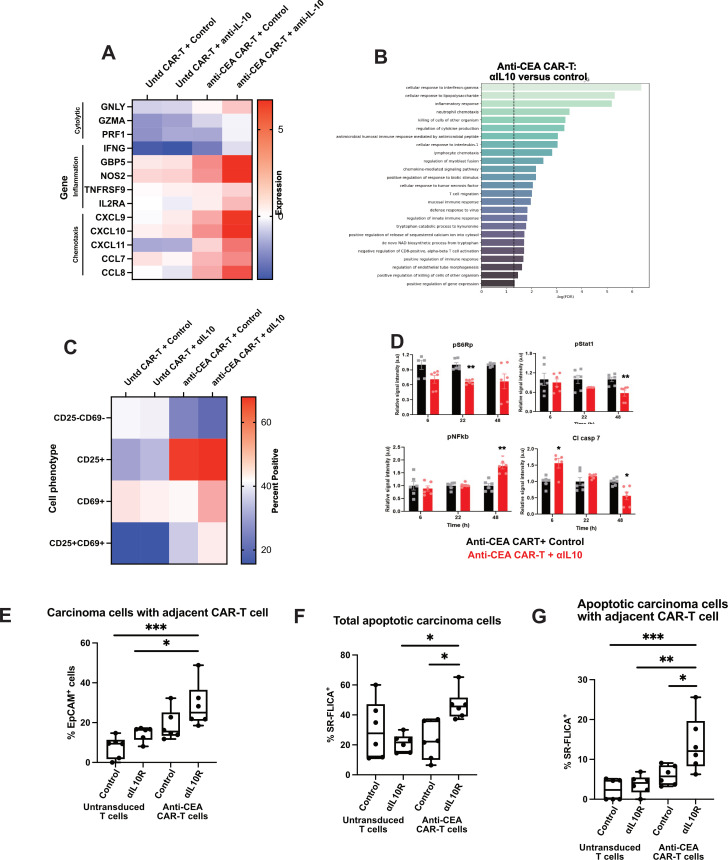
Results: αIL-10 generated a 1.8-fold increase in T cell-mediated carcinoma cell death in human CRLM slice cultures. αIL-10 significantly increased proportions of CD8+ T cells without exhaustion transcription changes, and increased human leukocyte antigen - DR isotype (HLA-DR) expression of macrophages. The antitumour effects of αIL-10 were reversed by major histocompatibility complex class I or II (MHC-I or MHC-II) blockade, confirming the essential role of antigen presenting cells. Interrupting IL-10 signalling also rescued murine CAR-T cell proliferation and cytotoxicity from myeloid cell-mediated immunosuppression. In human CRLM slices, αIL-10 increased CEA-specific CAR-T cell activation and CAR-T cell-mediated cytotoxicity, with nearly 70% carcinoma cell apoptosis across multiple human tumours. Pretreatment with an IL-10 receptor blocking antibody also potentiated CAR-T function.

Conclusion: Neutralising the effects of IL-10 in human CRLM has therapeutic potential as a stand-alone treatment and to augment the function of adoptively transferred CAR-T cells.

Keywords: COLORECTAL METASTASES; IMMUNOLOGY; IMMUNOTHERAPY; INTERLEUKINS; LIVER METASTASES.


Conflict of interest statement

Competing interests: VGP is a member of the scientific advisory board for TriSalus Life Sciences. He has served as a consultant for Merck & Company in 2018, GlaxoSmithKline in 2019, Imvax in 2019, Takeda in 2020 and Umoja in 2022. He has research funding from AstraZeneca, Ipsen, Merck, OncoResponse and NGM. The funders had no role in the conceptualisation, design, data collection, analysis, decision to publish or preparation of the manuscript. The anti-CEA CAR vector was provided by TNK Therapeutics, who had no role in the conceptualisation, design, data collection, analysis or preparation of the manuscript. SCK served as an advisor for TNK Therapeutics until December 2019, is currently Chief Medical Officer of TriSalus Life Sciences and SAB member of Nkarta, Takeda and Sentibio, and has received research funding from Takeda and Nkata.

Figures

Figure 1
Figure 1
Interleukin 10 (IL-10) is produced by carcinoma cells, macrophages and T cells. (A) UMAP plots of all cell clusters of single cell RNA sequencing (scRNAseq) data from n=3 colorectal cancer liver metastases (CRLM) tumours. TAM, tumour-associated macrophages (purple); CAF, cancer-associated fibroblasts (orange); B cells (blue); liver-like cells (green); T cells (red); tumour cells (brown). IL10 and IL10RA expression highlighted in red/orange. (B) UMAP plots of T cell cluster of scRNAseq data from n=3 CRCLM tumours. Th, helper T cells (blue); Ttox, cytotoxic T cells (green); Treg, regulatory T cells (orange). IL10 and IL10RA expression highlighted in red/orange. (C) Multiplex immunohistochemistry was performed for T cells (CD3, green), macrophages (CD68/CD163, pink) and nuclei (DAPI, blue) with additional in situ hybridisation for IL10 (red) and IL10RA (white). A representative image with IL10+ IL10RA+ macrophage (white arrowhead) and IL10+ IL10RA+ T cell (white arrow) is shown. Quantification of the proportion of IL10+ and IL10+ cells within each cell type is also shown (n=5 patient tumours). Scale bar=30 µm. Data points represent each human tumour sample.
Figure 2
Figure 2
Interleukin 10 (IL-10) blockade facilitates significantly increased apoptosis of carcinoma cells. (A) Immunohistochemistry (IHC) for cleaved Caspase-3 was performed on tumour slice culture (TSC) after 6 days of treatment with immunomodulating agents. Representative images at 20x magnification from day 0, and then day 6 of antibody control, anti-programmed cell death protein-1 (anti-PD-1) antibody and ⍺IL-10 treated slices. Black arrows denote apoptotic cells positive for cleaved Caspase-3 (brown). Scale bar=50 µm. (B) Quantification of percentage of cleaved Caspase-3+ cells in slices treated with control or anti-PD-1 antibody (n=4 separate human cases with at least two slices per case). (C) Quantification of percentage of cleaved Caspase-3+ cells in slices treated with control or ⍺IL-10 (n=32 separate human cases with at least two slices per case). Data points represent each human tumour sample which consists of counts over multiple high-powered fields (hpf) in multiple slices to account for intratumoral heterogeneity. Student’s t-test. ****p<0.0001. (D) Reverse phase protein array with relative signal intensity of total cleaved Caspase-3 in colorectal cancer liver metastases TSC after 6 days in culture with αIL-10 (n=4 cases). Student’s t-test. *p<0.05. (E) Terminal deoxynucleotidyl transferase dUTP nick end labeling (TUNEL) staining with fluorescent microscopy demonstrating TUNEL+ cells (green) after 6 days of αIL-10 (n=4 separate human cases). Scale bar=30 µm. Data points represent each human tumour sample which consists of counts over multiple hpf in multiple slices to account for intratumoral heterogeneity. Student’s t-test. ***p<0.001.
Figure 3
Figure 3
Increased CD8+ T-cell population and inflammatory immune microenvironment occurs after interleukin 10 (IL-10) blockade. (A) Representative images at 20x magnification from IHC staining for CD163 of fixed TSC treated with control or αIL-10 after 4 days and quantification by cell count of CD163+ cells (n=5 separate human tumours). Scale bar=50 µm. Data points represent each human tumour sample which consists of counts over multiple hpf in multiple slices to account for intratumoral heterogeneity. Not significant by Student’s t-test. (B) Representative images at 20x magnification from IHC of fixed TSC treated with control or αIL-10 after 4 days, with black arrows denoting HLA-DR+ cells, and quantification by cell count of HLA-DR+ cells (n=5 separate human tumours). Scale bar=50 µm. Data points represent each human tumour sample which consists of counts over multiple hpf in multiple slices to account for intratumoral heterogeneity. Student’s t-test. *p<0.05. (C) Representative images at 20x magnification from IHC of fixed TSC treated with control or αIL-10 after 4 days, with black arrows denoting CD4+ cells, and quantification by cell count of CD4+ cells (n=7 separate human tumours). Scale bar=50 µm. Data points represent each human tumour sample which consists of counts over multiple hpf in multiple slices to account for intratumoral heterogeneity. (D) Representative images at 20x magnification from IHC of fixed TSC treated with control or αIL-10 after 4 days, with black arrows denoting CD8+ cells. Quantification by cell count of CD8+ cells (n=5 separate human tumours). Scale bar=50 µm. Data points represent each human tumour sample which consists of counts over multiple hpf in multiple slices to account for intratumoral heterogeneity. Student’s t-test. *p<0.05. (E) Multiplex IHC was performed for T cells (CD3, red), carcinoma cells (EpCAM, green) and nuclei (DAPI, blue) with additional in situ hybridisation for IFNG (white). Quantification of proportion of IFNG+ per total number of cells by ISH and by IHC are also shown (n=6 patient tumours). Scale bar=50 µm. Data points represent each human tumour sample. Student’s t-test. *p<0.05. (F) RPPA data from slices treated with antibody control or IL-10 blockade showing downregulation of various molecular pathways. (G) Quantification of percentage of cleaved Caspase-3+ cells following αIL-10 with or without MHC blockade shows that while αIL-10 alone increases apoptotic cell proportion, the effect is reversible with MHC blockade back to below baseline levels of cell death. Representative data with data points representing a slice from one human tumour experiment, repeated in a total of three human tumour samples with similar results. Error bars display SEM. ANOVA with multiple comparisons. **p<0.01, ****p<0.0001.
Figure 4
Figure 4
Treatment with interleukin 10 (IL-10) antibody reverses murine myeloid cell suppressive activity of chimeric antigen receptor T (CAR-T) cells. (A) Phenotypic characterisation of CAR-T cells and CD11b+ cells isolated 4 days post-tumour generation was performed as per the gating strategy. Representative flow cytometry plots showing expression of IL-10 and IL-10R for myeloid cells (n=7) and CAR-T (n=4). (B) Immunofluorescence performed on CAR-T and myeloid cells confirmed expression of IL-10 (green) in myeloid cells and IL-10R (green) on CAR-T cells. (C) Carboxyfluorescein diacetate succinimidyl ester (CFSE)-labelled CAR-T (C) cells were cocultured with myeloid cells (M) isolated from liver metastases (LM) tumour-bearing mice and MC38CEA tumour cells (T) in 1:1:1 ratio. Cells were treated with 100 ng/mL or 200 ng/mL or 400 ng/mL anti-IL-10 antibody for 24 hours. *p<0.005 versus untreated (T+C), **p<0.01 versus untreated (T+C+M). (D) The in vitro cytotoxic activity of CAR-T (C) cells was evaluated by incubating MC38CEA (T) cells with myeloid cells (M) treated with at a 1:1:1 ratio as shown in C. Corresponding tumour and CAR-T controls were used for the assay. *p<0.0001 versus T+C, **p<0.001 versus untreated T+C+M. All data were analysed by one-way analysis of variance and Tukey’s test or two-sided Student’s t-test.
Figure 5
Figure 5
Interleukin 10 (IL-10) blockade enhances chimeric antigen receptor T (CAR-T) cell migration and tumour apoptosis. (A) Live staining and fluorescent microscopy of colorectal cancer liver metastases (CRLM) tumour slice culture (TSC) treated with untransduced CAR-T with control, untransduced CAR-T with ⍺IL-10, anti-carcinoembryonic antigen (CEA) CAR-T with control, and anti-CEA CAR-T with ⍺IL-10 show CFSE+ CAR-T cells (green) within the tumour and near epithelial carcinoma cells (red) when antigen-specific CAR-T are used in combination with αIL-10. Apoptotic cells are shown when activated cleaved Caspases are present and positive for the SR-FLICA reagent (cyan). Tumour slices were imaged after 1 day of treatment. Scale bar=100 µm. (B) Quantification of the carcinoma cells with a CAR-T cell nearby (defined as within 20 µm) with untransduced control CAR-T cells and anti-CEA CAR-T cells treated concurrently with or without αIL-10. Data points represent each high-powered fields (hpf) area imaged, with 3 hpf imaged in each tumour (n=3 separate human tumour samples). Analysis of variance with multiple comparisons. ***p<0.001. (C, D) Quantification of the percentage of total carcinoma cells that are SR-FLICA+, and SR-FLICA+ carcinoma cells with a CAR-T cell nearby (defined as within 20 µm) after untransduced control CAR-T and anti-CEA CAR-T cells are treated concurrently with or without αIL-10. Data points represent each hpf area imaged, with 3 hpf imaged in each tumour (n=3 separate human tumour samples). Analysis of variance with multiple comparisons. *p<0.05, **p<0.01, ***p<0.001.
Figure 6
Figure 6
Interleukin 10 (IL-10) blockade increases antigen-specific chimeric antigen receptor T (CAR-T) cell activation through a mechanism that requires intact IL-10R on CAR-T cells. Human colorectal cancer liver metastases (CRLM) slices were treated with control or carcinoembryonic antigen (CEA)-specific CAR-T cells, plus control or αIL-10, for 1 day. (A) Tumour slices were analysed by bulk RNA sequencing with heatmap demonstrating expression of genes related to T cell cytolytic functioning, activation and migration/chemotaxis for each treatment group (n=2 tumours). Dark red denotes high expression of the listed gene and dark blue denotes comparably low expression normalised to housekeeping genes. (B) Gene expression pathways increased with anti-CEA CAR-T cells are treated with αIL-10 versus control. Untd, untransduced control CAR-T cells. (C) Representative case of flow cytometry performed on CAR-T cells after treatment with control or IL-10 blocking antibody demonstrating expression of CD25 and CD69 (n=2 tumours). (D) Reverse phase protein array showing expression of pS6, Stat1, nuclear factor kappa B (NF-κB) and cleaved Caspase-7 protein of slices treated with anti-CEA CAR-T cells and either control or αIL-10 at 6, 22 and 48 hours. After 6 hours, cleaved Caspase-7 expression is increased in the slices treated with the CAR-T in addition to αIL-10, and at 22 hours pS6 expression is decreased. After 48 hours, Stat1 and cleaved Caspase-7 are decreased with an increase in NF-κB. Each data point represents a replicate from n=2 cases. Student’s t-test. *p<0.05; **p<0.01. (E–G) Following treatment of either untransduced control or anti-CEA CAR-T cells with either control or ⍺IL-10R, the CAR-T cells alone were incubated with tumour slice culture and live imaging was performed. Again, quantification of the carcinoma cells with a CAR-T cell adjacent (defined as within 20 µm), total SR-FLICA+ carcinoma cells and SR-FLICA+ carcinoma cells with a CAR-T cell adjacent. Data points represent each high-powered fields (hpf) area imaged, with 3 hpf imaged in each tumour (n=3 separate human tumour samples). Analysis of variance with multiple comparisons. *p<0.05, **p<0.01, ***p<0.001.

References

    1. Siegel RL, Miller KD, Fedewa SA, et al. Colorectal cancer statistics, 2017. CA Cancer J Clin 2017;67:177–93. 10.3322/caac.21395 - DOI - PubMed
    1. Engstrand J, Nilsson H, Strömberg C, et al. Colorectal cancer liver metastases - a population-based study on incidence, management and survival. BMC Cancer 2018;18:78 10.1186/s12885-017-3925-x - DOI - PMC - PubMed
    1. Koopman M, Kortman GAM, Mekenkamp L, et al. Deficient mismatch repair system in patients with sporadic advanced colorectal cancer. Br J Cancer 2009;100:266–73. 10.1038/sj.bjc.6604867 - DOI - PMC - PubMed
    1. Topalian SL, Hodi FS, Brahmer JR, Safety BJR, et al. Safety, activity, and immune correlates of anti-PD-1 antibody in cancer. N Engl J Med 2012;366:2443–54. 10.1056/NEJMoa1200690 - DOI - PMC - PubMed
    1. Brahmer JR, Tykodi SS, Chow LQM, et al. Safety and activity of anti-PD-L1 antibody in patients with advanced cancer. N Engl J Med 2012;366:2455–65. 10.1056/NEJMoa1200694 - DOI - PMC - PubMed

Publication types

MeSH terms