

Comprehensive Serum Proteome Profiling of Cytokine Release Syndrome and Immune Effector Cell-Associated Neurotoxicity Syndrome Patients with B-Cell ALL Receiving CAR T19
- PMID: 35705524
- PMCID: PMC9444956
- DOI: 10.1158/1078-0432.CCR-22-0822
Comprehensive Serum Proteome Profiling of Cytokine Release Syndrome and Immune Effector Cell-Associated Neurotoxicity Syndrome Patients with B-Cell ALL Receiving CAR T19
Abstract
Purpose: To study the biology and identify markers of severe cytokine release syndrome (CRS) and immune effector cell-associated neurotoxicity syndrome (ICANS) in children after chimeric antigen receptor T-cell (CAR T) treatment.
Experimental design: We used comprehensive proteomic profiling to measure over 1,400 serum proteins at multiple serial timepoints in a cohort of patients with B-cell acute lymphoblastic leukemia treated with the CD19-targeted CAR T CTL019 on two clinical trials.
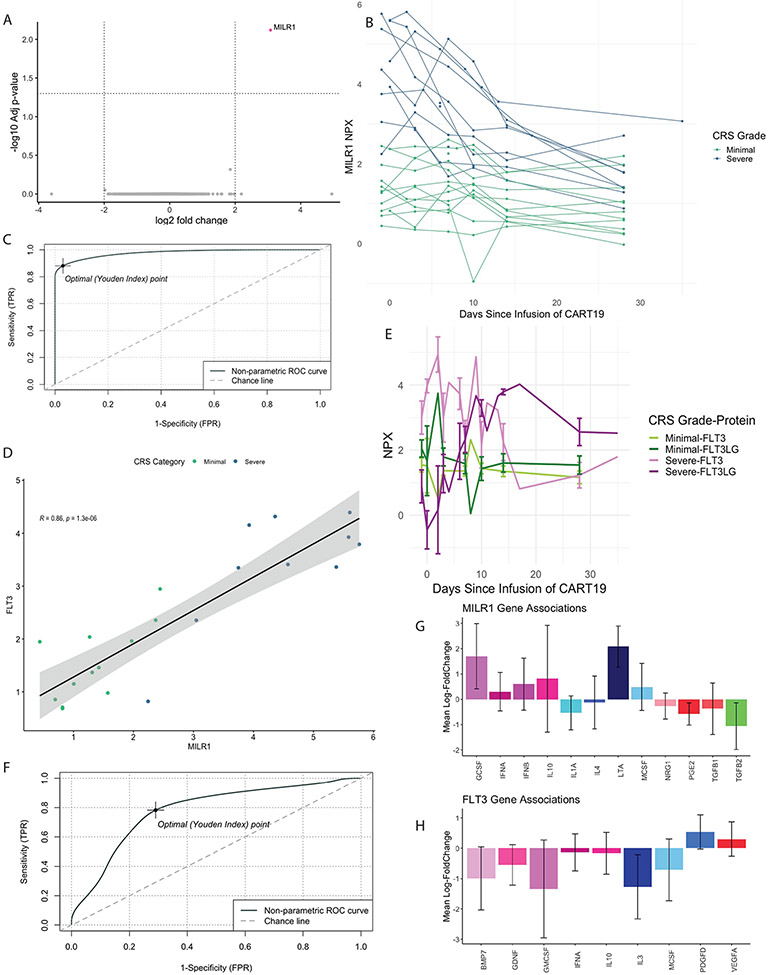
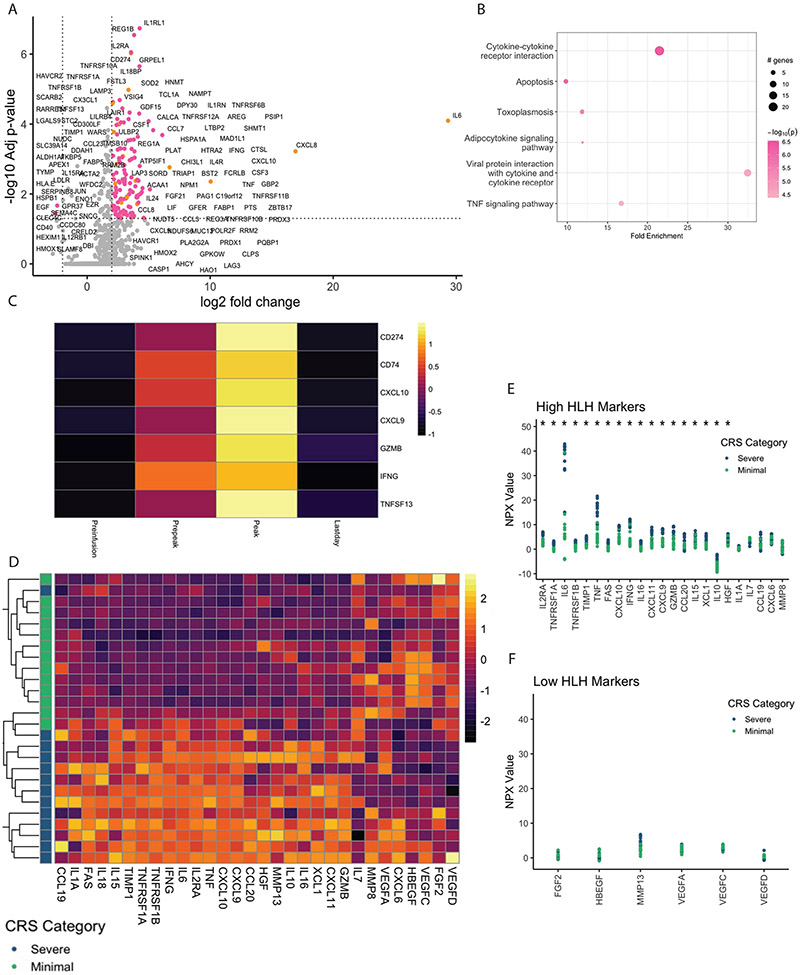
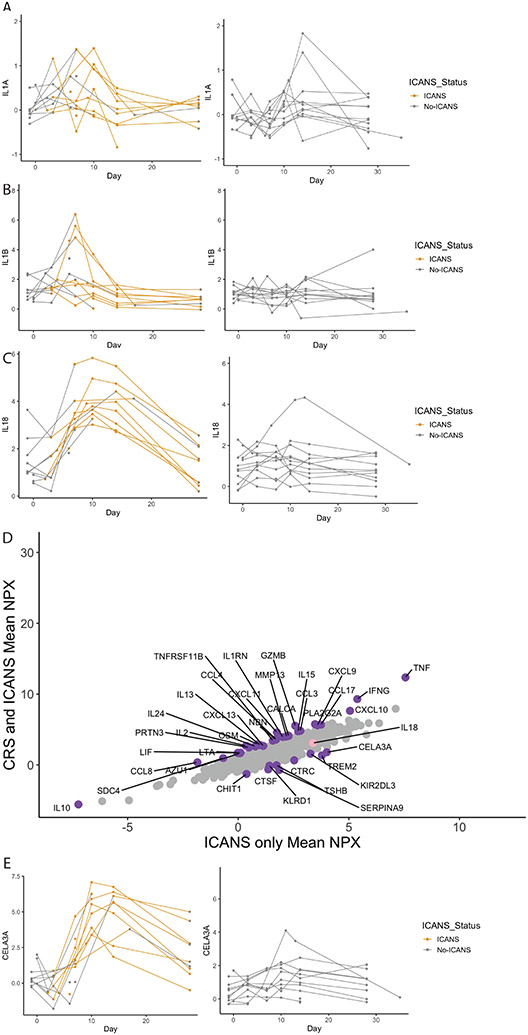
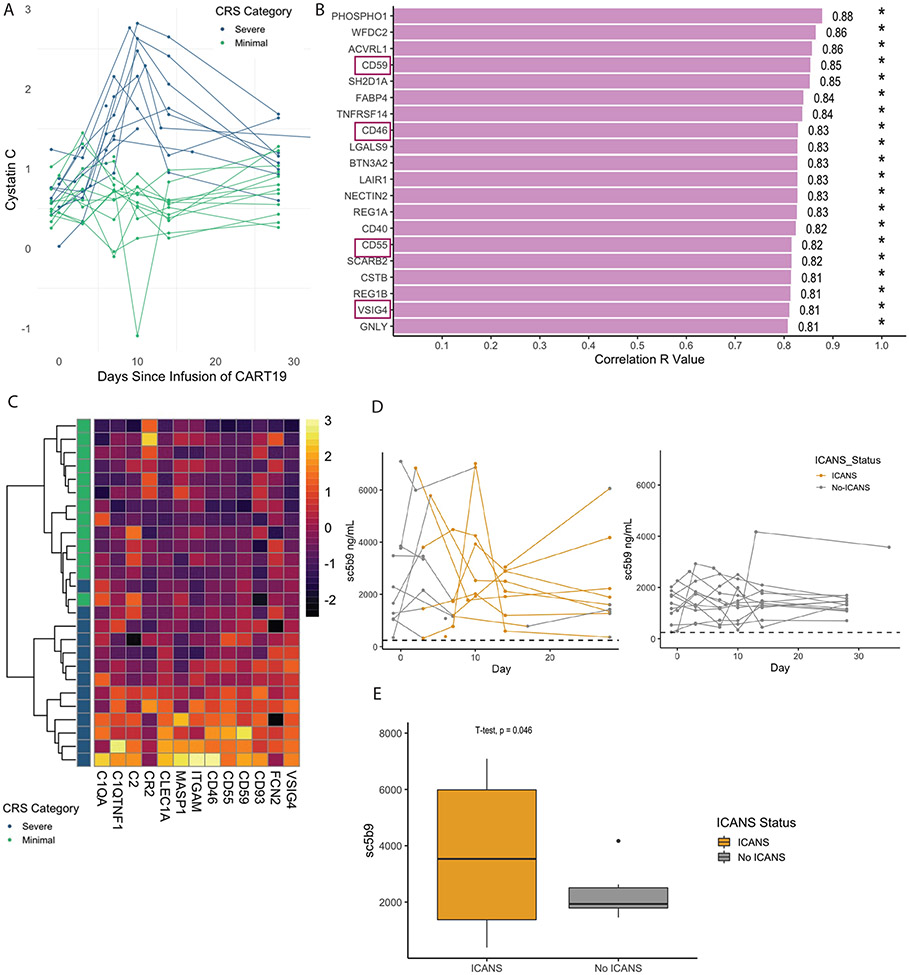
Results: We identified fms-like tyrosine kinase 3 (FLT3) and mast cell immunoglobulin-like receptor 1 (MILR1) as preinfusion predictive biomarkers of severe CRS. We demonstrated that CRS is an IFNγ-driven process with a protein signature overlapping with hemophagocytic lymphohistiocytosis (HLH). We identified IL18 as a potentially targetable cytokine associated with the development of ICANS.
Conclusions: We identified preinfusion biomarkers that can be used to predict severe CRS with a sensitivity, specificity, and accuracy superior to the current gold standard of disease burden. We demonstrated the fundamental role of the IFNγ pathway in driving CRS, suggesting CRS and carHLH are overlapping rather than distinct phenomena, an observation with important treatment implications. We identified IL18 as a possible targetable cytokine in ICANS, providing rationale for IL18 blocking therapies to be translated into clinical trials in ICANS.
©2022 American Association for Cancer Research.
Conflict of interest statement
CONFLICTS OF INTEREST
DTT reports grants and personal fees from BEAM Therapeutics, grants from NeoImmune Tech, and personal fees from Sobi during the conduct of the study. Additionally, DTT has a patent for Biomarkers of Cytokine Release Syndrome pending and a patent for Chimeric Antigen Receptor T cells Targeting CD38 pending. SAG reports grants and personal fees from See ms- disclosure outside the submitted work; in addition, SAG has a patent for CAR toxicity patents managed by CHOP and UPenn issued, licensed, and with royalties paid from Novartis. BLL reports personal fees from Avectas, Akron Bio, Immusoft, In8bio, Immuneel, Ori biotech, Oxford Biomedica, Vycellix and other support from Tmunity Therapeutics and from Capstan Therapeutics outside the submitted work; in addition, BLL has a patent for Methods for treatment of cancer (US 8906682) (US 8916381)( US 9101584) issued, licensed, and with royalties paid from University of Pennsylvania, a patent for Compositions for treatment of cancer (US 8911993) (US 9102761) (US 9102760) issued, licensed, and with royalties paid from University of Pennsylvania, a patent for Method for treating chronic lymphocytic leukemia (CC) (US 9161971) issued, licensed, and with royalties paid from University of Pennsylvania, a patent for Compositions and methods for treatment of cancer (US 9464140 )(US 9518123) (US 9481728)(US 9540445) issued, licensed, and with royalties paid from University of Pennsylvania, a patent for Use of chimeric antigen receptor-modified T cells to treat cancer (US 9328156) (US 9499629) issued, licensed, and with royalties paid from University of Pennsylvania, a patent for Methods for assessing the suitability of transduced T cells for administration (US 9572836) issued, licensed, and with royalties paid from University of Pennsylvania, and a patent for Toxicity management for anti-tumor activity of CARs (10,603,378, 11,273,219) issued, licensed, and with royalties paid from University of Pennsylvania. MPL reports support from Octapharma, Dova, Principia, Shionogi, personal fees from Shionogi, Dova, Principia, Argenx, Rigel, and grants from Sysmex, Rigel, Principia, Argenx, Dova, Octapharma, AstraZeneca outside the submitted work. SC reports personal fees from Simcha Therapeutics, grants outside the submitted work. SLM reports grants and personal fees from Wugen outside the submitted work; in addition, SLM has a patent for PCT/US2017/044425: Combination Therapies of Car and PD-1 Inhibitors pending and licensed to Novartis Pharmaceuticals. SFL reports a patent for Kymriah and related biomarkers licensed to Novartis. JJM reports grants and personal fees from IASO Biotherapeutics, Poseida Therapeutics, Gilead, and Janssen outside the submitted work; in addition, JJM has a patent for WO2016/109410 A2 issued, a patent for WO2019/213282 issued, a patent for WO2018/175733 issued, a patent for WO2018/013918 issued, a patent 201806619 issued, and a patent for WO2017/210617 issued. CHJ reports other support from Tmunity and other support from Capstan Therapeutics during the conduct of the study; personal fees from Poseida, BluesphereBio, Cabaletta, Carisma, Cartography, Cellares, Danaher, Verismo, and Alaunos Therapeutics outside the submitted work. HN reports grants from National Institutes of Health. No other authors have potential conflicts of interest.
Figures
References
-
- Santomasso BD, Nastoupil LJ, Adkins S, Lacchetti C, Schneider BJ, Anadkat M, et al. Management of Immune-Related Adverse Events in Patients Treated With Chimeric Antigen Receptor T-Cell Therapy: ASCO Guideline. Journal of clinical oncology : official journal of the American Society of Clinical Oncology 2021;39(35):3978–92 doi 10.1200/jco.21.01992. - DOI - PubMed
-
- Teachey DT, Lacey SF, Shaw PA, Melenhorst JJ, Maude SL, Frey N, et al. Identification of Predictive Biomarkers for Cytokine Release Syndrome after Chimeric Antigen Receptor T cell Therapy for Acute Lymphoblastic Leukemia. Cancer discovery 2016;6(6):664–79 doi 10.1158/2159-8290.Cd-16-0040. - DOI - PMC - PubMed
-
- Kadauke S, Myers RM, Li Y, Aplenc R, Baniewicz D, Barrett DM, et al. Risk-Adapted Preemptive Tocilizumab to Prevent Severe Cytokine Release Syndrome After CTL019 for Pediatric B-Cell Acute Lymphoblastic Leukemia: A Prospective Clinical Trial. Journal of clinical oncology : official journal of the American Society of Clinical Oncology 2021;39(8):920–30 doi 10.1200/jco.20.02477. - DOI - PMC - PubMed
Publication types
MeSH terms
Substances
Grants and funding
LinkOut - more resources
Full Text Sources
Miscellaneous
