. 2022 Jun 16;13(1):3456.
doi: 10.1038/s41467-022-31054-4.

Ly6D+Siglec-H+ precursors contribute to conventional dendritic cells via a Zbtb46+Ly6D+ intermediary stage

Affiliations

Ly6D+Siglec-H+ precursors contribute to conventional dendritic cells via a Zbtb46+Ly6D+ intermediary stage

Konstantin Lutz et al. Nat Commun. .

Abstract

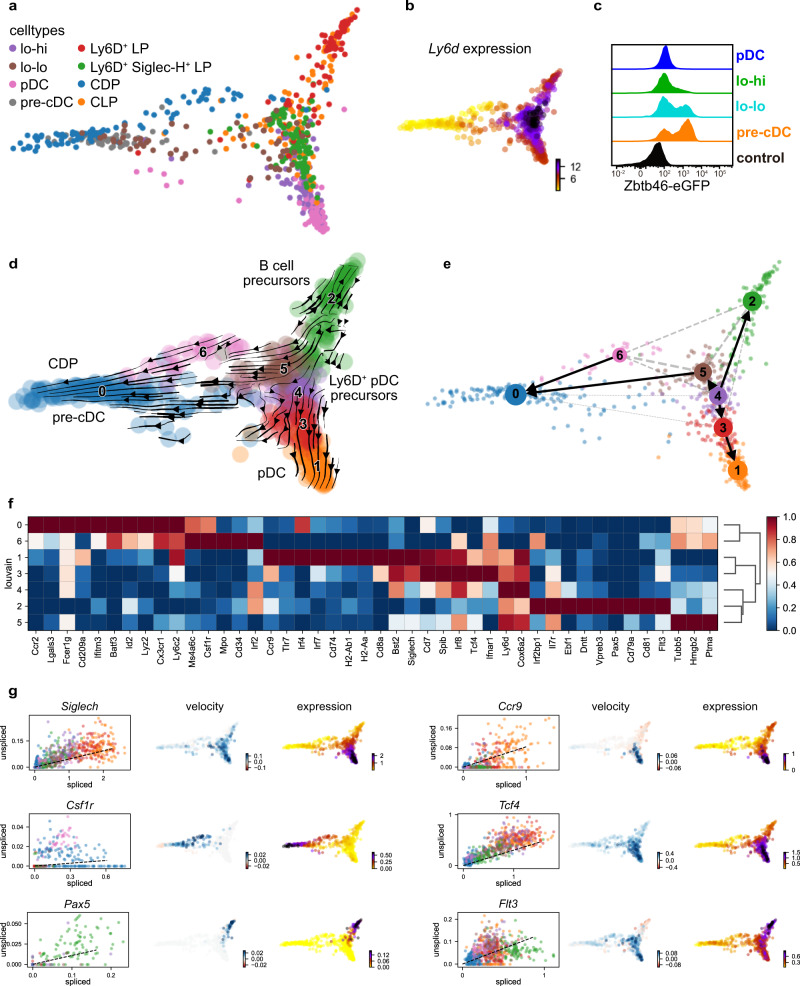
Plasmacytoid and conventional dendritic cells (pDC and cDC) are generated from progenitor cells in the bone marrow and commitment to pDCs or cDC subtypes may occur in earlier and later progenitor stages. Cells within the CD11c+MHCII-/loSiglec-H+CCR9lo DC precursor fraction of the mouse bone marrow generate both pDCs and cDCs. Here we investigate the heterogeneity and commitment of subsets in this compartment by single-cell transcriptomics and high-dimensional flow cytometry combined with cell fate analysis: Within the CD11c+MHCII-/loSiglec-H+CCR9lo DC precursor pool cells expressing high levels of Ly6D and lacking expression of transcription factor Zbtb46 contain CCR9loB220hi immediate pDC precursors and CCR9loB220lo (lo-lo) cells which still generate pDCs and cDCs in vitro and in vivo under steady state conditions. cDC-primed cells within the Ly6DhiZbtb46- lo-lo precursors rapidly upregulate Zbtb46 and pass through a Zbtb46+Ly6D+ intermediate stage before acquiring cDC phenotype after cell division. Type I IFN stimulation limits cDC and promotes pDC output from this precursor fraction by arresting cDC-primed cells in the Zbtb46+Ly6D+ stage preventing their expansion and differentiation into cDCs. Modulation of pDC versus cDC output from precursors by external factors may allow for adaptation of DC subset composition at later differentiation stages.


Conflict of interest statement

F.J.T. reports receiving consulting fees from Roche Diagnostics GmbH, Immunai Inc., Singularity Bio B.V., CytoReason Ltd, and Omniscope Ltd Inc., and has an ownership interest in Cellarity, Inc. and Dermagnostix GmbH. VB is a full-time employee of Cellarity Inc. and reports ownership interest in Cellarity Inc.; the present work was carried out at Helmholtz Munich. The other authors declare no competing interests.

Figures

Fig. 1
Fig. 1. Relationship of Siglec-H+CCR9loB220hi cells and pDCs.
a Gating strategy for Siglec-H pre-cDC, Siglec-H+CCR9loB220lo (lo-lo), CCR9loB220hi (lo-hi) and CCR9hiB220hi pDCs. The indicated populations were sorted from the BM cells of 3 individual C57BL/6 mice and processed for RNA-sequencing. b Principal component analysis performed on normalized counts using all genes. c Expression heatmap of selected TFs, z-score hierarchical clustering by Euclidean distances (normalized counts). d Gene signatures of the sorted populations compared to previously published gene signatures of pre-cDC, cDC, CDP, pDC and pre-pDC. Distance from the middle of the radar plot indicates the percentage of overlap between genes of sorted populations that showed higher expression than the inter-population median and the indicated gene signatures. e Gating strategy for pDC/cDC output after culturing precursor cells. cDCs were identified as Siglec-H MHCIIhi cells and pDCs as Siglec-H+CCR9hiB220hi cells within CD45+CD11c+ cells. f Siglec-H pre-cDC, lo-lo and lo-hi precursors, and pDC were sorted from Lineage-depleted BM cells of WT mice as shown in (a) and cultured for 3 days on EL08-1D2 stromal cells in Flt3L-containing medium. The percentages of cells with a phenotype of pDC (circles) or cDC (triangles) within CD11c+ progeny of the indicated input populations is shown as mean ± SEM (n = 7) and was compared using paired, two-sided t-tests with Holm-Šídák correction for multiple testing. Adjusted p-values: <0.05(*), <0.005(**), <0.0.001(***).
Fig. 2
Fig. 2. RNA velocity analysis links Ly6D+Siglec-H+ precursors and pre-cDCs.
Single-cell RNA sequencing was performed for CD115+ CDP, CLP, Ly6D+ Siglec-H LP, Ly6D+Siglec-H+ LP, Siglec-H pre-cDC, lo-lo, lo-hi precursors and pDCs sorted from Lineage-depleted BM cells. a Diffusion map of 675 DC precursors and related cells with cells highlighted by their identity according to cell sorting. b Ly6d gene expression overlayed onto the diffusion map. c Comparison of Zbtb46-eGFP expression in pre-cDC, lo-lo, lo-hi precursors, and pDCs in BM cells of heterozygous Zbtb46gfp mice measured by flow cytometry. Histograms show the Zbtb46-eGFP fluorescence signal (normalized to mode), WT cells were used as a negative control. Representative results of 3 independent experiments. d RNA velocities projected onto the diffusion map as streamlines with scvelo. Louvain clusters are indicated by colors and numbers. Clusters were annotated according to their gene expression and sorted cell type composition. e Partition-based graph abstraction (PAGA) with velocity directed edges computed with scvelo. Solid black arrows indicate probable velocity-inferred transitions of high confidence. Dotted lines indicate clusters that are connected by transcriptome similarity, but do not have sufficient support by RNA velocity to indicate confident transitions. f Expression heatmap of manually selected marker genes, scaled between 0 and 1 in Louvain clusters 0 to 6. g From left to right: Spliced/unspliced phase portraits, RNA velocity, and expression level of the indicated genes overlaid onto the diffusion map.
Fig. 3
Fig. 3. CD11c+Siglec-H+Zbtb46+Ly6D+ BM cells have an intermediary phenotype connecting pDC precursors with pre-cDCs.
a Siglec-H pre-cDC, Siglec-H+ pre-cDC, Siglec-H+Zbtb46+Ly6D+ cells and lo-lo, lo-hi, and pDC (gated Siglec-H+Zbtb46Ly6D+) within LinFlt3+CD11c+ cells were identified in Lineage-depleted BM cells of heterozygous Zbtb46gfp mice. af Lineage-depleted BM and spleen cells of heterozygous Zbtb46gfp mice were analyzed by multidimensional spectral flow cytometry (25 parameters). b The data of BM and spleen cells (1.5 × 106 cells each) were concatenated and subjected to UMAP analysis. The subset containing DC and precursor populations was gated from a parent UMAP that was generated after exclusion of T cells, B cells, NK cells, macrophages, and myeloid progenitors. UMAP was rerun on the extracted data. c Distribution of BM and spleen cells in the UMAP of (b). d Manually gated BM and spleen DC subsets, precursors and Zbtb46+ Ly6D+ cells indicated by colors and numbers were projected onto the UMAP shown in (b). e Histograms showing cell surface marker expression for all populations of interest in BM (top) and spleen (bottom), normalized to mode. f Log2 normalized surface marker expression projected onto the UMAP using a color scale from blue (low expression) to red (high expression). Representative results of one of three independent experiments are shown.
Fig. 4
Fig. 4. CD11c+Siglec-H+Ly6DhiZbtb46CCR9loB220lo precursors contribute to cDCs via a Zbtb46+Ly6D+ intermediary stage.
a Siglec-H pre-cDC, Siglec-H+ pre-cDC, Siglec-H+Zbtb46+Ly6D+ cells as well as lo-lo, lo-hi precursors and pDCs (gated Siglec-H+Ly6DhiZbtb46 as shown in Fig. 3a) were sorted from Lineage-depleted BM cells of heterozygous Zbtb46gfp mice and cultured for 3 days with Flt3L on EL08-1D2 stromal cells. The phenotype of the progeny was analyzed by flow cytometry. Percentages of pDCs (circles) or cDCs (triangles) within CD11c+ progeny are shown (mean ± SEM, n = 5); pDC vs cDC output was compared using paired, two-sided t-tests with Holm-Šídák correction for multiple testing. Adjusted p-values: <0.05(*), <0.005(**), <0.0.001(***). b Phenotype of cells derived from the indicated populations after 3 days of culture (representative results, n = 5). A potential transition from Ly6D+Zbtb46 to Zbtb46+Ly6D is indicated by the dotted arrows. c The indicated populations were sorted and cultured for 3 days with Flt3L without stromal cells, then analyzed by flow cytometry. UMAP analysis of concatenated CD11c+ cells from all samples. cDCs generated from each precursor subset were gated as CD11c+Zbtb46highMHCIIhigh and projected onto the UMAP, together with pDCs generated from lo-hi precursors for comparison. d Heatmap of hierarchically clustered log2 normalized relative gene expression (scaled per gene) in the progeny of the indicated DC precursors before or after 1, 2 and 3 days of culture with Flt3L measured by qRT-PCR (grey: not detectable). Gene expression in freshly isolated BM and spleen pDC and cDC served as a reference (mean values of 2 independent experiments are shown). e CellTrace Blue proliferation dye signal in the CD11c+ fraction of the indicated input cells after 3d of culture (representative results, n = 5). f Expression of the indicated markers in the undivided fraction of CD11c+ cells generated from lo-lo precursors after 3 days. g Zbtb46 and Ly6D expression in lo-lo precursor cells directly after sorting and after 20 h of culture with Flt3L. The precentage of Zbtb46+Ly6D+ cells is shown in the gates. h Percentage of Zbtb46+Ly6D+ cells within CD11c+ cells derived from lo-lo precursors after 20 h of culture (mean ± SEM, n = 3).
Fig. 5
Fig. 5. Cell fate of Siglec-H+Ly6DhiZbtb46CCR9loB220lo and CCR9loB220hi precursors after transfer in vivo.
a Siglec-H+Ly6DhiZbtb46 lo-lo and lo-hi cells were sorted from BM of heterozygous Zbtb46gfp mice and transferred i.v. into congenic CD45.1 mice. After 5 days splenocytes were analyzed by multiparameter spectral flow cytometry. b Phenotype of recovered donor derived cells on day 5 after injection depicted as percentage of total CD45.2+ recovered cells (n = 3, mean ± SEM). c From each recipient of lo-lo precursors 400,000 Lin CD11c+ recipient cells and all donor-derived cells were concatenated and UMAP dimensionality reduction was performed. DC subsets were manually gated for both recipient and donor-derived cells and projected onto the UMAP. Donor-derived cells are highlighted as large dots. d Log2 normalized surface marker and Zbtb46 expression in donor-derived cells overlaid onto the UMAP of (c) using a color scale from blue (low expression) to red (high expression). e Histograms showing fluorescence intensity of CellTrace Blue dye (normalized to mode) in cells derived from transferred lo-lo precursors after 5 days. f Siglec-H+Zbtb46+Ly6D+ cells were sorted from BM of heterozygous Zbtb46gfp mice and transferred i.v. into congenic CD45.1 mice. After 3 days splenocytes were analyzed by multiparameter spectral flow cytometry. g Phenotype of recovered donor derived cells on day 3 after injection depicted as percentage of total recovered cells (n = 3, mean ± SEM). b, g Output phenotypes were compared using a two-way ANOVA with Šídák’s correction for multiple testing. Adjusted p-values: <0.05(*), <0.005(**).
Fig. 6
Fig. 6. Modulation of pDC versus cDC output from CD11c+Siglec-H+Ly6D+Zbtb46CCR9loB220lo precursors by type I IFN in vitro.
Siglec-H pre-cDC, Siglec-H+ pre-cDC, Siglec-H+Zbtb46+Ly6D+ cells and lo-lo, lo-hi and pDC (gated Siglec-H+Ly6D+Zbtb46) were sorted from Lineage-depleted BM cells of heterozygous Zbtb46gfp mice and cultured for 3 days with Flt3L only or Flt3L and 100 U/ml IFN-α on EL08-1D2 stromal cells. Percentages of pDCs a, cDCs (b), and Zbtb46+Ly6D+ cells (c) within CD11c+ progeny after 3 days are shown for each input population as mean ± SEM (n = 3). d Zbtb46 vs. Ly6D expression in CD11c+ cells derived from lo-lo precursors with Flt3L alone (left) and Flt3L/IFN-α (right); representative results of three experiments. e Expression of Zbtb46 and several surface markers vs. CTB signal. Representative example of CD11c+ cells generated from lo-lo precursors after 3 days of culture with Flt3L alone (left) and Flt3L/IFN-α (right, n = 3). f Representative example of B220 vs. CCR9 expression and pDC gating of CD11c+Siglec-H+Ly6D+ cells derived from lo-hi precursors after 3d of culture (n = 5). g Percentage of differentiated pDCs within CD11c+Siglec-H+Ly6D+Zbtb46 cells derived from lo-lo and lo-hi precursors after 3d of culture with and without IFN-α addition (mean ± SEM, n = 5). Conditions with and without IFN-α were compared for each input population using paired, two-sided t-tests with Holm–Šídák correction for multiple testing. Adjusted p-values: <0.05(*).

References

    1. Vu Manh TP, Bertho N, Hosmalin A, Schwartz-Cornil I, Dalod M. Investigating evolutionary conservation of dendritic cell subset identity and functions. Front. Immunol. 2015;6:260. - PMC - PubMed
    1. Murphy KM. Transcriptional control of dendritic cell development. Adv. Immunol. 2013;120:239–267. doi: 10.1016/B978-0-12-417028-5.00009-0. - DOI - PubMed
    1. Eisenbarth SC. Dendritic cell subsets in T cell programming: location dictates function. Nat. Rev. Immunol. 2019;19:89–103. doi: 10.1038/s41577-018-0088-1. - DOI - PMC - PubMed
    1. Papaioannou NE, et al. Environmental signals rather than layered ontogeny imprint the function of type 2 conventional dendritic cells in young and adult mice. Nat. Commun. 2021;12:464. doi: 10.1038/s41467-020-20659-2. - DOI - PMC - PubMed
    1. Durai V, Murphy KM. Functions of murine dendritic cells. Immunity. 2016;45:719–736. doi: 10.1016/j.immuni.2016.10.010. - DOI - PMC - PubMed

Publication types

MeSH terms