. 2022 Jun 15;13(1):3346.
doi: 10.1038/s41467-022-30926-z.

Remote solid cancers rewire hepatic nitrogen metabolism via host nicotinamide-N-methyltransferase

Affiliations

Remote solid cancers rewire hepatic nitrogen metabolism via host nicotinamide-N-methyltransferase

Rin Mizuno et al. Nat Commun. .

Abstract

Cancers disrupt host homeostasis in various manners but the identity of host factors underlying such disruption remains largely unknown. Here we show that nicotinamide-N-methyltransferase (NNMT) is a host factor that mediates metabolic dysfunction in the livers of cancer-bearing mice. Multiple solid cancers distantly increase expression of Nnmt and its product 1-methylnicotinamide (MNAM) in the liver. Multi-omics analyses reveal suppression of the urea cycle accompanied by accumulation of amino acids, and enhancement of uracil biogenesis in the livers of cancer-bearing mice. Importantly, genetic deletion of Nnmt leads to alleviation of these metabolic abnormalities, and buffers cancer-dependent weight loss and reduction of the voluntary wheel-running activity. Our data also demonstrate that MNAM is capable of affecting urea cycle metabolites in the liver. These results suggest that cancers up-regulate the hepatic NNMT pathway to rewire liver metabolism towards uracil biogenesis rather than nitrogen disposal via the urea cycle, thereby disrupting host homeostasis.


Conflict of interest statement

The authors declare no competing interests.

Figures
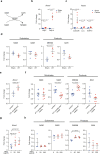
Fig. 1
Fig. 1. Solid cancers upregulate Nnmt expression in the liver.
a The biochemical property of NNMT. b qPCR analysis for Nnmt in the livers of 4T1-bearing mice on 7 and 14 days after transplantation. n = 6 for D7, n = 4 for D14. c qPCR analysis for Nnmt in the livers of the colon (Colon26), lung (LLC), and ovarian (ID8-F3) cancer-bearing mice. The livers were collected 14 days after transplantation in the colon26 and LLC models, and 42 days after transplantation in the ID8-F3 model. n = 4 for sham-operated mice, LLC-bearing mice, and ID8-bearing mice. n = 5 for Colon26-bearing mice. d Liquid chromatography with tandem mass spectrometry (LC-MS/MS) analysis for nicotinamide (NAM), S-adenosyl-methionine (SAM), 1-methylnicotinamide (MNAM), and S-adenosyl-homocysteine (SAH) in the livers of sham-operated and 4T1-bearing mice. n = 4. e qPCR analysis for Nnmt in a primary hepatocyte culture cell line AML12 treated with the 4T1-conditioned medium determined by qPCR. n = 3. f LC-MS/MS analysis for the NNMT-related metabolites in AML12 treated with the 4T1-conditioned medium. n = 8. g qPCR analysis to reveal the effect of TNFα on Nnmt expression in AML12. n = 4. h LC-MS/MS analysis for the NNMT-related metabolites in AML12 treated with TNFα. n = 3. The exact p values are shown (unpaired two-tailed Student’s t-test in bd and paired two-tailed Student’s t-test in eh). Averaged fold change data normalized to the control groups are presented as the mean ± SEM.Source data are provided as a source data file.
Fig. 2
Fig. 2. Nnmt KO abolishes MNAM and accumulates SAM in a cancer-bearing condition.
a The Nnmt KO (Δ25 allele) was generated by the CRISPR-Cas9 technique in this study. b The representative picture for genotyping BALB/c Nnmt KO mice. c LC-MS/MS analysis for the NNMT-related metabolites in the livers of WT and Nnmt KO mice. n = 4. d LC-MS/MS analysis for the NNMT-related metabolites in the livers of Nnmt KO mice in the 4T1 transplantation experiments. n = 4. e The SAM/SAH ratio of sham-operated and 4T1-bearing WT and Nnmt KO mice. n = 4. ce The exact p values are shown (unpaired two-tailed Student’s t-test). Averaged fold change data are presented as the mean ± SEM. Source data are provided as a source data file.
Fig. 3
Fig. 3. Nnmt deletion buffers transcriptome changes caused by 4T1.
a RNA-seq experiments for the livers of sham-operated mice and 4T1-bearing mice in WT and Nnmt KO (14 days after 4T1 transplantation). Volcano plots (log2 fold average (4T1/sham) versus –log10 (q value)) of WT (left) and Nnmt KO (right) are shown. Genes showing more than 1.5-fold change with q < 0.05 are highlighted in red. n = 4. b Gene ontology analysis (g:Profier) for genes significantly elevated in the livers of 4T1-bearing mice. Adjusted enrichment p values obtained from g:Profier are shown. c RNA-seq results of representative upregulated genes S100a8 and Stat3. Averaged fold change data normalized to the sham group in each genotype are presented as the mean ± SEM. #; more than 1.5-fold change with q < 0.05. n = 4. d Gene ontology analysis (g:Profier) for genes decreased in the livers of 4T1-bearing mice. Adjusted enrichment p values obtained from g:Profier are shown. e Gene Ontology analysis for genes whose downregulation was rescued by Nnmt KO in the 4T1-bearing condition. Adjusted enrichment p values obtained from g: Profier are shown. Source data are provided as a source data file.
Fig. 4
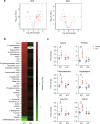
Fig. 4. Nnmt deletion buffers metabolic changes caused by 4T1.
a Metabolome experiments for the livers of sham-operated mice and 4T1-bearing mice in WT and Nnmt KO (14 days after 4T1 transplantation). Volcano plots (log2 fold average (4T1/sham) versus –log10 (q value)) of WT (left) and Nnmt KO (right) are shown. Metabolites showing more than 1.5-fold change with q < 0.05 are highlighted in red. n = 5. b Heatmap representation of metabolites that are significantly affected in WT (left column) but not in Nnmt KO (right column). n = 5. c Representative plots of “rescued” metabolites are shown in b. Data from six representative amino acids are shown. Averaged fold change data normalized to the sham group in each genotype are presented as the mean ± SEM. #; more than 1.5-fold change with q < 0.05. n = 5. Source data are provided as a source data file.
Fig. 5
Fig. 5. NNMT is required for dysregulation of the urea cycle and uracil biogenesis.
a The urea cycle. The part where the urea cycle is linked to uracil biogenesis is also shown. Nitrogen sources (aspartate and glutamine) are highlighted in orange. See also Supplementary Fig. 6a for more details. b LC-MS/MS analyses for the urea cycle metabolites and its derivative in the livers. n = 5. c RNA-seq measurements for genes encoding urea cycle enzymes in the livers. n = 4. d The plasma urea level was measured 14 days after 4T1 transplantation. The exact p value is shown (unpaired two-tailed Student’s t-test). Averaged fold change data normalized to the sham group in each genotype are presented as the mean ± SEM. n = 7 for WT, n = 5 for sham-operated Nnmt KO mice, n = 6 for 4T1-bearing Nnmt KO mice. e LC-MS/MS analysis for uracil in the livers. n = 5. f RNA-seq measurements for Cad and Upp1. n = 4. g LC-MS/MS analysis for MNAM in the livers from mice subjected to daily 250 mg/kg MNAM injection for 12 days in the absence (sham) and presence (4T1) of 4T1 cancers. n = 5 for 4T1-bearing MNAM treated mice. n = 4 for the other three experimental groups. h LC-MS/MS analyses for arginine, arginosuccinate, and uracil in the livers. n = 5 for 4T1-bearing MNAM treated mice. n = 4 for the other three experimental groups. i Body weight changes measured on D14 after 4T1 transplantation in WT and Nnmt KO. The weights are calculated as total body weight − cancer mass. n = 17 for WT, n = 25 for Nnmt KO. Data were represented as the mean ± SEM. The exact p value is shown (unpaired two-tailed Student’s t-test). j The voluntary wheel-running activity was measured 1–14 days after 4T1 transplantation in WT and Nnmt KO. The number of rotations on each day is shown as % to that on Day1 in each genotype. n = 3. Data were presented as the mean ± SEM. *p < 0.05, unpaired two-tailed Student’s t-test. The exact p values are 4.5 × 10−3 (Day 7), 3.9 × 10−2 (Day 9), 2.4 × 10−2 (Day 11), and 9.0 × 10−3 (Day 14). b, c, e, f Averaged fold change data normalized to the sham group in each genotype are presented as the mean ± SEM. #; >1.5-fold change with q < 0.05. g, h. Averaged fold change data normalized to the sham-operated control mice are presented as the mean ± SEM. The exact p values are shown (unpaired two-tailed Student’s t-test). Source data are provided as a source data file.
Fig. 6
Fig. 6. Graphical summary.
Solid cancers increase NNMT and MNAM in the liver, consequently causing dysregulation of the urea cycle and uracil biogenesis. On the other hand, NNMT is not required for abnormalities in glucose metabolism and enhancement of inflammation.

References

    1. Petruzzelli M, Wagner EF. Mechanisms of metabolic dysfunction in cancer-associated cachexia. Genes Dev. 2016;30:489–501. doi: 10.1101/gad.276733.115. - DOI - PMC - PubMed
    1. Biswas AK, Acharyya S. Understanding cachexia in the context of metastatic progression. Nat. Rev. Cancer. 2020;20:274–284. doi: 10.1038/s41568-020-0251-4. - DOI - PubMed
    1. Das SK, et al. Adipose triglyceride lipase contributes to cancer-associated cachexia. Science. 2011;333:233–238. doi: 10.1126/science.1198973. - DOI - PubMed
    1. Masri S, et al. Lung Adenocarcinoma Distally Rewires Hepatic Circadian Homeostasis. Cell. 2016;165:896–909. doi: 10.1016/j.cell.2016.04.039. - DOI - PMC - PubMed
    1. Flint TR, et al. Tumor-Induced IL-6 Reprograms Host Metabolism to Suppress Anti-tumor Immunity. Cell Metab. 2016;24:672–684. doi: 10.1016/j.cmet.2016.10.010. - DOI - PMC - PubMed

Publication types