. 2022 Jun 15;12(1):9980.
doi: 10.1038/s41598-022-13677-1.

A new method to quantify left ventricular mass by 2D echocardiography

Affiliations

A new method to quantify left ventricular mass by 2D echocardiography

Charlotte Burup Kristensen et al. Sci Rep. .

Abstract

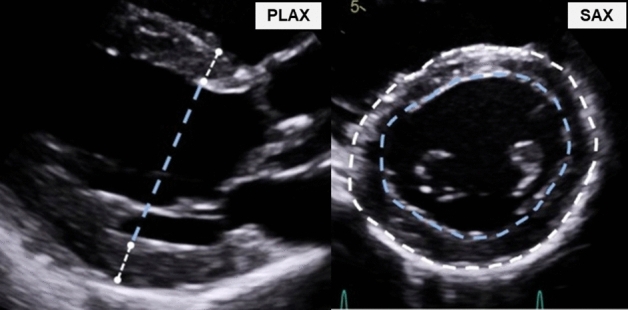
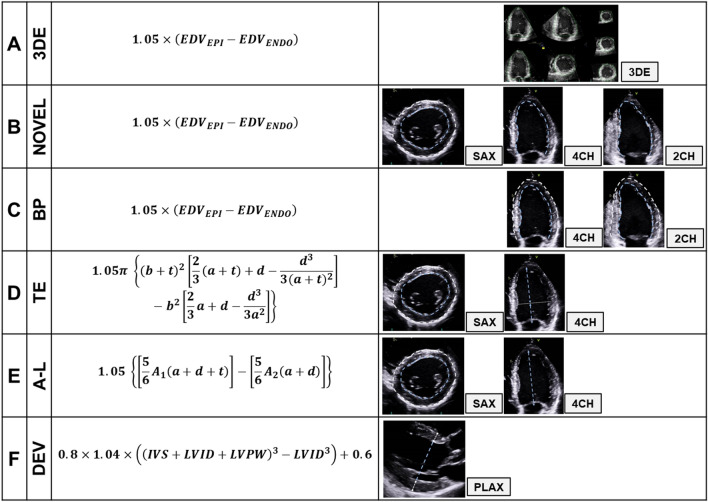
Increased left ventricular mass (LVM) is a strong independent predictor for adverse cardiovascular events, but conventional echocardiographic methods are limited by poor reproducibility and accuracy. We developed a novel method based on adding the mean wall thickness from the parasternal short axis view, to the left ventricular end-diastolic volume acquired using the biplane model of discs. The participants (n = 85) had various left ventricular geometries and were assessed using echocardiography followed immediately by cardiac magnetic resonance, as reference. We compared our novel two-dimensional (2D) method to various conventional one-dimensional (1D) and other 2D methods as well as the three-dimensional (3D) method. Our novel method had better reproducibility in intra-examiner [coefficients of variation (CV) 9% vs. 11-14%] and inter-examiner analysis (CV 9% vs. 10-20%). Accuracy was similar to the 3D method (mean difference ± 95% limits of agreement, CV): Novel: 2 ± 50 g, 15% vs. 3D: 2 ± 51 g, 16%; and better than the "linear" 1D method by Devereux (7 ± 76 g, 23%). Our novel method is simple, has considerable better reproducibility and accuracy than conventional "linear" 1D methods, and similar accuracy as the 3D-method. As the biplane model forms part of the standard echocardiographic protocol, it does not require specific training and provides a supplement to the modern echocardiographic report.


Conflict of interest statement

The authors declare no competing interests.

Figures

Figure 1
Figure 1
Wall thickness measurements at the chordae level. PLAX parasternal long-axis, SAX parasternal short-axis.
Figure 2
Figure 2
The novel method. Step 1 Mean wall thickness (t) is calculated by delineation of the endocardial and epicardial border in the parasternal short axis view at the chordae level. Step 2 Conventional delineation in the apical four- and two-chamber view and for end-diastolic volume according to the biplane model of discs. Step 3 The total volume defined by the epicardium is quantified by adding t to each unique disc from the delineations in step 2. An apical cap with the geometrical assumption of a prolate ellipsoid is added. Step 4 Left ventricular myocardial volume is quantified by subtracting the traced volume defined by the endocardium (from step 2) from the quantified volume defined by the epicardium (from step 3). Left ventricular mass is quantified my multiplying the left ventricular volume with the myocardial density/gravity of 1.05 g/ml. t mean wall thickness, A1 outer (epicardial) delineation, A2 inner (endocardial) delineation, SAX short-axis view, EDV end-diastolic volume, 4CH four-chamber view, 2CH two-chamber view.
Figure 3
Figure 3
(A–F) Various methods for quantification of left ventricular mass. 3DE three-dimensional echocardiography, EDVEPI end-diastolic volume defined by the epicadium, EDVENDO end-diastolic volume defined by the endocardium, NOVEL novel method, t mean wall thickness, SAX short-axis, 4CH four-chamber, 2CH two-chamber, BP biplane model (both endo- and epicardial delineation), TE truncated ellipsoid, a length, apex to short-axis-plane, d length, short-axis-plane to mitral-plane, A-L area-length, A2 inner (endocardial) area (blue dotted lines) short-axis, A1 outer (epicardial) area (white dotted lines) short-axis, DEV cube formula, Devereux correction, IVS interventricular septum, LVID left ventricular internal diameter, LVPW left ventricular posterior wall. b=A2π t=A1π-A2π.
Figure 4
Figure 4
Agreement of left ventricular mass by echocardiography and cardiac magnetic resonance at baseline. Left Bland–Altman plots. Horizontal solid line = bias (mean difference). Horizontal dashed line = 95% limits of agreement. Solid/dashed diagonal lines = regression lines with 95% confidence interval. Right Linear regression, pearson’s correlation. (A) 3DE (B) Novel (C) Biplane model (D) Truncated ellipsoid (E) Area-length (F) Cube formula, Devereux correction. LVM left ventricular mass, CMR cardiac magnetic resonance.
Figure 5
Figure 5
Agreement of left ventricular mass by echocardiography and cardiac magnetic resonance at baseline divided by geometry. Mean differences (g) between echocardiography and cardiac magnetic resonance; positive value indicates overestimation by echocardiography. Longitudinal grey solid line is standard deviation. *p < 0.0, p < 0.01 p < 0.001. Definition of left ventricular geometry by cardiac magnetic resonance; normal, dilatation, hypertrophy, dilatation and hypertrophy. Dilatation defined as the following indexed end-diastolic volume values: Men < 60 years ≥ 101 ml/m2, Men ≥ 60 years ≥ 95 ml/m2, Women < 60 years ≥ 96 ml/m2, Women ≥ 60 years 87 ml/m2. Hypertrophy defined as the following indexed left ventricular mass values: Men < 60 years ≥ 92 g/m2, Men ≥ 60 years ≥ 91 g/m2, Women < 60 years ≥ 78 g/m2, Women ≥ 60 years 79 g/m2. 3DE three-dimensional echocardiography, BP biplane model (both endo- and epicardial delineation), TE Truncated Ellipsoid, A-L Area-Length, DEV cube formula, Devereux correction.
Figure 6
Figure 6
Examples of miscalculation by linear measurements. (A) Hypertrophic cardiomyopathy, asymmetry. (B) Normal geometry, short LV length. (C) Aortic regurgitation, dilatation and hypertrophy. LV left ventricle, CMR cardiac magnetic resonance, 3DE three-dimensional echocardiography, DEV cube, Devereux correction, PLAX parasternal long-axis, 1D one-dimensional, t1D mean wall thickness PLAX, LVID left ventricular internal diameter, SAX short-axis, 2D two-dimensional, t2D mean wall thickness SAX, 4CH four-chamber view, 2CH two-chamber view.

References

    1. Levy D, Garrison RJ, Savage DD, Kannel WB, Castelli WP. Prognostic implications of echocardiographically determined left ventricular mass in the Framingham heart study. N. Engl. J. Med. 1990;322:1561–1566. doi: 10.1056/NEJM199005313222203. - DOI - PubMed
    1. Casale PN, et al. Value of echocardiographic measurement of left ventricular mass in predicting cardiovascular morbid events in hypertensive men. Ann. Intern. Med. 1986;105:173–178. doi: 10.7326/0003-4819-105-2-173. - DOI - PubMed
    1. Barbieri A, et al. Prognostic impact of left ventricular mass severity according to the classification proposed by the American Society of Echocardiography/European Association of Echocardiography. J. Am. Soc. Echocardiogr. 2011;24:1383–1391. doi: 10.1016/j.echo.2011.08.012. - DOI - PubMed
    1. Vakili BA, Okin PM, Devereux RB. Prognostic implications of left ventricular hypertrophy. Am. Heart J. 2001;141:334–341. doi: 10.1067/mhj.2001.113218. - DOI - PubMed
    1. Koren MJ, Ulin RJ, Koren AT, Laragh JH, Devereux RB. Left ventricular mass change during treatment and outcome in patients with essential hypertension. Am. J. Hypertens. 2002;15:1021–1028. doi: 10.1016/S0895-7061(02)03061-3. - DOI - PubMed

Publication types

MeSH terms