

A machine learning based model accurately predicts cellular response to electric fields in multiple cell types
- PMID: 35705588
- PMCID: PMC9200721
- DOI: 10.1038/s41598-022-13925-4
A machine learning based model accurately predicts cellular response to electric fields in multiple cell types
Abstract
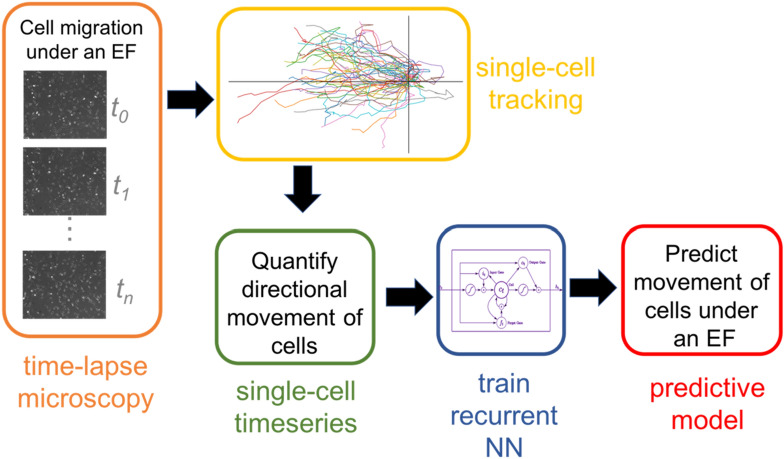
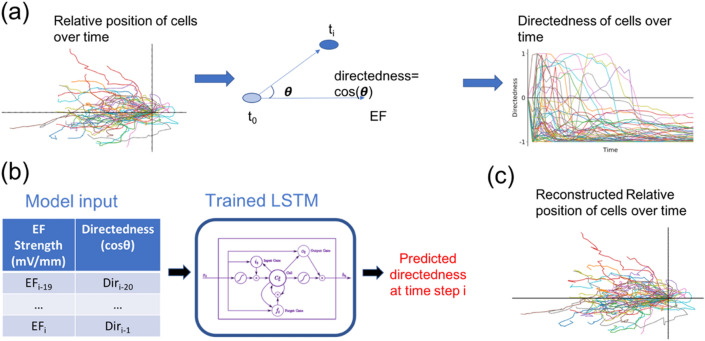
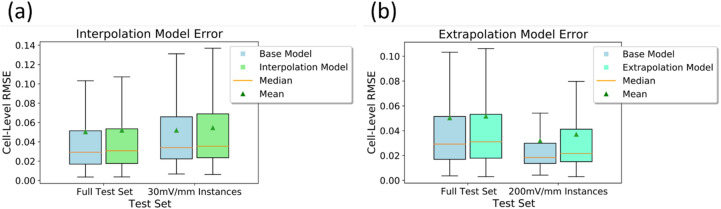
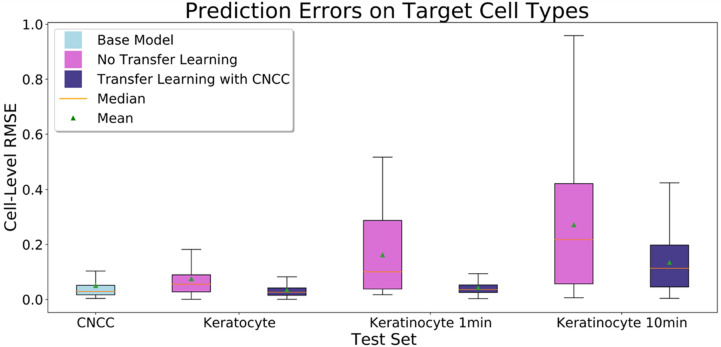
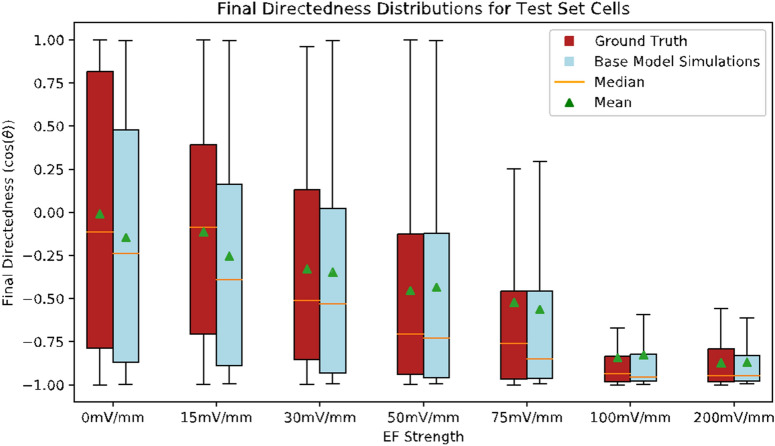
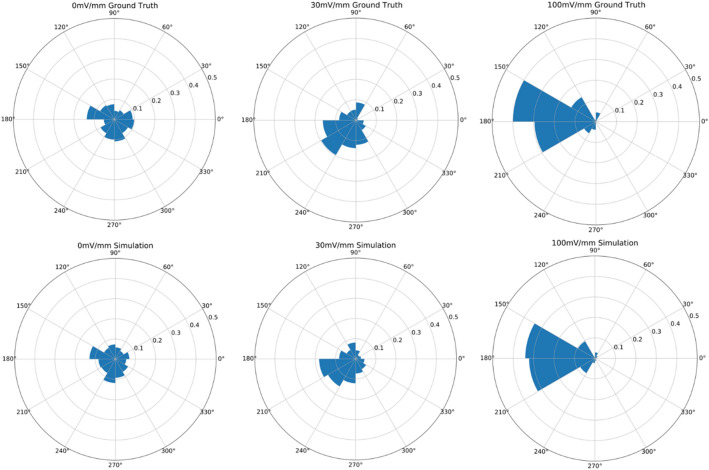
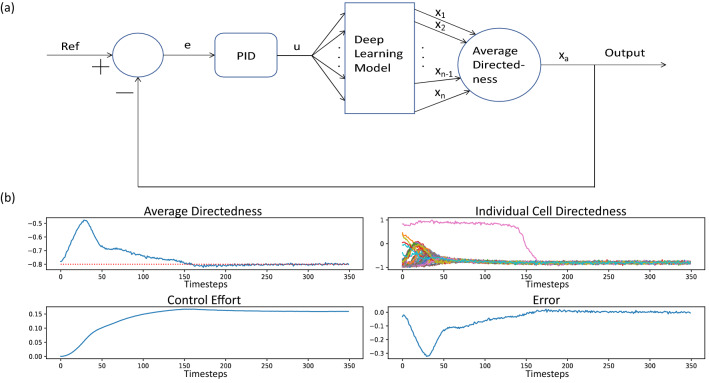
Many cell types migrate in response to naturally generated electric fields. Furthermore, it has been suggested that the external application of an electric field may be used to intervene in and optimize natural processes such as wound healing. Precise cell guidance suitable for such optimization may rely on predictive models of cell migration, which do not generalize. Here, we present a machine learning model that can forecast directedness of cell migration given a timeseries of previous directedness and electric field values. This model is trained using time series galvanotaxis data of mammalian cranial neural crest cells obtained through time-lapse microscopy of cells cultured at 37 °C in a galvanotaxis chamber at ambient pressure. Next, we show that our modeling approach can be used for a variety of cell types and experimental conditions with very limited training data using transfer learning methods. We adapt the model to predict cell behavior for keratocytes (room temperature, ~ 18-20 °C) and keratinocytes (37 °C) under similar experimental conditions with a small dataset (~ 2-5 cells). Finally, this model can be used to perform in silico studies by simulating cell migration lines under time-varying and unseen electric fields. We demonstrate this by simulating feedback control on cell migration using a proportional-integral-derivative (PID) controller. This data-driven approach provides predictive models of cell migration that may be suitable for designing electric field based cellular control mechanisms for applications in precision medicine such as wound healing.
© 2022. The Author(s).
Conflict of interest statement
The authors declare no competing interests.
Figures


Similar articles
-
Short-Term Memory Impairment.2024 Jun 8. In: StatPearls [Internet]. Treasure Island (FL): StatPearls Publishing; 2025 Jan–. 2024 Jun 8. In: StatPearls [Internet]. Treasure Island (FL): StatPearls Publishing; 2025 Jan–. PMID: 31424720 Free Books & Documents.
-
Cost-effectiveness of using prognostic information to select women with breast cancer for adjuvant systemic therapy.Health Technol Assess. 2006 Sep;10(34):iii-iv, ix-xi, 1-204. doi: 10.3310/hta10340. Health Technol Assess. 2006. PMID: 16959170
-
Systemic Inflammatory Response Syndrome.2025 Jun 20. In: StatPearls [Internet]. Treasure Island (FL): StatPearls Publishing; 2025 Jan–. 2025 Jun 20. In: StatPearls [Internet]. Treasure Island (FL): StatPearls Publishing; 2025 Jan–. PMID: 31613449 Free Books & Documents.
-
Comparison of Two Modern Survival Prediction Tools, SORG-MLA and METSSS, in Patients With Symptomatic Long-bone Metastases Who Underwent Local Treatment With Surgery Followed by Radiotherapy and With Radiotherapy Alone.Clin Orthop Relat Res. 2024 Dec 1;482(12):2193-2208. doi: 10.1097/CORR.0000000000003185. Epub 2024 Jul 23. Clin Orthop Relat Res. 2024. PMID: 39051924
-
Management of urinary stones by experts in stone disease (ESD 2025).Arch Ital Urol Androl. 2025 Jun 30;97(2):14085. doi: 10.4081/aiua.2025.14085. Epub 2025 Jun 30. Arch Ital Urol Androl. 2025. PMID: 40583613 Review.
Cited by
-
Controlling Cell Migratory Patterns Under an Electric Field Regulated by a Neural Network-Based Feedback Controller.Bioengineering (Basel). 2025 Jun 20;12(7):678. doi: 10.3390/bioengineering12070678. Bioengineering (Basel). 2025. PMID: 40722370 Free PMC article.
-
Electrowriting patterns and electric field harness directional cell migration for skin wound healing.Mater Today Bio. 2024 May 6;26:101083. doi: 10.1016/j.mtbio.2024.101083. eCollection 2024 Jun. Mater Today Bio. 2024. PMID: 38757058 Free PMC article.
-
3D Printing-Based Hydrogel Dressings for Wound Healing.Adv Sci (Weinh). 2024 Dec;11(47):e2404580. doi: 10.1002/advs.202404580. Epub 2024 Nov 18. Adv Sci (Weinh). 2024. PMID: 39552255 Free PMC article. Review.
