. 2022 Jun 15;12(1):9371.
doi: 10.1038/s41598-022-13568-5.

Exceptional warming over the Barents area

Affiliations

Exceptional warming over the Barents area

Ketil Isaksen et al. Sci Rep. .

Abstract

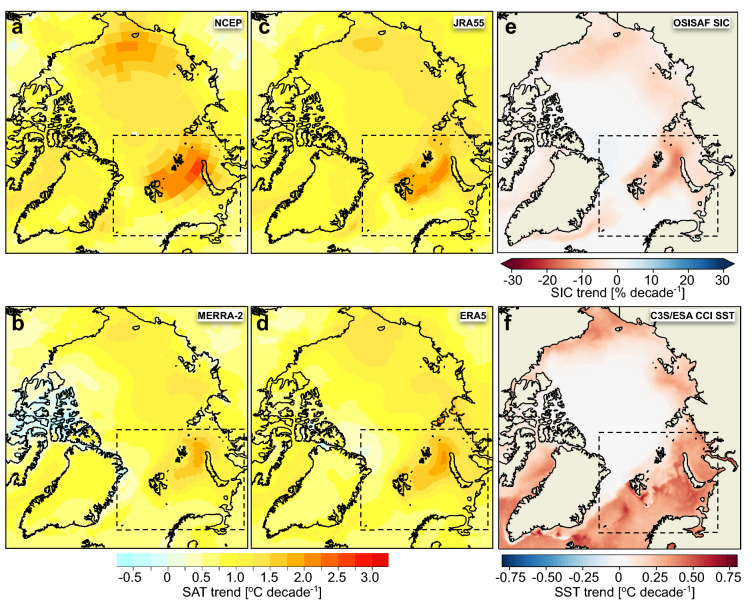
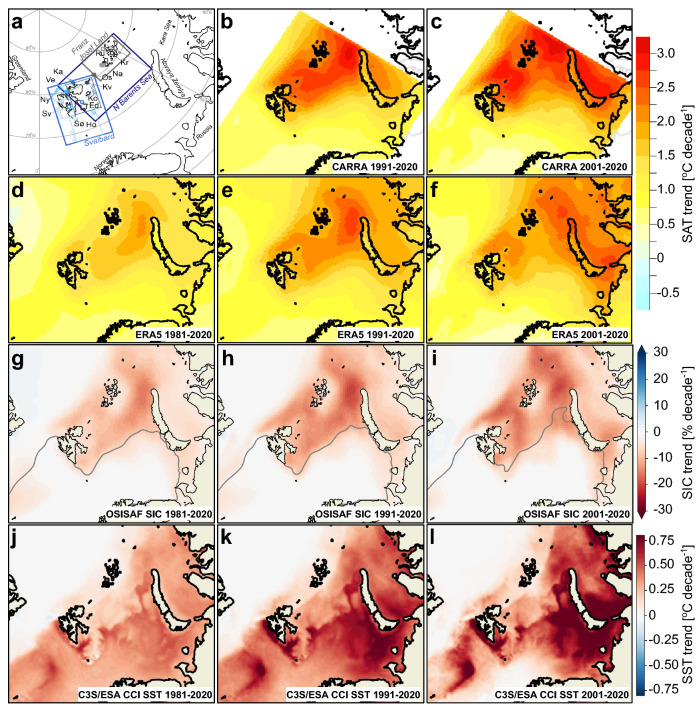
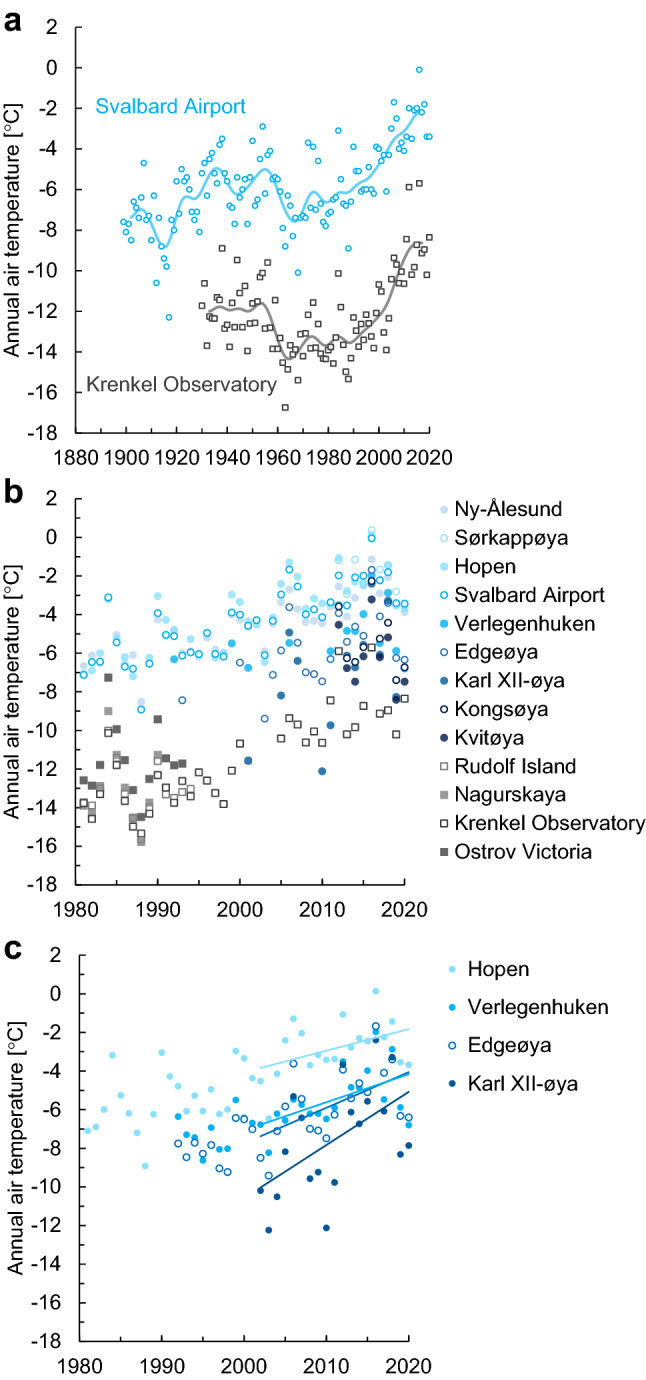
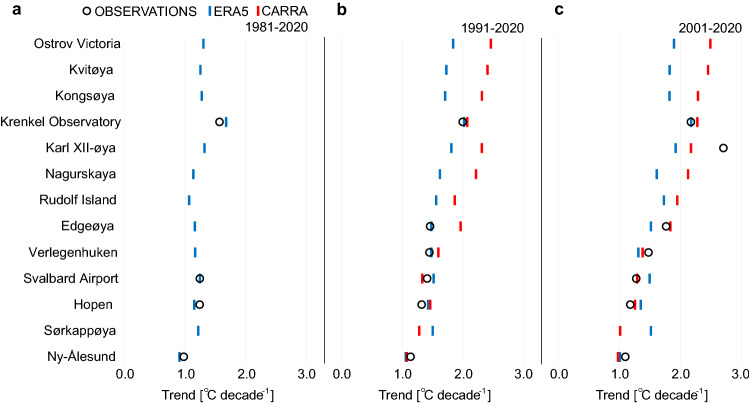
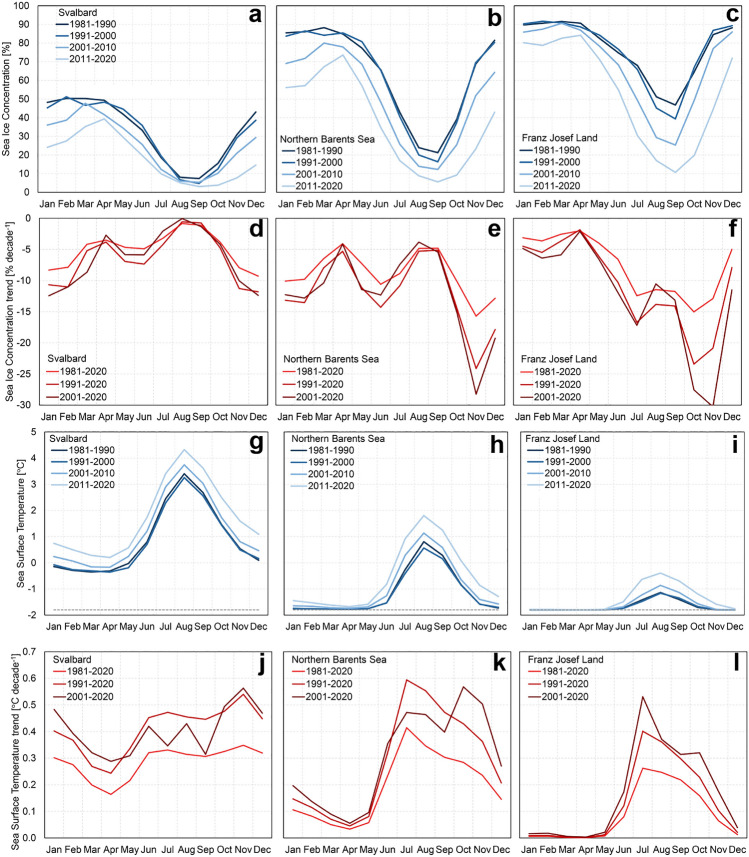
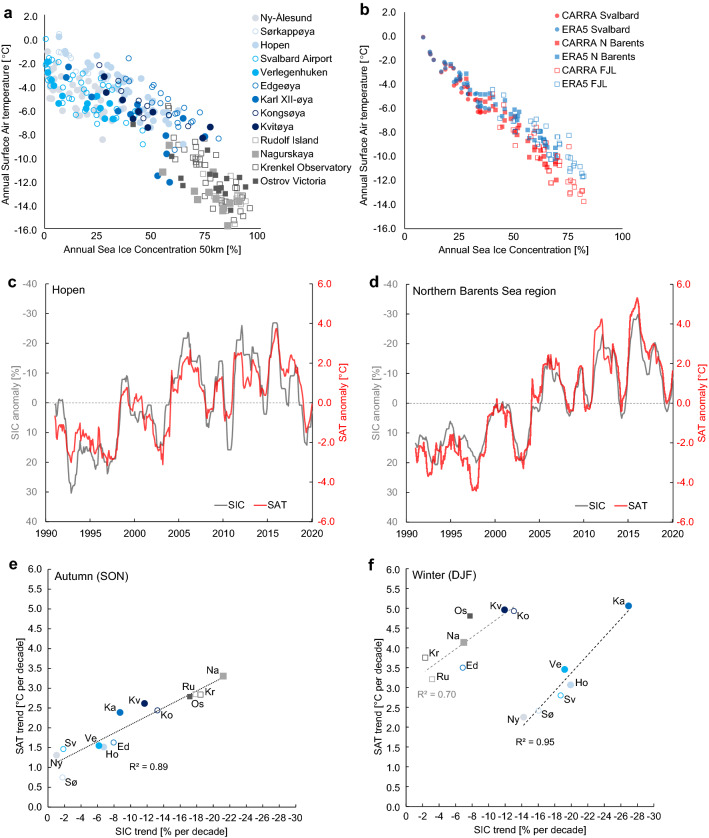
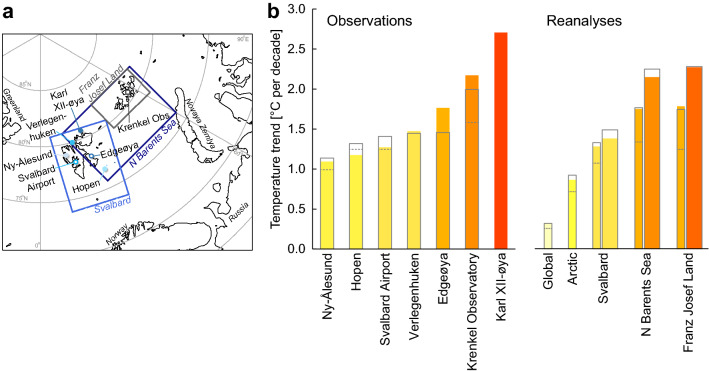
In recent decades, surface air temperature (SAT) data from Global reanalyses points to maximum warming over the northern Barents area. However, a scarcity of observations hampers the confidence of reanalyses in this Arctic hotspot region. Here, we study the warming over the past 20-40 years based on new available SAT observations and a quality controlled comprehensive SAT dataset from the northern archipelagos in the Barents Sea. We identify a statistically significant record-high annual warming of up to 2.7 °C per decade, with a maximum in autumn of up to 4.0 °C per decade. Our results are compared with the most recent global and Arctic regional reanalysis data sets, as well as remote sensing data records of sea ice concentration (SIC), sea surface temperature (SST) and high-resolution ice charts. The warming pattern is primarily consistent with reductions in sea ice cover and confirms the general spatial and temporal patterns represented by reanalyses. However, our findings suggest even a stronger rate of warming and SIC-SAT relation than was known in this region until now.


Conflict of interest statement

The authors declare no competing interests.

Figures

Figure 1
Figure 1
Spatial pattern of the Arctic warming and sea ice decline. (a)–(d) show trends in annual SAT (°C/decade) during the 1981–2020 period derived from various reanalyses sources (see Methods) that have been widely used for the Arctic: (a) NCEP-reanalysis, (b) MERRA-2, (c) JRA55 and d) ERA5. (e), (f) show annual trends in SIC (%/decade) and SST (°C/decade) (EUMETSAT OSI SAF, C3S/ESA SST CCI). The Barents study area is marked with dotted lines. We used the esd R-package (https://doi.org/10.5281/zenodo.29385) to create the maps in (ad). The maps in (ef) were generated using Python 3.6 (http://www.python.org) including pyresample 1.19 and cartopy 0.18.
Figure 2
Figure 2
The spatial pattern of changes in surface air temperature, sea ice and sea surface temperature in the Barents study area for the time periods 1981–2020, 1991–2020 and 2001–2020. (a) Barents study area including the 13 weather stations which are shown with symbols and the first two letters of the station name from Fig. 3b (for larger map and more details, see Fig. S1). The regional boxes used for time series analyses (Table 1 and 3) are marked on the map, including the four Svalbard sub-regions. (b)(f) Annual SAT trends (°C/decade) derived from CARRA and ERA5. Please note that the results are mapped onto different grid resolutions. (g)–(i) Annual trends in SIC (%/decade) with mean 15% SIC (ice edge) contour line marked in grey, and (j)–(l) present the annual SST trends (°C/decade) during the three periods. We used the esd R-package (https://doi.org/10.5281/zenodo.29385) to create the maps in b-f. The maps in a, g-l were generated using Python 3.6 (http://www.python.org) including pyresample 1.19 and cartopy 0.18.
Figure 3
Figure 3
Temperature series from weather stations and observed trends. (a) Annual SAT series from the manned stations at Svalbard Airport, and Krenkel Observatory. (b) Annual SAT 1981–2020 from both old and newly available observations from Norwegian (in blue) and Russian (in grey) weather stations. (c) The new SAT series from the automatic weather stations at Verlegenhuken, Edgeøya, and Karl XII-øya compared with the manned station at Hopen. The data in a were filtered by a Gaussian filter with a standard deviation of three years, which illustrates variability at a decadal scale. In c linear trends for the 2001–2020 period are shown as solid lines. Values for the linear trends and statistical significance can be found in Table 1.
Figure 4
Figure 4
Annual trends in surface air temperature compared with reanalyses. Estimated SAT trends from observations (circles), ERA5 (blue bars) and CARRA (red bars, only in b and c) for the three different time periods: (a) 1981–2020, (b) 1991–2020 and c 2001–2020. The order of stations follows the ranked annual trends computed from CARRA reanalysis for the period 2001–2020. Similar results but for seasonal values can be found in Fig. S6.
Figure 5
Figure 5
Decadal monthly mean sea-ice concentration and sea surface temperature and trends. Monthly decadal mean SIC and SST for Svalbard (a), (g), Northern Barents Sea (b), (h) and Franz Josef Land (c), (i) (see Fig. 2a). Estimated linear trends for SIC (d)–(f) and SST (j)–(l), respectively, for the same areas and for the three study periods.
Figure 6
Figure 6
Correlation between sea ice concentration and surface air temperature. (a) Scatter plot between the annual SIC (calculated from 50 × 50 km boxes) and the annual SAT observed at the weather stations for 1981–2020. SAT data are original values only (no interpolations). (b) Scatter plot between the regional annual mean SIC (OSI SAF data) and SAT (from CARRA and ERA5) calculated from regional boxes (cf. Figure 2a) for the period 1991–2020. c 12-month running mean SIC- and SAT-anomalies for Hopen, based on the SIC 50 × 50 km boxes (NIS-dataset) and instrumental observations, respectively. The anomalies were computed with respect to the 1991–2020 mean. (d) Same as in c but for the NBS region, based on OSI SAF and CARRA datasets, respectively. (e) Scatter plot between 1991–2020 trends in SIC (calculated from 50 × 50 km boxes) and SAT from the weather stations for autumn (SON). (f) Same as in e but for winter (DJF) with regression lines for stations located in “Svalbard south, west and north” and “Svalbard east and FJL”. In (e) and (f) CARRA series at station locations is used for gap-filling where SAT data are missing in part of the series for Sørkappøya (Sø), Karl XII-øya (Ka), Kongsøya (Ko), Kvitøya (Kv), Rudolf Island (Ru), Nagurskaya (Na) and Ostrov Viktoria (Os). Stations are shown with symbols and the first two letters of the station name from (a).
Figure 7
Figure 7
Temperature trends based on instrumental observations and ERA5 and CARRA reanalyses. (a) The location of the main stations and main regions in the study. (b) Linear trends for annual SAT series and reanalyses for the period 2001–2020. Bar colours follow the colour scale for SAT in Fig. 2. If available, the SAT trends over the 1981–2020 and 1991–2020 periods are additionally shown as dotted and solid grey line bars, respectively. On the right hand side of the bar plots, the ERA5 and CARRA reanalyses are shown as thin and thick bars, respectively. In addition, SAT trends for ERA5 for the Arctic (i.e. north of 65° latitude) and global mean are shown. The map in a was generated using Python version 3.6 (http://www.python.org) including pyresample 1.19.

References

    1. Thoman, R. L., Richter-Menge J. & Druckenmiller, M. L. (eds.). Arctic Report Card 2020, 10.25923/mn5p-t549 (2020).
    1. Serreze MC, Barry RG. Processes and impacts of Arctic amplification: A research synthesis. Glob. Planet Change. 2011;77(1–2):85–96. doi: 10.1016/j.gloplacha.2011.03.004. - DOI
    1. Meredith, M. et al. Polar Regions. In IPCC Special Report on the Ocean and Cryosphere in a Changing Climate (eds. H.-O. Pörtner, D.C. Roberts, V. Masson-Delmotte, P. Zhai, M. Tignor, E. Poloczanska, K. Mintenbeck, A. Alegría, M. Nicolai, A. Okem, J. Petzold, B. Rama, N.M. Weyer ). In press. https://www.ipcc.ch/srocc/chapter/chapter-3-2/ (2019).
    1. C3S Climate Indicators. Sea ice as a climate indicator from the Copernicus Climate Change Service. https://climate.copernicus.eu/climate-indicators/sea-ice (2022).
    1. Stroeve J, Notz D. Changing the state of Arctic sea ice across all seasons. Environ. Res. Lett. 2018 doi: 10.1088/1748-9326/aade56. - DOI