. 2022 Jun 15;12(1):9961.
doi: 10.1038/s41598-022-14000-8.

Vectorcardiography-derived index allows a robust quantification of ventricular electrical synchrony

Affiliations

Vectorcardiography-derived index allows a robust quantification of ventricular electrical synchrony

Juan M F Fernández et al. Sci Rep. .

Abstract

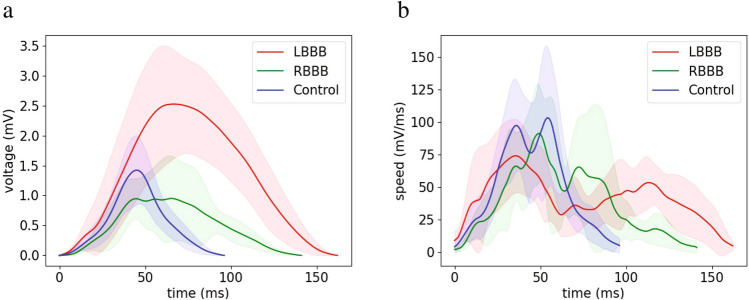
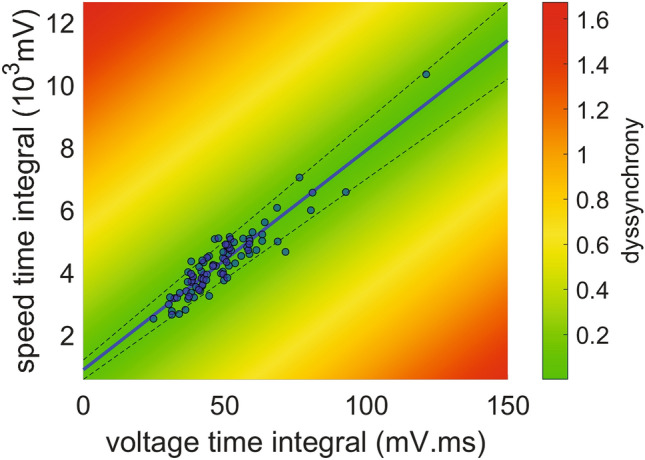
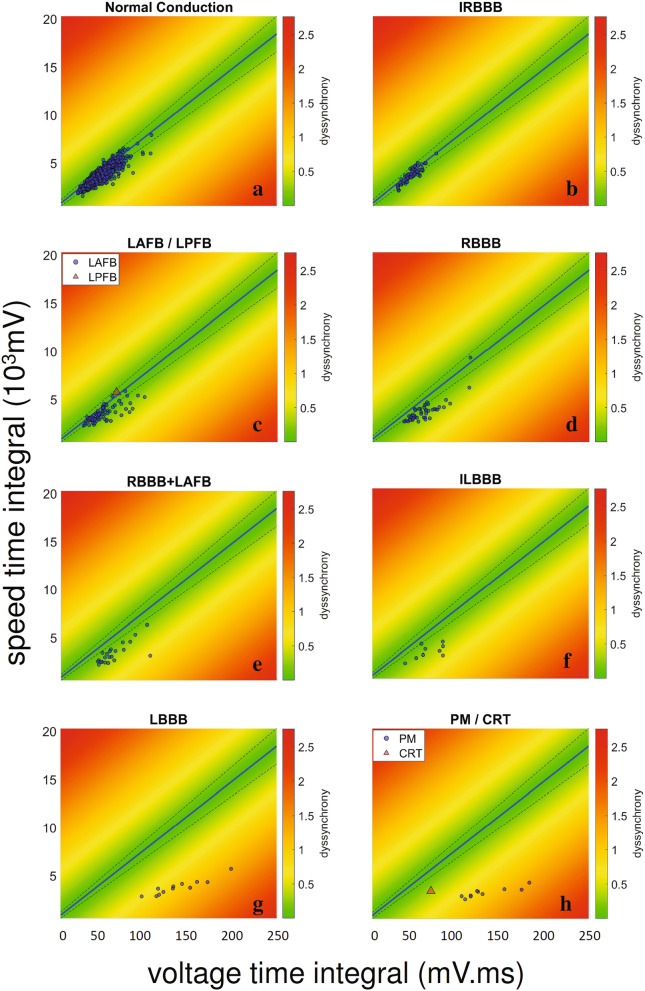
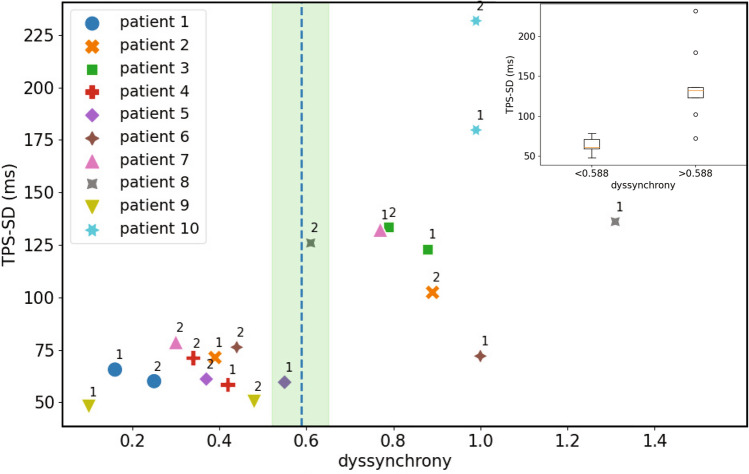
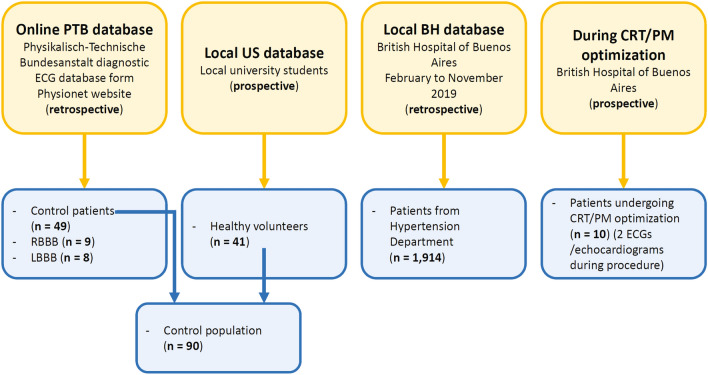
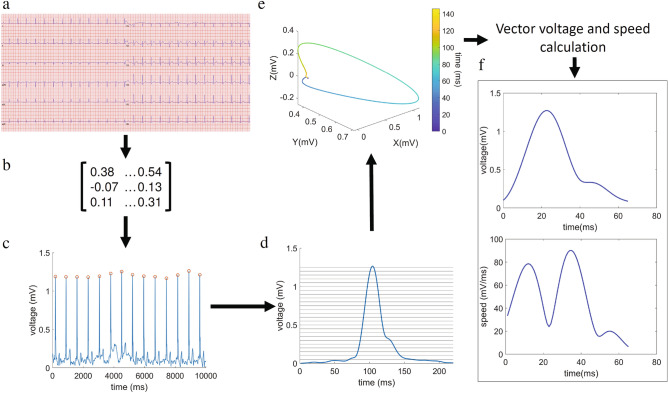
Alteration of muscle activation sequence is a key mechanism in heart failure with reduced ejection fraction. Successful cardiac resynchronization therapy (CRT), which has become standard therapy in these patients, is limited by the lack of precise dyssynchrony quantification. We implemented a computational pipeline that allows assessment of ventricular dyssynchrony by vectorcardiogram reconstruction from the patient's electrocardiogram. We defined a ventricular dyssynchrony index as the distance between the voltage and speed time integrals of an individual observation and the linear fit of these variables obtained from a healthy population. The pipeline was tested in a 1914-patient population. The dyssynchrony index showed minimum values in heathy controls and maximum values in patients with left bundle branch block (LBBB) or with a pacemaker (PM). We established a critical dyssynchrony index value that discriminates electrical dyssynchronous patterns (LBBB and PM) from ventricular synchrony. In 10 patients with PM or CRT devices, dyssynchrony indexes above the critical value were associated with high time to peak strain standard deviation, an echocardiographic measure of mechanical dyssynchrony. Our index proves to be a promising tool to evaluate ventricular activation dyssynchrony, potentially enhancing the selection of candidates for CRT, device configuration during implantation, and post-implant optimization.


Conflict of interest statement

The authors declare no competing interests.

Figures

Figure 1
Figure 1
Population-wise kinetics of voltage and speed signals for left and right bundle branch block (LBBB and RBBB) compared with control patients. Signal lengths were normalized to the mean length to obtain the average signal for each condition. Shaded areas represent the standard deviation. (a) Voltage over time signals for control subjects (blue, n = 49), patients with right bundle branch block (RBBB, green, n = 9) or left bundle branch block (LBBB, red, n = 8) obtained from the PTB database. LBBB signals show higher voltage values and signal duration as compared with controls or RBBB. (b) Vector speed over time for the same three conditions. LBBB and RBBB signals show slower movement through the vector field as compared with controls. The figure was created using Python’s Matplotlib library (v.3.4.2.).
Figure 2
Figure 2
Heatmap showing the dyssynchrony index and the VCG-based time integral of voltage as well as speed from healthy individuals. Vector speed time integral (STI) plotted against vector voltage time integral (VTI) for 90 control individuals. The blue line is the linear fit of the data (r2 = 0.86, dotted lines: 95% confidence interval). The line’s slope represents the tissue characteristic time (70.28 ms−1). The colour bar highlights the dyssynchrony index as defined in the Methods section. The figure was created using MATLAB R2019b (https://www.mathworks.com/).
Figure 3
Figure 3
Heatmap showing the dyssynchrony index and the VCG-based time integral of voltage as well as speed for different conduction patterns in a heterogeneous population (local BH database). Each dot represents one patient, the blue line is the linear fit for the control population (Fig. 2) and dashed lines contain the 95% confidence interval (CI). Colorbar represent the value of the dyssynchrony index. Each patient was classified in its conduction pattern category by two cardiologists. Speed time integral (STI) vs. voltage time integral (VTI) plot for ECGs classified as normal conduction (a, n = 1672), incomplete right bundle branch block (IRBBB, b, n = 63), left anterior/left posterior fascicular flock (LAFB/LPFB, c, n = 78), complete right bundle branch block (RBBB, d, n = 47), right bundle branch block plus left anterior fascicular block (RBBB + LAFB, e, n = 22), incomplete left bundle branch block (ILBBB, f, n = 9), complete left bundle branch block (LBBB, g, n = 12) and pacemaker/cardiac resynchronization therapy (PM/CRT, h, n = 11). The figure was created using MATLAB R2019b (https://www.mathworks.com/).
Figure 4
Figure 4
Simultaneous quantification of mechanical dyssynchrony and the dyssynchrony index. Standard deviation of the time to peak strain (TPS-SD) plotted against the dyssynchrony index. The marker styles represent different patients, 1 and 2 represent the ventricular stimulations denoted in Table 1. Green shaded area and blue vertical dashed line indicate, respectively, the range (0.519–0.657) and average (0.588) of the optimal cut-off values determined by using a logistic regression analysis (see the Methods section, subsection Statistical Methods and Fig. S5). Inset: Box plot showing TPS-SD for 10 patients (20 pacing configurations) grouped according to the average cut-off value for the dyssynchrony index (p = 0.00031). The figure was created using Python’s Matplotlib library (v.3.4.2.).
Figure 5
Figure 5
Sources of ECG recordings. CRT: cardiac resynchronization therapy. PM pacemaker, RBBB right bundle branch block, LBBB left bundle branch block.
Figure 6
Figure 6
ECG-derived VCG extraction algorithm and calculation of instantaneous vector voltage and speed kinetics. (a) Raw ECG data is loaded into the program as input. (b) Kors transformation matrix is applied to the raw data. (c) Peaks are identified along the voltage (spatial vector magnitude) over time signal. (d) Patient mean depolarization signal (peak-aligned) limits are identified by a custom adaptive threshold method. (e) VCG extraction (colour bar representing time in ms). (f) Instantaneous voltage and speed signals over time are obtained. The figure was created using MATLAB R2019b (https://www.mathworks.com/).

References

    1. Virani SS, et al. Heart disease and stroke statistics—2020 update: A report from the American Heart Association. Circulation. 2020 doi: 10.1161/cir.0000000000000757. - DOI - PubMed
    1. Yancy CW, et al. 2013 ACCF/AHA Guideline for the management of heart failure: Executive summary: A report of the American College of Cardiology Foundation/American Heart Association Task Force on Practice Guidelines. Circulation. 2013;128:1810–1852. doi: 10.1161/CIR.0b013e31829e8807. - DOI - PubMed
    1. McDonagh TA, et al. 2021 ESC Guidelines for the diagnosis and treatment of acute and chronic heart failure. Eur. Heart J. 2021;42:3599–3726. doi: 10.1093/eurheartj/ehab368. - DOI - PubMed
    1. Daubert C, Behar N, Martins RP, Mabo P, Leclercq C. Avoiding non-responders to cardiac resynchronization therapy: A practical guide. Eur. Heart J. 2016 doi: 10.1093/eurheartj/ehw270. - DOI - PubMed
    1. Varma N. Left ventricular conduction delays and relation to QRS configuration in patients with left ventricular dysfunction. Am. J. Cardiol. 2009;103:1578–1585. doi: 10.1016/j.amjcard.2009.01.379. - DOI - PubMed

Publication types

MeSH terms