. 2022 Jun;606(7916):984-991.
doi: 10.1038/s41586-022-04738-6. Epub 2022 Jun 15.

Signatures of copy number alterations in human cancer

Affiliations

Signatures of copy number alterations in human cancer

Christopher D Steele et al. Nature. 2022 Jun.

Abstract

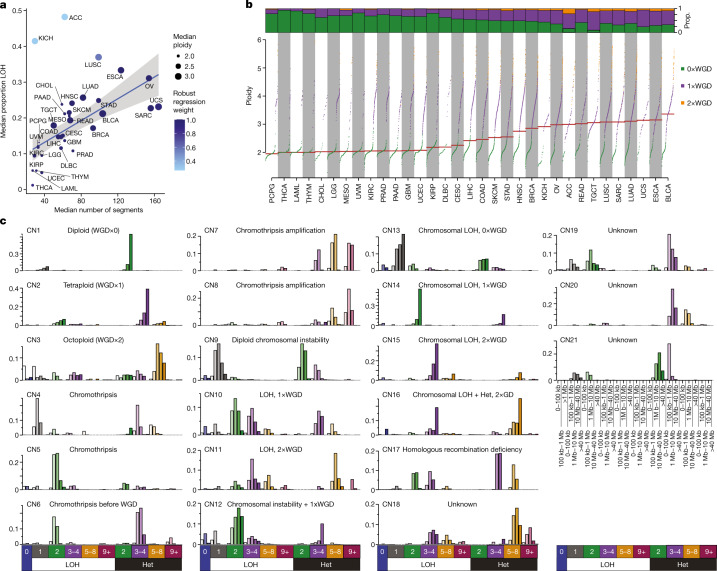
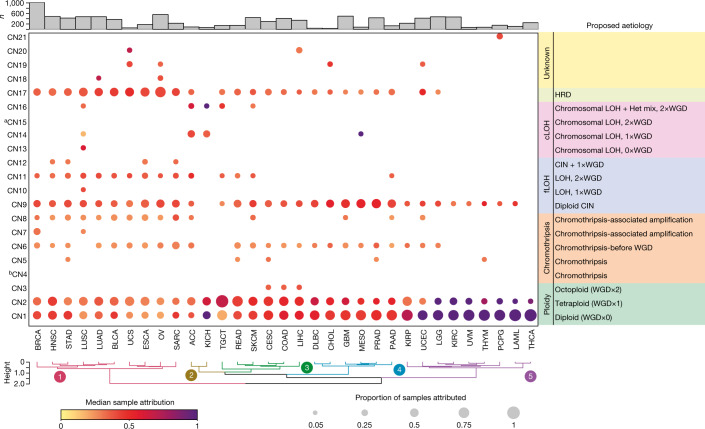
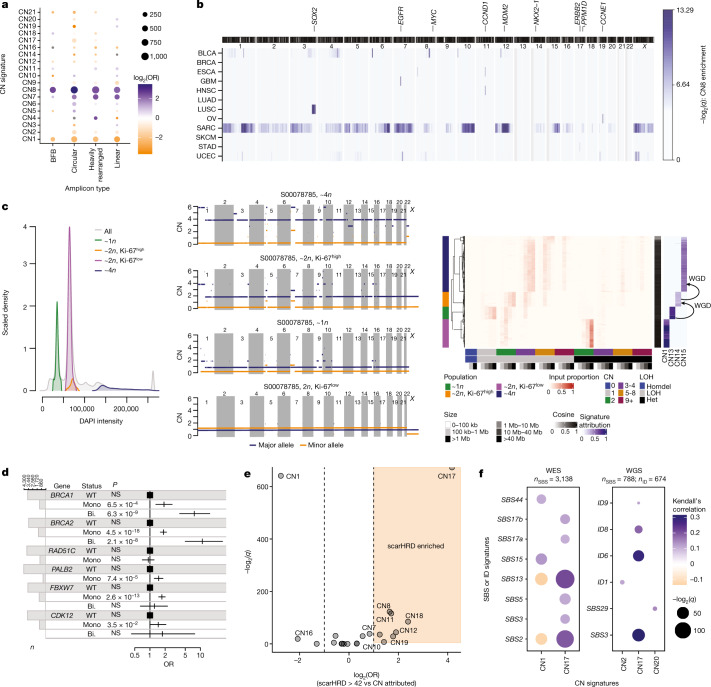
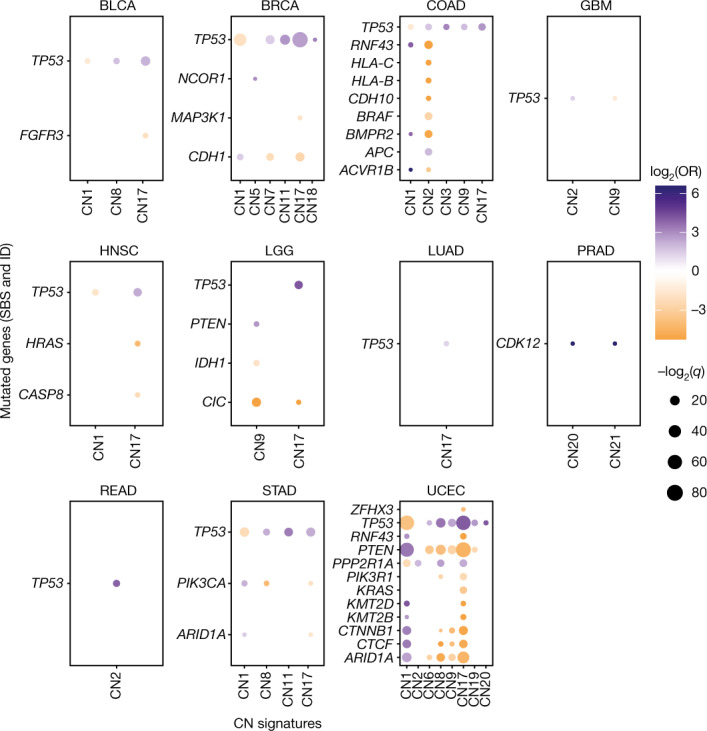
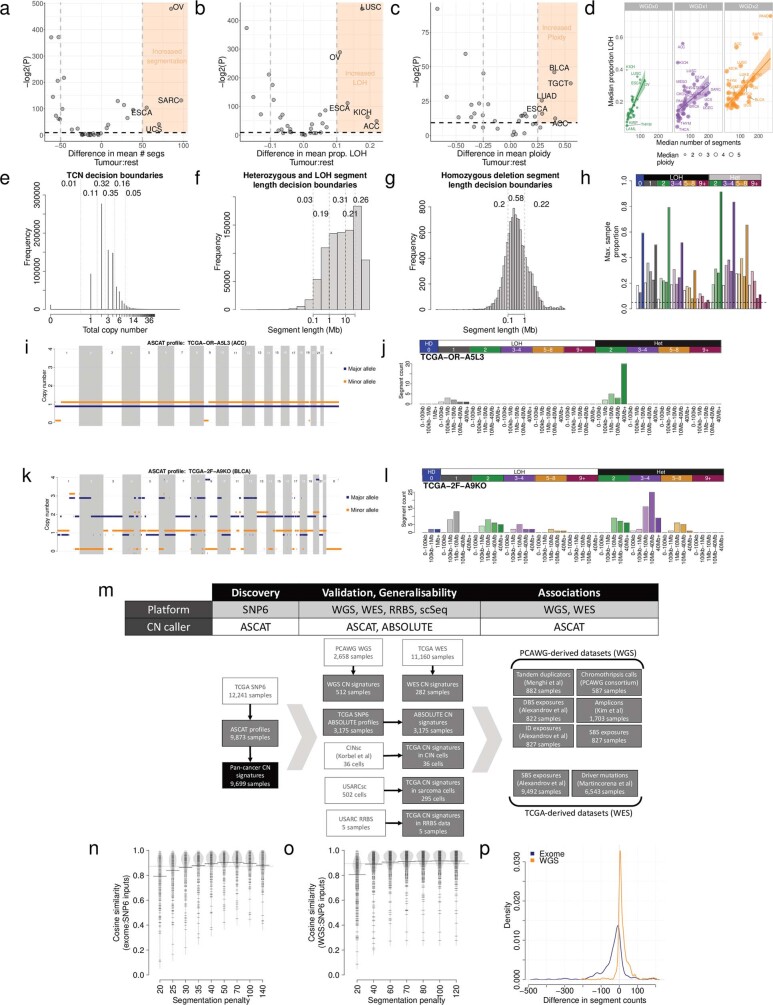
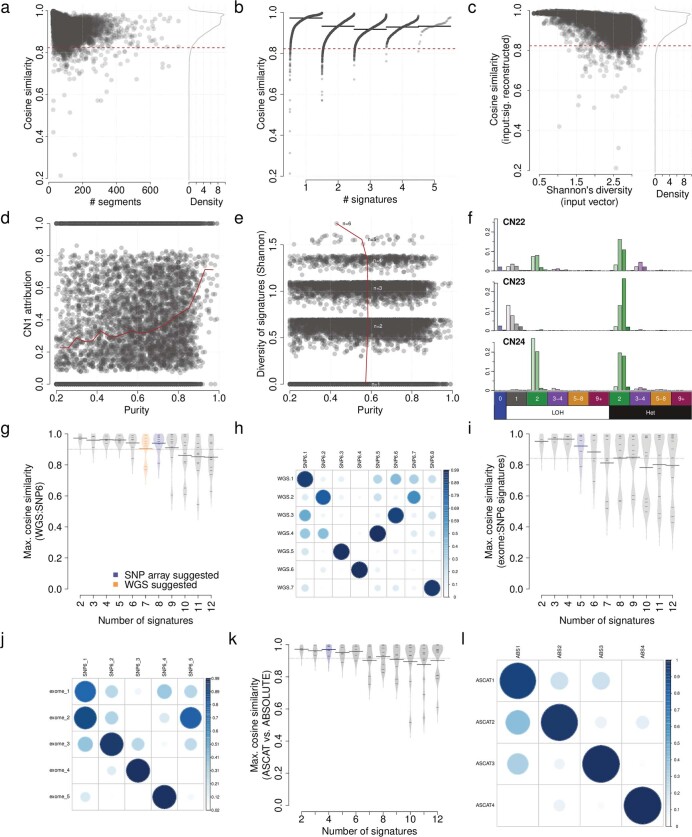
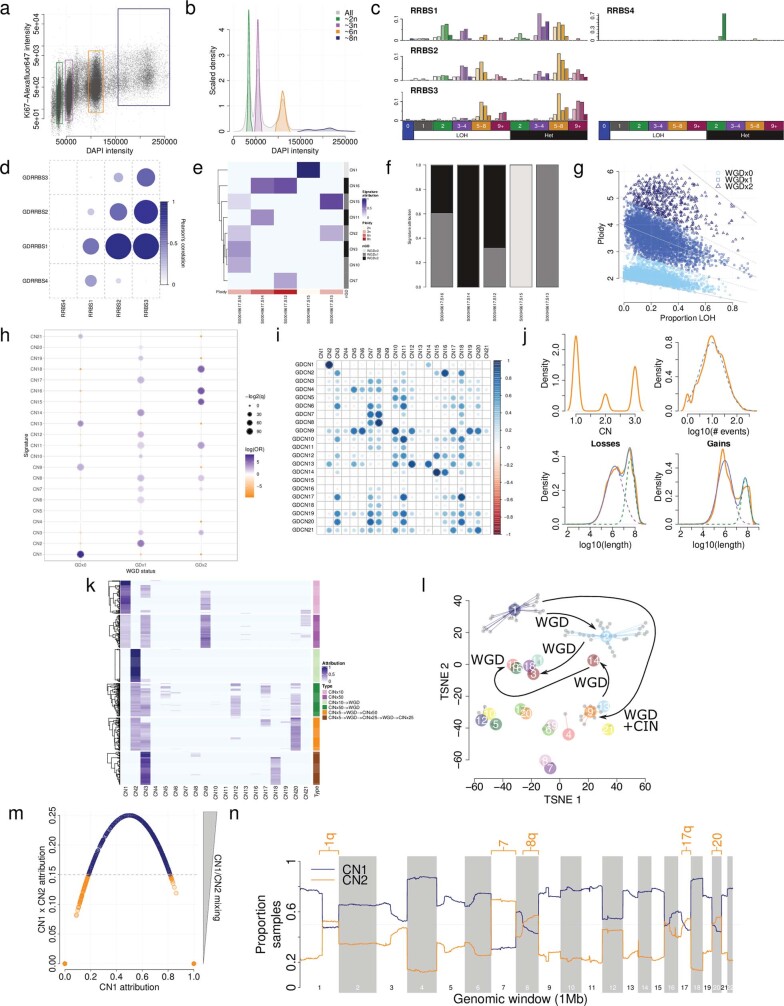
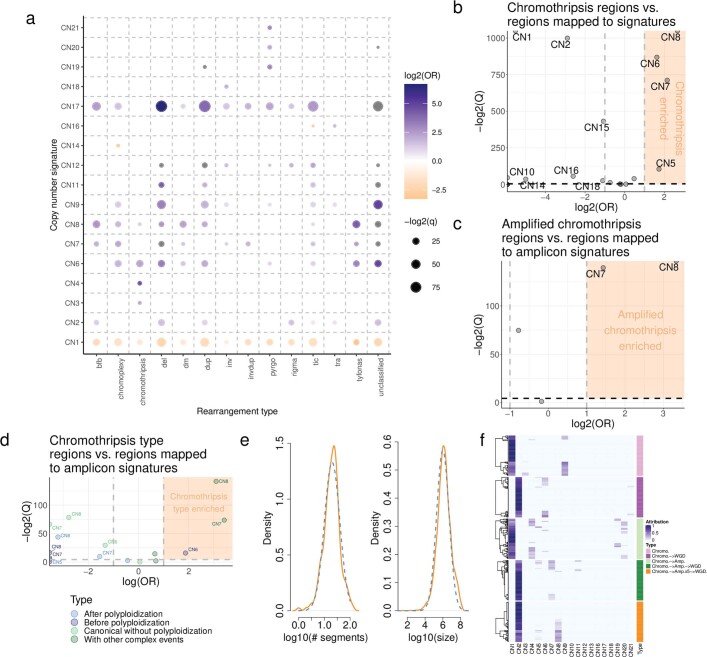
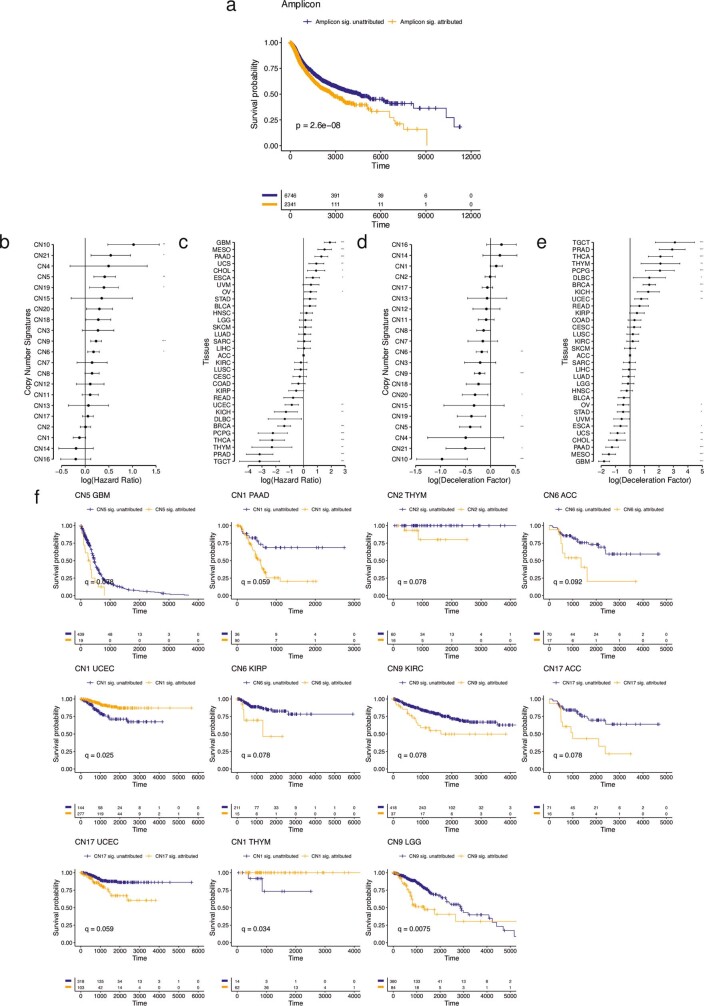
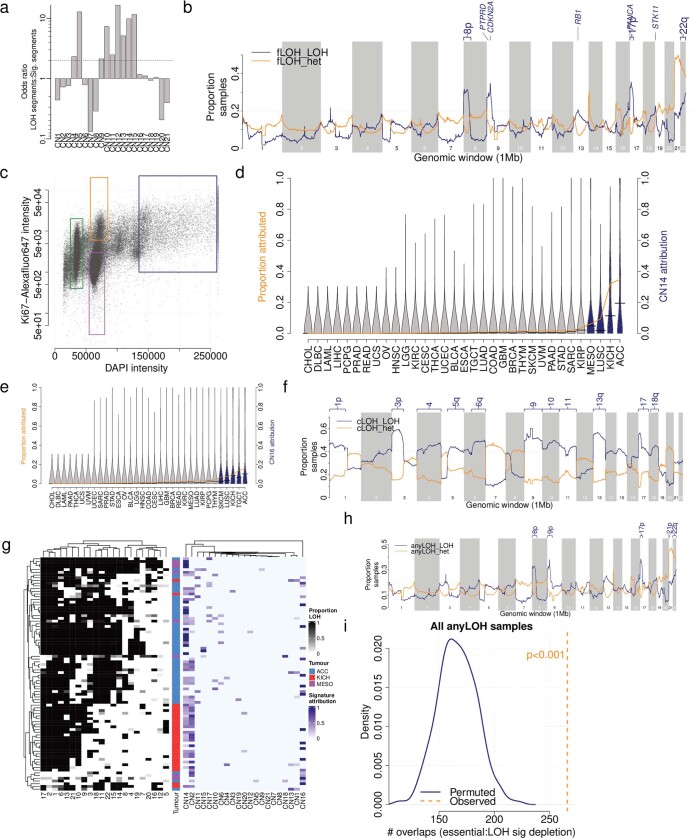
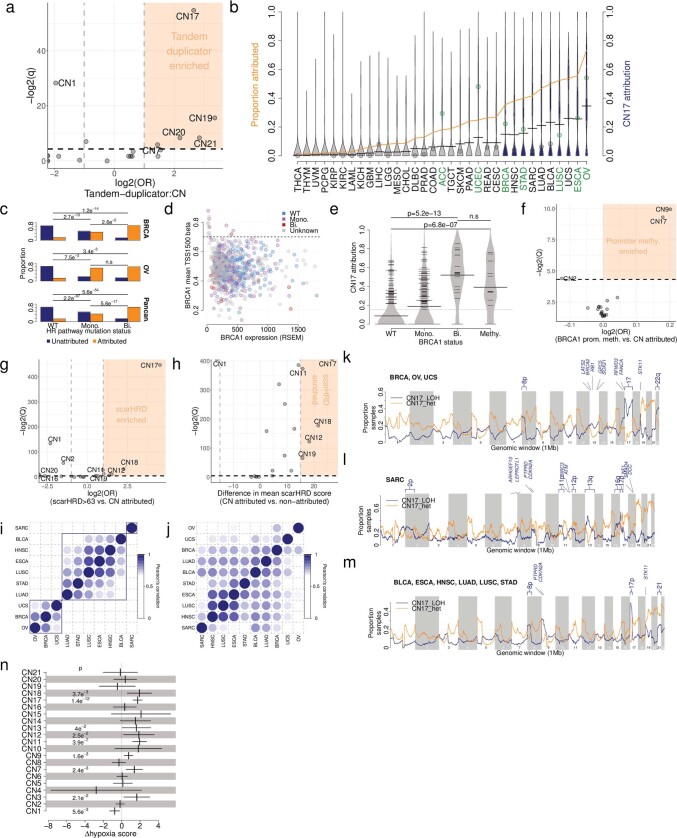
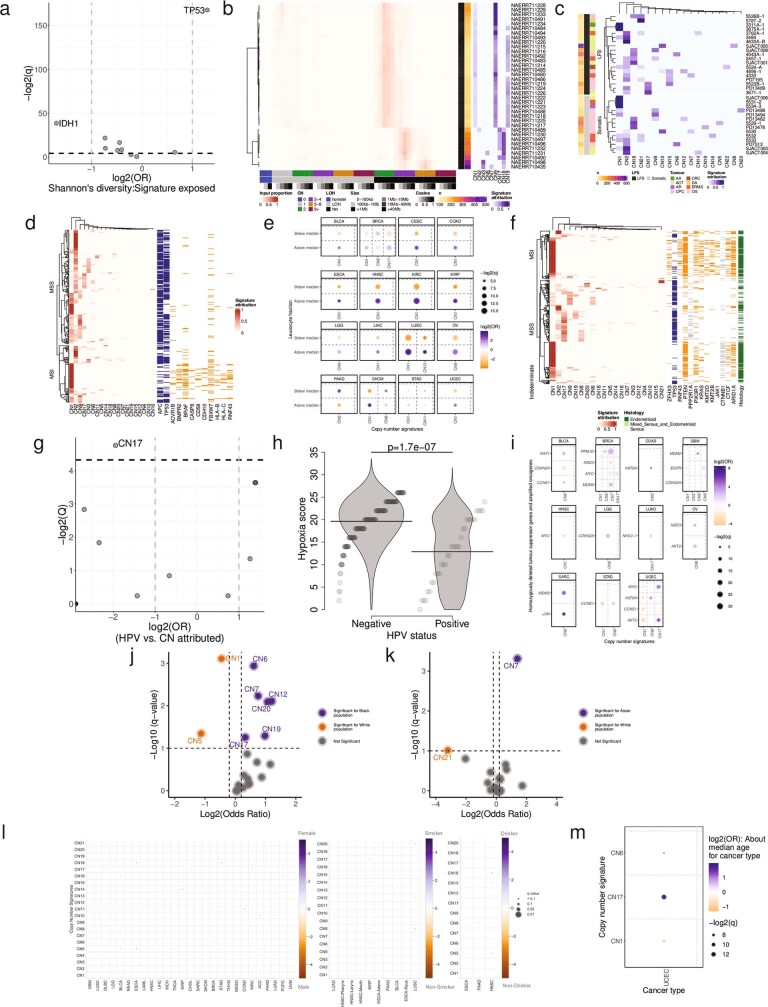
Gains and losses of DNA are prevalent in cancer and emerge as a consequence of inter-related processes of replication stress, mitotic errors, spindle multipolarity and breakage-fusion-bridge cycles, among others, which may lead to chromosomal instability and aneuploidy1,2. These copy number alterations contribute to cancer initiation, progression and therapeutic resistance3-5. Here we present a conceptual framework to examine the patterns of copy number alterations in human cancer that is widely applicable to diverse data types, including whole-genome sequencing, whole-exome sequencing, reduced representation bisulfite sequencing, single-cell DNA sequencing and SNP6 microarray data. Deploying this framework to 9,873 cancers representing 33 human cancer types from The Cancer Genome Atlas6 revealed a set of 21 copy number signatures that explain the copy number patterns of 97% of samples. Seventeen copy number signatures were attributed to biological phenomena of whole-genome doubling, aneuploidy, loss of heterozygosity, homologous recombination deficiency, chromothripsis and haploidization. The aetiologies of four copy number signatures remain unexplained. Some cancer types harbour amplicon signatures associated with extrachromosomal DNA, disease-specific survival and proto-oncogene gains such as MDM2. In contrast to base-scale mutational signatures, no copy number signature was associated with many known exogenous cancer risk factors. Our results synthesize the global landscape of copy number alterations in human cancer by revealing a diversity of mutational processes that give rise to these alterations.


Conflict of interest statement

L.B.A. is an inventor on US Patent 10,776,718 for source identification by NMF. All other authors declare no competing interests.

Figures

Fig. 1
Fig. 1. Pan-cancer copy number features of 33 tumour types from TCGA.
a, Median number of segments in a copy number (CN) profile (x axis), median proportion of the genome that shows LOH (y axis) and the proportion of samples that have undergone one or more WGD events (size). The line of best fit from a robust linear regression is shown, whereby the colour of points indicates the weight of the tumour type in the regression model. Error bands indicate the 95% confidence interval, n = 33, t = 4.95, P = 2.5e-5. See Supplementary Table 1 for cancer type abbreviations. b, Ploidy characteristics of all samples split by tumour type. Bottom, ploidy (y axis) for each sample in a tumour type (x axis), whereby samples are coloured by their genome doubling status as follows: 0×WGD, non-genome-doubled (green); 1×WGD, genome doubled (purple); and 2×WGD, twice genome-doubled (orange). Top, proportion (Prop.) of samples in each tumour type that are 0, 1 or 2×WGD. Horizontal lines indicate median ploidies. c, Decomposition plots of 21 pan-cancer copy number signatures (CN1–CN21). Heterozygosity (Het) status and total copy number (0–9+) are indicated below each column. Segment sizes are shown on the bottom right. Increasing saturation of colour indicates increasing segment size.
Fig. 2
Fig. 2. Distribution of copy number signatures across human cancers.
Attributions of the 21 signatures (y axis) split by tumour type (x axis). The size of each dot represents the proportion of samples of each tumour type that shows the signature and the colour reflects the median attribution of the signature in each tumour type. Tumour/signature attributions with less than 5% of samples are not shown. Hierarchical clustering is shown below, sample sizes are shown above. aCN15 was identified from an extraction of high LOH samples (>70% of the genome LOH), and is not found at ≥5% frequency in any tumour type. bCN4 was identified in UVM at <5% frequency. Het mix, mixture of heterozygous segments.
Fig. 3
Fig. 3. Biological inference of copy number signatures.
a, Associations between signatures (y axis) and amplicon structures (x axis), displaying the q value (size) and log2(OR) (colour) from two-sided Fisher’s exact tests of genomic regions unattributed or attributed to each signature against each amplicon type. Only significant (q < 0.05) associations are shown. BFB, breakage–fusion–bridge. b, Enrichment of mapped CN8 in 1-Mb windows of the human genome across 8 cancer types in which ≥40 samples were attributed CN8. Colour indicates the –log2(q value) from a bootstrapping analysis to determine significance. An ideogram of chromosome bands is shown above. c, Single-cell sequencing from a near-genome-wide LOH undifferentiated soft tissue sarcoma. Sorted populations of cells based on ploidy and proliferation (left) were single-cell sequenced and copy number profiled (middle, representative cells). Copy number (y axis) across the genome (x axis) is given for both the major (blue) and minor (orange) allele. Copy number summaries (red) and signatures (blue) recapitulate the pattern seen in the copy number profiles (right). d, Association between mutational status of key HR pathway genes and CN17 attribution from a multivariate two-sided logistic regression model including cancer type as a covariate. NS, not significant (P ≥ 0.05). Squares represent point estimates for the odds ratio (OR). Horizontal lines indicate 95% confidence intervals. n = 4,919 biologically independent tumours. Bi., bi-allelic alteration; Mono., monoallelic alteration; WT, wild type. e, Association between signature attribution and scarHRD score, an orthogonal test for HRD, displaying –log2(q) (y axis) and log2(OR) (x axis) from two-sided Fisher’s exact tests in which scarHRD positivity was based on a threshold of >42. A half dot indicates an infinite –log2(q value) (q = 0). f, Correlation between copy number signature (x axis) attribution and SBS  or ID signature (y axis) exposure across TCGA exomes (left) and whole genomes (right). The strength of correlation is indicated by colour (orange, anticorrelated, blue, correlated), the q value is indicated by point size. Non-significant (q > 0.01) associations are not shown.
Fig. 4
Fig. 4. Genomic associations of copy number signatures.
Associations between copy number signatures (x axis) and driver-gene single nucleotide variant and ID status (y axis) across each TCGA tumour type (panels). Effect size (log2(OR), colour), and significance level (–log2(q), size) from two-sided Fisher’s exact tests are displayed. Non-significant (q ≥ 0.05) associations are not shown.
Extended Data Fig. 1
Extended Data Fig. 1. Choice of copy number categories.
a) Enrichment of segment counts in TCGA tumour types: x-axis=difference in mean segment counts between tumour type and all other tumours, y-axis=-log2(P-value) from a two-sided Mann-Whitney test. b) Enrichment of LOH in TCGA tumour types: x-axis=difference in mean proportion of genome LOH between tumour type and all other tumours, y-axis=-log2(P-value) from a two-sided Mann-Whitney test. c) Enrichment of high ploidy in TCGA tumour types: x-axis=difference in mean ploidy between tumour type and all other tumours, y-axis=-log2(P-value) from a two-sided Mann-Whitney test. d) Relationship between median number of segments (x-axis), median proportion of the genome that is LOH (y-axis) and ploidy (size) of 33 cancer types in TCGA, split by genome doubling status (panels). Error bands indicate the 95% confidence interval. e) Distribution of total copy number across TCGA. Dashed lines indicate decision boundaries between copy number classes. Numbers indicate the proportion of segments across TCGA that fall within the designated category. f) Maximum proportion of segments (y-axis) of each copy number category (x-axis) in any sample across TCGA. Increasing colour saturation indicates increasing segment length. g) Allele-specific copy number profile from a majority diploid sample (sample ID: TCGA-OR-A5L3, tumour type: ACC). Copy number (y-axis) across the genome (x-axis) is given for both the major (blue) and minor (orange) allele. i) Allele-specific copy number profile for a highly copy number aberrant sample (sample ID: TCGA-2F-A9KO, tumour type: BLCA). j) Copy number summary for TCGA-2F-A9KO. k) Overview of the discovery and validation datasets and samples used to develop the pan-cancer copy number signatures. Raw sequencing or array datasets that were used to generate copy number profiles are shown in white, previously processed datasets are shown in grey, and the pan-cancer copy number signature dataset is shown in black. WGS=whole genome sequencing, WES=whole exome sequencing, RRBS=reduced representation bisulfite sequencing, scSeq=single cell DNA sequencing. Throughout, samples have been excluded from analysis for data quality reasons, and to ensure sample matching between disparate datasets (see Methods for full details). l) Cosine similarity (y-axis) between input copy number summary vectors for exome sequencing and SNP6 array derived copy number profiles. m) Cosine similarity (y-axis) between input copy number summary vectors for whole genome sequencing and SNP6 array derived copy number profiles. n) Difference in segment counts between SNP6 array copy number profiles and whole genome sequencing (orange) or exome sequencing (blue) copy number profiles.
Extended Data Fig. 2
Extended Data Fig. 2. Signature derivations.
a) Cosine similarity between input copy number 48 dimensional vectors, and signature reconstructed 48 dimensional vectors (y-axis) against number of segments in each copy number profile (x-axis). Dashed line indicates cosine similarity threshold for non-random similarity (P < 0.05). b) Cosine similarity between input copy number 48 dimensional vectors, and signature reconstructed 48 dimensional vectors (y-axis) against the number of signatures assigned in each sample (x-axis). Dashed line indicates cosine similarity threshold for non-random similarity (P < 0.05). Solid lines indicate median cosine similarity. The number of signatures is plotted offset by the quantile of the sample. c) Cosine similarity between input copy number 48 dimensional vectors, and signature reconstructed 48 dimensional vectors (y-axis) against the Shannon’s diversity of copy number states in input 48 dimensional vector (x-axis). Dashed line indicates cosine similarity threshold for non-random similarity (P < 0.05). d) Relationship between tumour purity (x-axis) and CN1 attribution (y-axis). If purity was a confounding factor for copy number calling, purity would be positively associated with CN1 attribution due to a reduced power to call copy number alterations, however, the opposite relationship is seen here. e) Relationship between tumour purity (x-axis) and Shannon’s diversity of attributed copy number signatures (y-axis). If purity was a confounding factor for copy number calling, purity might be expected to negatively associate with diversity due to reduced power to call copy number alterations, however, no such association is seen here. f) Three artefactual signatures identified in the TCGA pan-cancer analysis. Artefactual signatures are typified by a large number of homozygous deletions (top two), or small segment sizes of equal copy number in LOH and heterozygous segments (bottom). g) Maximum cosine similarities between each WGS signature and any SNP6 identified signatures (i.e. closest matching signature cosine similarity, y-axis) from 512 samples, with varying numbers of signatures decomposed (x-axis). h) Cosine similarities between WGS (x-axis) and SNP6 (y-axis) identified signatures from 512 samples, with a segmentation penalty of 70. i) Maximum cosine similarities between each exome signature and any SNP6 identified signatures (i.e. closest matching signature cosine similarity, y-axis) from 282 samples, with varying numbers of signatures decomposed (x-axis). j) Cosine similarities between exome and SNP6 identified signatures from 282 samples, with a segmentation penalty of 70 and suggested number of signatures extracted. k) Maximum cosine similarities between each ABSOLUTE-derived signature and any ASCAT-derived signatures (i.e. closest matching signature cosine similarity, y-axis) from 3,175 samples, with varying numbers of signatures decomposed (x-axis). l) Cosine similarities between ABSOLUTE-derived and ASCAT-derived signatures from 3,175 samples, with four signatures extracted in each dataset.
Extended Data Fig. 3
Extended Data Fig. 3. Ploidy associated signatures.
a) Flow cytometry sorting of cells based on staining of DAPI (x-axis) as a proxy for DNA content and ki67 staining (y-axis) as a marker of proliferation. Cells were gated for sorting according to coloured boxes shown. b) Density of cells from flow sorting shown for all cells (grey) and for individual sorted populations of cells (coloured). c) De-novo signatures extracted from ploidy-sorted populations of cells profiled with reduced representation bisulfite sequencing. d) Cosine similarities between de-novo signatures and artificially genome- doubled versions of those signatures. Signature C has the highest similarity with genome doubled signature A, and signature B has the highest similarity with genome doubled signature C, indicating successive genome doublings leading to transitions of signatures. e) Attribution (blue) of pan-cancer signatures (y-axis) across ploidy-sorted populations of cells (x-axis). Ploidy of the sorted population is shown in red. Genome-doubling association of the pan-cancer signatures is shown in grayscale. f) Summed attribution of genome-doubling classifications of pan-cancer signatures across ploidy-sorted populations of cells. g) WGD calls for TCGA, based on ploidy and the proportion of the genome that is LOH. See Methods for details. WGDx0=non-genome doubled, WGDx1=genome doubled once, WGDx2=twice genome doubled. h) Associations between copy number signature exposure and WGD calls. GDx0=non-genome doubled, GDx1=genome doubled once, GDx2=twice genome doubled. i) Cosine similarities between signatures (CN1-21) and their artificially genome doubled counterparts (GDCN1-21). A high cosine similarity between e.g. CN2 and GDCN1 indicated that CN2 is a genome doubled version of CN1. j) Distributions of total copy number of segments (only TCN1-3, top-left), number of non-diploid segements (top-right), segment length of losses (TCN=1, bottom-left) and segment length of gains (TCN=3, bottom-right) for predominantly diploid (CN1+9>0.8) profiles in TCGA. Orange lines indicate empirical distributions, non-orange lines indicate simulated distributions. Dashed lines indicate components of mixture distributions, or the distribution for non-mixed distributions. Solid blue lines indicate joint distributions. k) Attributions (blue) of the 21 pan-cancer signatures (x-axis) in 6 simulation designs each of 100 samples (y-axis). CIN=random sub-chromosomal copy number gain or loss. WGD=whole genome doubling. l) TSNE representation of all non-artefactual signatures (coloured points). Inferences about the relationships between signatures (Extended Data Fig. 3) are indicated with arrows; WGD=whole-genome doubling, CIN=chromosomal instability. m) CN1 attribution (x-axis) against CN1 attribution × CN2 attribution in samples for which CN1+CN2 attribution = 1. Decision boundary for determining highly aneuploid samples is shown in grey. Orange points are taken for further analysis of aneuploidy. n) CN1 (blue) and CN2 (orange) recurrence (y-axis) across the genome (x-axis) in 472 highly aneuploid samples where CN1+CN2 attribution = 1. Chromosome arms with >50% samples attributed to CN2 are labelled.
Extended Data Fig. 4
Extended Data Fig. 4. Chromothripsis-associated signatures.
a) Associations between copy number signature attribution (y-axis) and rearrangement phenomena (x-axis) described in Hadi et al. (2020). Effect size (log2 odds ratio, colour), and significance level (-log2 Q-value, size) from a Fisher’s exact test are displayed. b) Correlation between copy number signature attributed segments and chromothriptic regions at a genomic level. X-axis=effect size (log odds ratio), y-axis=significance (-log2 Q-value). A half dot indicates an infinite value (Q = 0, or OR=Inf). c) Same as for (a), but correlated against amplified chromothripsis. CN7-8 OR= OR = 2.69 and 10.08 respectively, Q < 0.05. d) Same as for (a), but correlated against distinct chromothripsis types. e) Distributions of the number of segments (left) and segment sizes (right) on chromothriptic chromosomes identified by PCAWG. Orange lines indicate empirical distributions. Blue dashed lines indicate simulation distributions. f) Attributions (blue) of the 21 pan-cancer signatures (x-axis) in 5 simulation designs each of 100 samples (y-axis). Chromo.=chromothripsis. WGD=whole genome doubling. Amp=single gain of the derivative chromothriptic chromosome.
Extended Data Fig. 5
Extended Data Fig. 5. Survival associations.
a) Kaplan-Meier curves of disease specific survival for patients whose tumours are amplicon signature (CN4:8) attributed (orange) and non-attributed (blue). b) Cox-model hazard ratios (x-axis) for copy number signatures (y-axis) with copy number signature attribution and tumour type as a covariates (see Extended Data Fig. 5e). Horizontal bars indicate 95% confidence intervals. Sample sizes are given in Supplementary Table 5. c) Cox-model hazard ratios (x-axis) for tumour types (y-axis) with copy number signature attribution (see Extended Data Fig. 5d) and tumour type as covariates. Horizontal bars indicate 95% confidence intervals. ACC is taken as the reference tumour type (square point). d) Accelerated failure time deceleration factors (x-axis) for copy number signatures (y-axis) with copy number signature attribution and tumour type as a covariates (see Extended Data Fig. 5c). A log(deceleration factor)<1 indicates reduced survival time (accelerated failure time), while a log(deceleration factor)>1 indicates increased survival time (deaccelerated failure time). Horizontal bars indicate 95% confidence intervals. Sample sizes are given in Supplementary Table 5. e) Accelerated failure time deceleration factors (x-axis) for tumour types (y-axis) with copy number signature attribution (see Extended Data Fig. 5b) and tumour type as covariates. A log(deceleration factor)<1 indicates reduced survival time (accelerated failure time), while a log(deceleration factor)>1 indicates increased survival time (deaccelerated failure time). Horizontal bars indicate 95% confidence intervals. ACC is taken as the reference tumour type (square point). f) Kaplan-Meier curves for within-tumour type associations with copy number signature attribution. Tumour type/copy number signature combinations with a significant effect on survival (Q < 0.05) are displayed.
Extended Data Fig. 6
Extended Data Fig. 6. LOH associated signatures.
a) Association between LOH segments and mapped copy number signature segments across the full TCGA cohort. b) Recurrence of mapped LOH signatures (y-axis) across the genome in 1Mb bins (x-axis), split by LOH (blue) or heterozygous (orange) segments. Tumour suppressor genes with >20% of samples with LOH signatures are labelled. c) FACS sorting of undifferentiated sarcoma cells. Cells were gated on DAPI staining intensity (x-axis, proxy for DNA content), and ki67 intensity (y-axis, indicating replicating cells). Gates were chosen to isolate population of near haploid cells (~1n, green), replicating and non- replicating ~2n populations of cells (orange and purple respectively) and a ~4n population of cells (blue). d) Prevalence (orange line) and distribution (violins) of CN14 attributions across TCGA cancer types. Blue violins are cancer types significantly enriched in CN14 compared to all others (Q < 0.05, Mann Whitney test). KICH enrichment: OR = 4.6, P = 3.0e-3, Fisher’s exact test. ACC enrichment: OR = 8.9, P = 6.3e-9, Fisher’s exact test. e) Prevalence (orange line) and distribution (violins) of CN16 attributions across TCGA cancer types. Blue violins are cancer types significantly enriched in CN21 compared to all others (Q < 0.05, Mann Whitney test). KICH enrichment: OR = 30.5, P = 1.0e-21, Fisher’s exact test. ACC enrichment: OR = 37.4, P = 3.5e- 33, Fisher’s exact test. f) Recurrence of mapped arm-level LOH signatures (y-axis) across the genome in 1Mb bins (x-axis), split by LOH (blue) or heterozygous (orange) segments. Chromsome arms with >50% of samples with LOH signatures are labelled. g) Left: Heatmap of LOH prevalence by chromosome (x-axis) and sample (y-axis) for all CN13-CN16 attributed ACC, KICH or MESO samples. Samples are clustered according to chromosomal LOH levels. Right: Copy number signature attributions for the same samples. h) Recurrence of mapped chromosomal-scale and focal LOH signatures (y-axis) across the genome in 1Mb bins (x-axis), split by LOH (blue) or heterozygous (orange) segments. Chromosome arms with >20% of samples with LOH signatures are labelled. i) Enrichment of essential genes in regions of the genome with >20% of the samples having heterozygous segments of cLOH or fLOH signatures through bootstrapping of genomic regions.
Extended Data Fig. 7
Extended Data Fig. 7. Signature of homologous recombination deficiency.
a) Associations between copy number signature attributed samples and tandem-duplicator phenotype samples, displaying -log2(Q-values) (y-axis) and log2 odds ratios (x-axis). CN17 association: OR = 6.3, Q = 3.6e-17, Fisher’s exact test. b) Prevalence (orange line) and distribution (violins) of CN17 attributions across TCGA cancer types. Blue violins are cancer types significantly enriched in CN17 compared to all others (Q < 0.05, Mann Whitney test). Points indicate the prevalence of TDP in given tumour types from the literature (Menghi et al., 2018) coloured by over- (green) or underrepresentation (gray). A half dot indicates an infinite value. c) Correlation of CN17 attribution (y-axis) with mutational status of one or more genes of the homologous recombination pathway (x-axis) in breast cancer (top, n = 589), ovarian cancer (middle, n = 309) or pan-cancer (bottom, n = 4,919). WT=wild type. Mono = Mono-allelic and Bi = bi-allelic. Two-sided Fisher’s exact test: Q-values are given above, n.s.=Q ≥ 0.05. d) Relationship between BRCA1 gene expression (x-axis) and promoter methylation (y-axis). A mean TSS1500 beta cutoff of 0.7 was chosen to indicate promoter hyper-methylation, correlating with gene silencing. e) CN17 attribution (y-axis) split by BRCA1 mutational status (x-axis) in TCGA breast cancers. WT=wild type (n = 220), Mono.=mono-allelic mutation (n = 148), Bi.=bi-allelic mutation (n = 19), Methy.=promoter hypermethylation (n = 13). Two-sided Mann-Whitney test: P-values are given above, n.s.=P ≥ 0.05. f) Association between copy number signature attribution and promoter hypermethylation of BRCA1 (beta > 0.7), displaying -log2(Q-values) (y-axis) and log2 odds ratios (x-axis) from a multivariate logistic regression model with cancer type as a covariate. g) Association between copy number signature attribution and scarHRD score, displaying -log2(Q-values) (y-axis) and log2 odds ratios (x-axis) from a Fisher’s exact test where scarHRD positivity was thresholded at >63. A half dot indicates an infinite value. h) Association between copy number signature attribution and scarHRD score, displaying -log2(Q-values) (y-axis) and difference in mean scarHRD scores (x-axis) from a Mann-Whitney test on continuous scarHRD scores. A half dot indicates an infinite value. i) Pearson’s correlation of recurrence of mapping of LOH segments of CN17 to the genome calculated for all pairwise comparisons of CN17-enriched tumour types. j) Pearson’s correlation of recurrence of mapping of CN17 to the genome from pairwise comparisons of CN17 enriched tumour types for heterozygous segments. k) Recurrence of mapped CN17 in 1 Mb windows of the human genome in all CN17 attributed BRCA, OV and UCS samples, split by LOH (blue) and heterozygous segments (orange). Tumour-suppressor genes in regions with >20% samples attributed to CN17 with LOH segments are labelled. l) Recurrence of mapped CN17 in 1 Mb windows of the human genome in all CN17 attributed SARC samples, split by LOH (blue) and heterozygous segments (orange). Tumour-suppressor genes in regions with >20% samples attributed to CN17 with LOH segments are labelled. m) Recurrence of mapped CN17 in 1 Mb windows of the human genome in all CN17 attributed STAD, LUAD, BLCA, HNSC, ESCA and LUSC samples, split by LOH (blue) and heterozygous segments (orange). Tumour-suppressor genes in regions with >20% samples attributed to CN17 with LOH segments are labelled. n) Association between copy number signature (y-axis) attribution and hypoxia score (x-axis=effect size) in a two-sided multivariate logistic regression model including cancer type as a covariate. Vertical bars indicate effect estimates, horizontal bars indicate 95% confidence intervals. P-values for significant associations (P < 0.05) are given (non-significant values can be found in Supplementary Table 7). n = 6,805 biologically independent tumours.
Extended Data Fig. 8
Extended Data Fig. 8. Genomic and clinical correlates.
a) Correlation between Shannon’s diversity index of signature proportions in samples, and driver gene mutation status. Effect size (log2 odds ratio, y-axis) and significance (-log2 Q-value, y-axis) are displayed. Driver genes with |log2(OR)|>1 and Q < 0.05 are labelled. TP53 association: OR = 3.65, Q = 3.0e- 51. b) Pan-cancer copy number signature attribution in 36 TP53 mutant RPE1 single cell sequenced cells (Mardin et al., 2020). Left: input profile summaries (red). Right: copy number signature attribution (blue). c) Heatmaps of copy number signatures identified across the spectrum of Li-Fraumeni Syndrome (LFS) associated cancers and somatic TP53 mutant cancers. Colour indicates the strength of signature attribution. Somatic=somatic TP53 mutant cancers, LFS=germline TP53 mutant cancers. d) Heatmap of copy number signature attribution (left) and driver gene mutation status (right) for all COAD samples, split by microsatellite instability status. Driver gene mutations are coloured orange or blue for genes that are positively (OR > 1, Q < 0.05) or negatively (OR < 1, Q < 0.05) associated with MSI status respectively, and grey for genes that are not associated with MSI status (q≥0.05). Association between CN1 or CN2 and MSI status: OR = 1.8 and 0.21, P = 0.03 and 7.7e-9 respectively, Fisher’s exact test. e) Correlations between leukocyte fraction (y-axis, split by median value per tumour type) and copy number signature attribution (x-axis). Effect size given as log2(OR) (colour) and significance given as Q-values (size) are displayed. Only associations with |log2(OR)|>1 and Q < 0.05 are shown. Associations were tested with a logistic regression model with leukocyte fraction as the dependent variable and tumour purity and copy number signature attribution (binarized) as independent variables (purity associations not shown). f) Heatmap of copy number signature attribution (left) and driver gene mutation status (right) for all UCEC samples, split by microsatellite instability status. Driver gene mutations are coloured orange or blue for genes that are positively (OR > 1, Q < 0.05) or negatively (OR < 1, Q < 0.05) associated with MSI status respectively, and grey for genes that are not associated with MSI status (q≥0.05). Association between CN1 or CN2 and MSI status: OR = 0.17 and 2.6, P = 1.1e-10 and 7.0e-4 respectively, Fisher’s exact test. g) Association between HPV status and copy number signature attribution. X-axis=effect size (log odds ratio), y-axis=significance (-log2 Q-value). Fisher’s exact test. A half dot indicates an infinite value. h) Association between hypoxia score (y-axis) and HPV status (x-axis). Two-sided Mann-Whitney test. n = 259 biologically independent tumour samples. i) Associations between copy number signatures (x-axis) and driver gene copy number alteration status (y-axis, amplification for oncogenes, homozygous deletion for tumour-suppressor genes) across each TCGA tumour type (panels). Effect size (log2 odds ratio, colour), and significance level (-log2 Q-value, size) from a Fisher’s exact test are displayed. j) Associations between copy number signatures and TCGA Asian ethnicity, using TCGA White ethnicity as a reference. k) Associations between copy number signatures and TCGA Black ethnicity, using TCGA White ethnicity as a reference. l) Correlation between copy number signature (x-axis) attribution and sex (left), smoking status (middle) and drinking status (right) across TCGA samples. Strength of correlation is indicated by colour (orange=anti-correlated, blue=correlated), Q-value is indicated by size of point. m) Association between copy number signatures (y-axis) and median dichotomised age at diagnosis for individual cancer types (x-axis). Strength of correlation is indicated by colour (orange=negatively associated, blue=positively associated), Q-value is indicated by size of point. Only tumour types/copy number signature combinations with a significant (Q < 0.05) association with age at diagnosis are shown.

Comment in

  • Copy-number classifiers for cancer.
    Burgess DJ. Burgess DJ. Nat Rev Genet. 2022 Aug;23(8):457. doi: 10.1038/s41576-022-00516-2. Nat Rev Genet. 2022. PMID: 35764797 No abstract available.

References

    1. Sansregret L, Swanton C. The role of aneuploidy in cancer evolution. Cold Spring Harb. Perspect. Med. 2017;7:a028373. doi: 10.1101/cshperspect.a028373. - DOI - PMC - PubMed
    1. Levine MS, Holland AJ. The impact of mitotic errors on cell proliferation and tumorigenesis. Genes Dev. 2018;32:620–638. doi: 10.1101/gad.314351.118. - DOI - PMC - PubMed
    1. Beroukhim R, et al. The landscape of somatic copy-number alteration across human cancers. Nature. 2010;463:899–905. doi: 10.1038/nature08822. - DOI - PMC - PubMed
    1. Davoli T, Uno H, Wooten EC, Elledge SJ. Tumor aneuploidy correlates with markers of immune evasion and with reduced response to immunotherapy. Science. 2017;355:eaaf8399. doi: 10.1126/science.aaf8399. - DOI - PMC - PubMed
    1. Taylor AM, et al. Genomic and functional approaches to understanding cancer aneuploidy. Cancer Cell. 2018;33:676–689.e3. doi: 10.1016/j.ccell.2018.03.007. - DOI - PMC - PubMed