. 2022 Jun;606(7915):785-790.
doi: 10.1038/s41586-022-04828-5. Epub 2022 Jun 15.

An exercise-inducible metabolite that suppresses feeding and obesity

Affiliations

An exercise-inducible metabolite that suppresses feeding and obesity

Veronica L Li et al. Nature. 2022 Jun.

Abstract

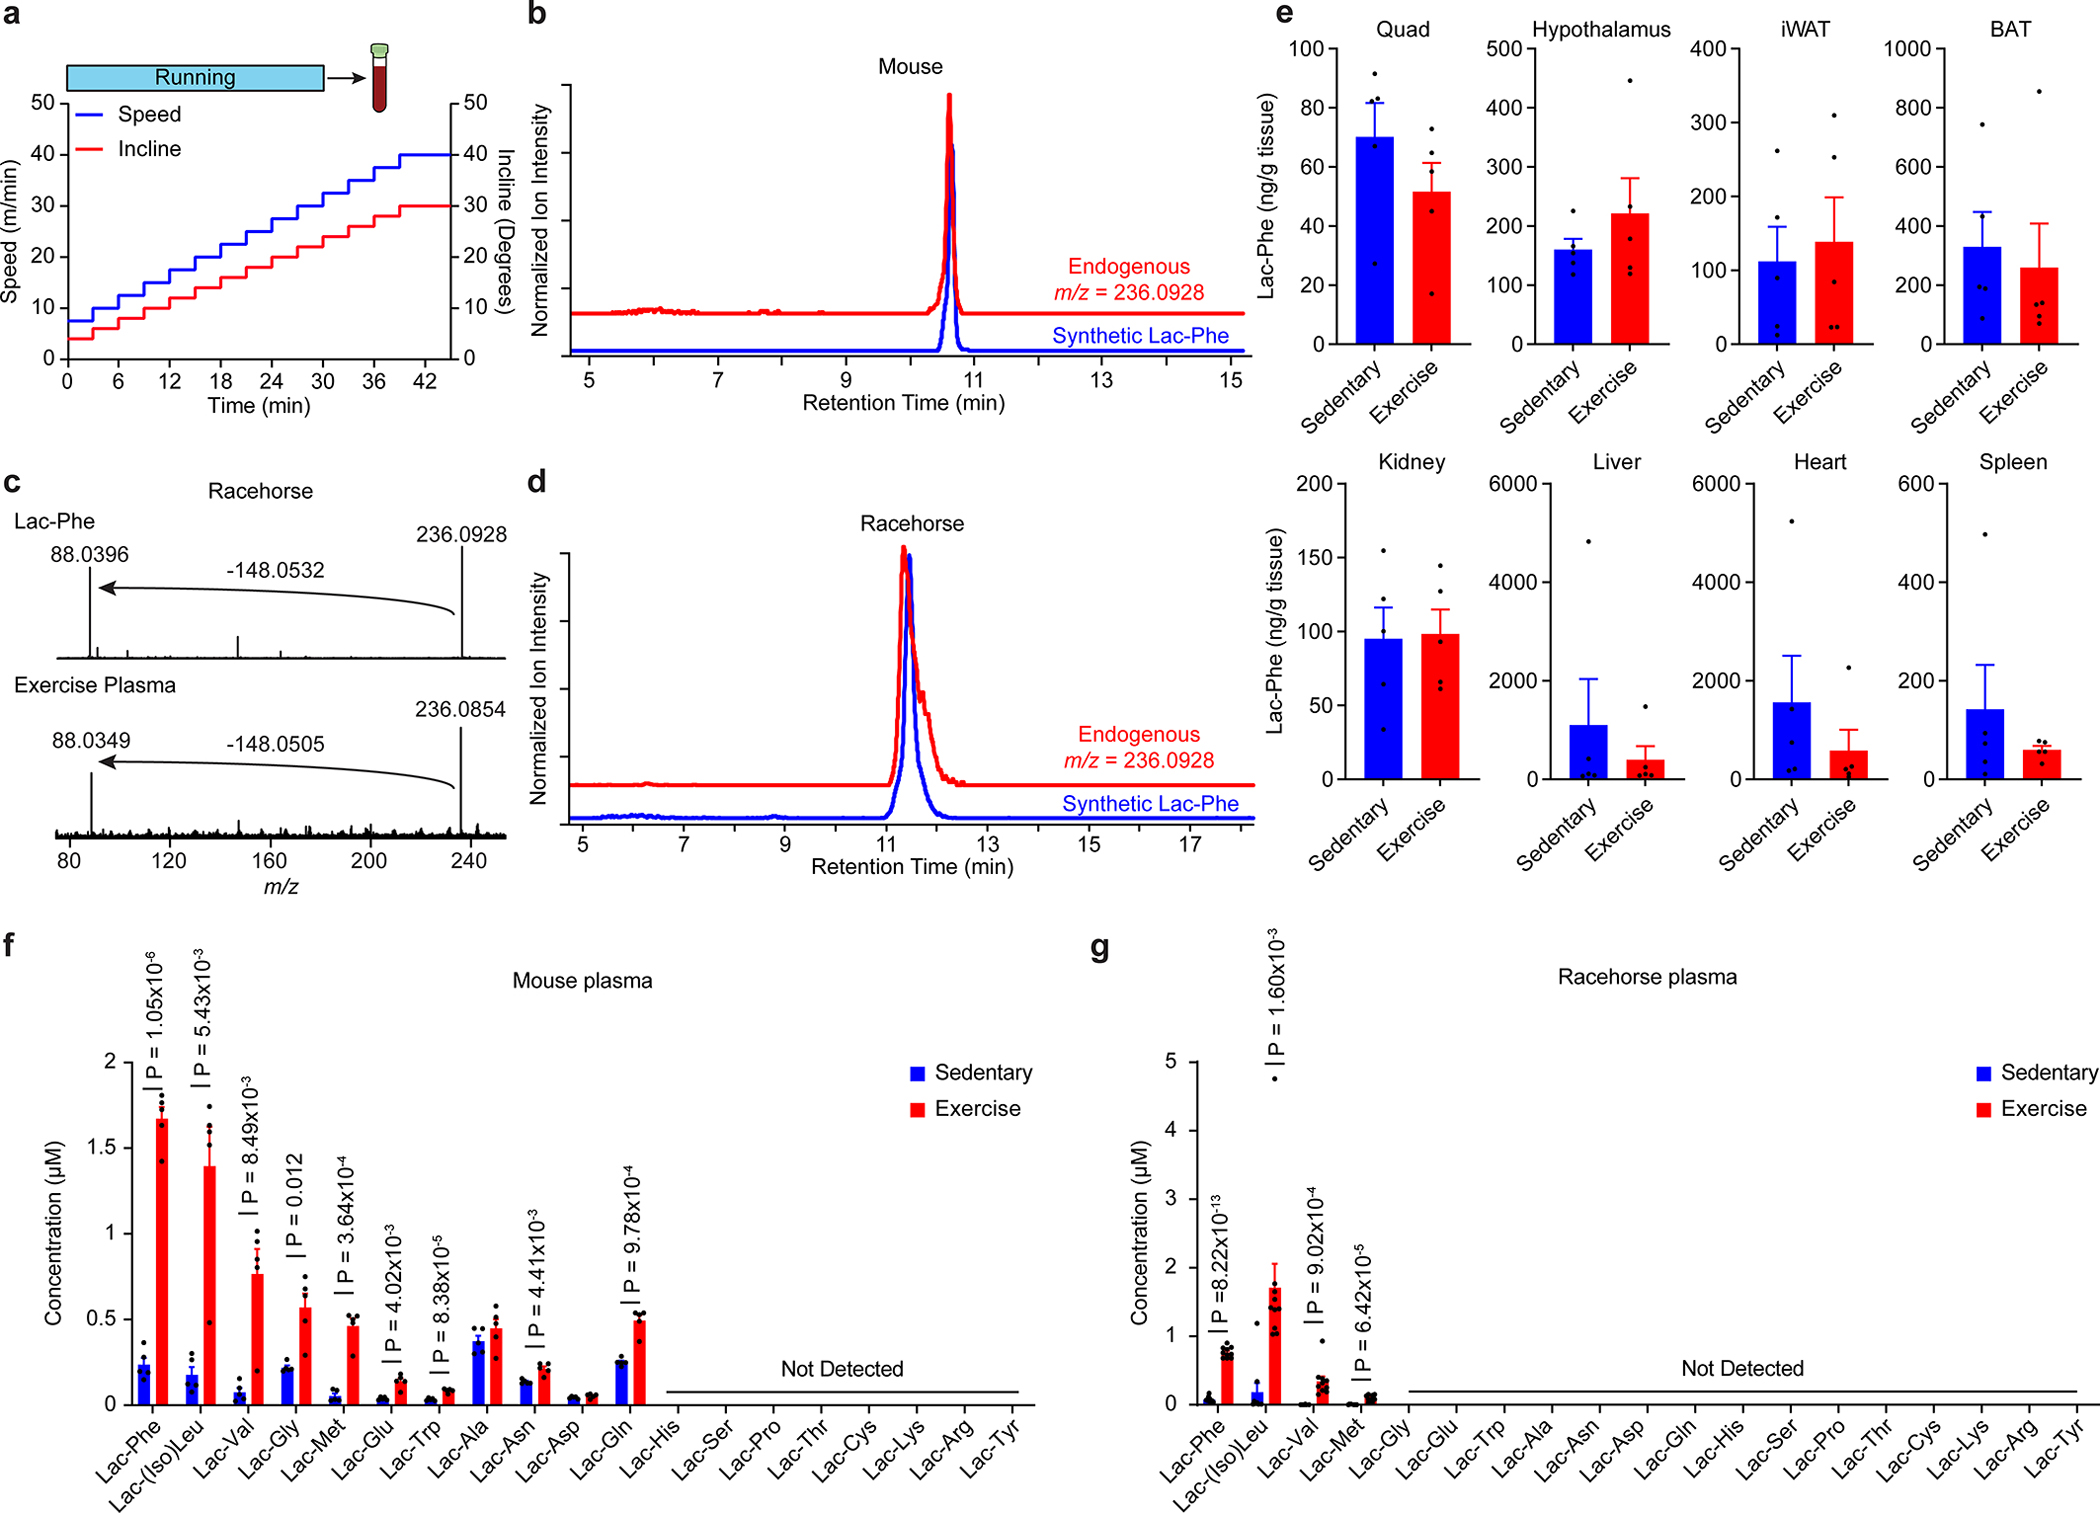
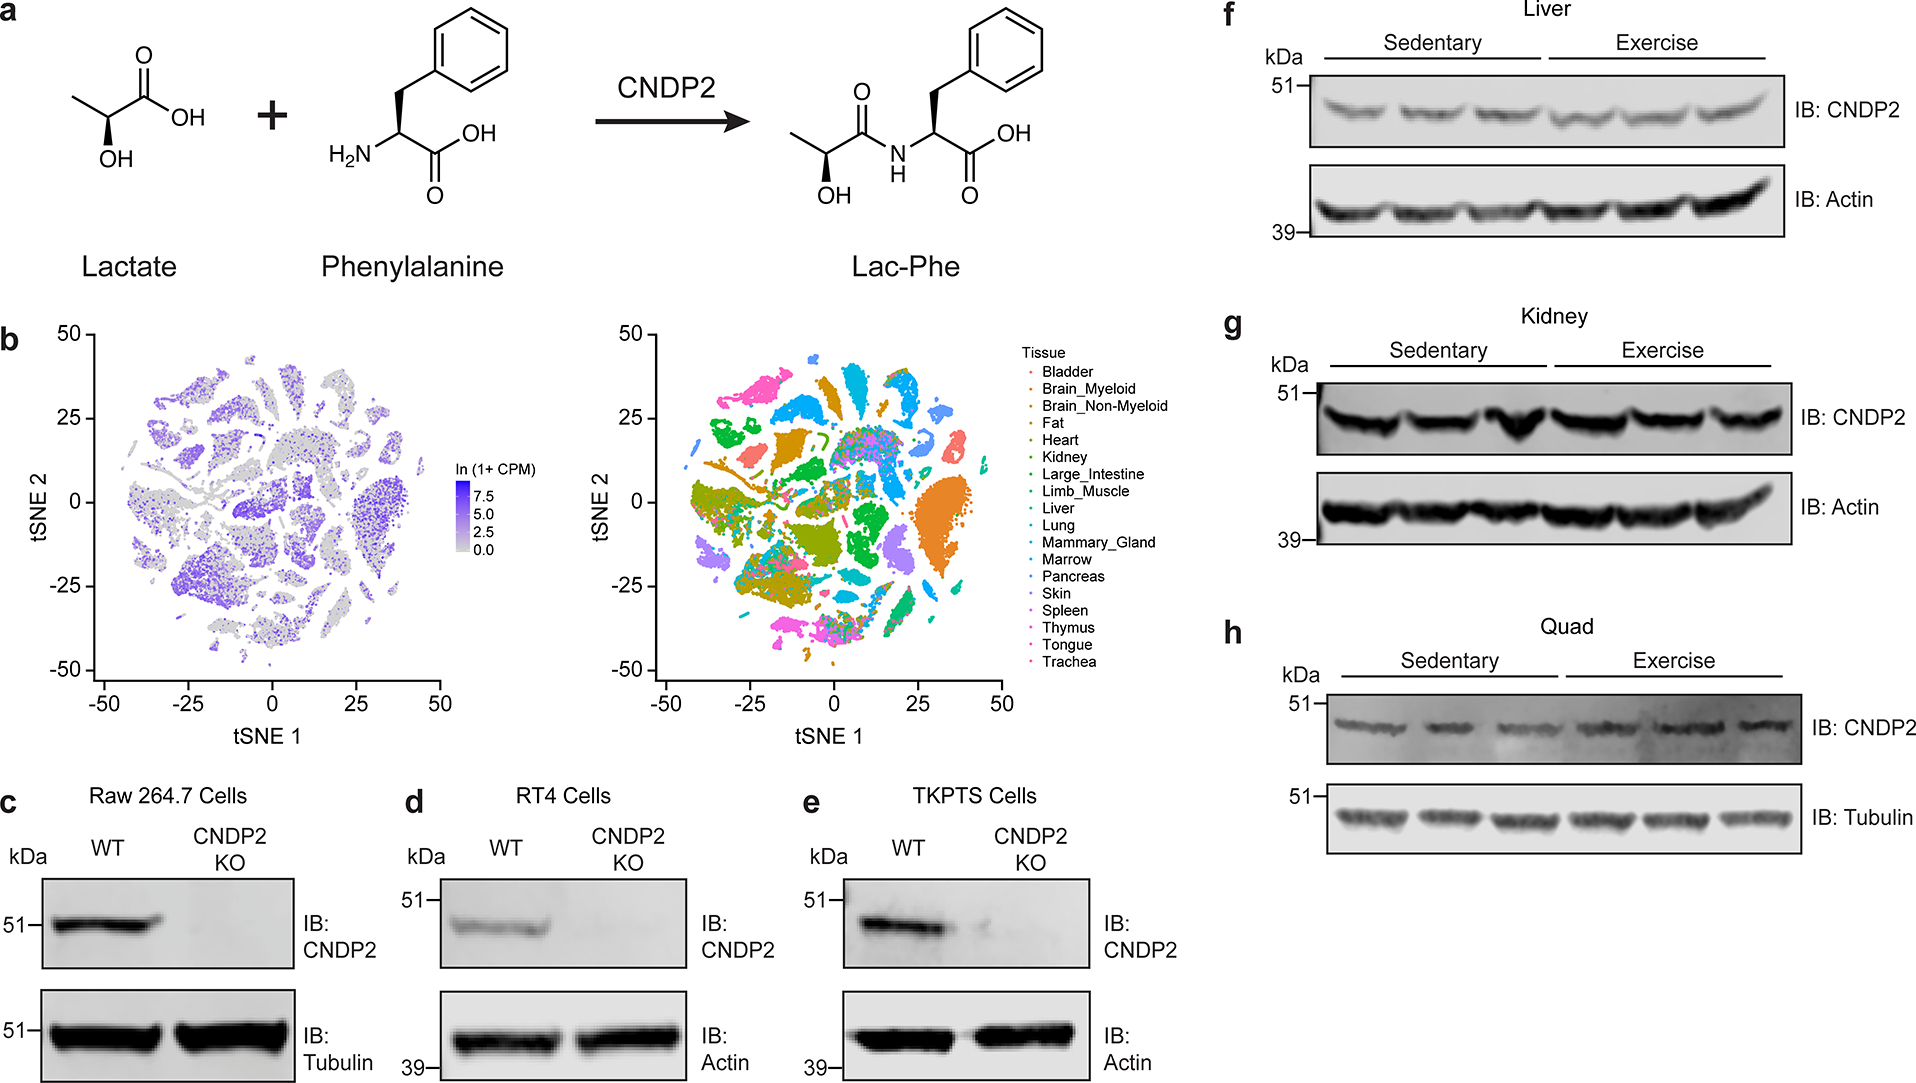
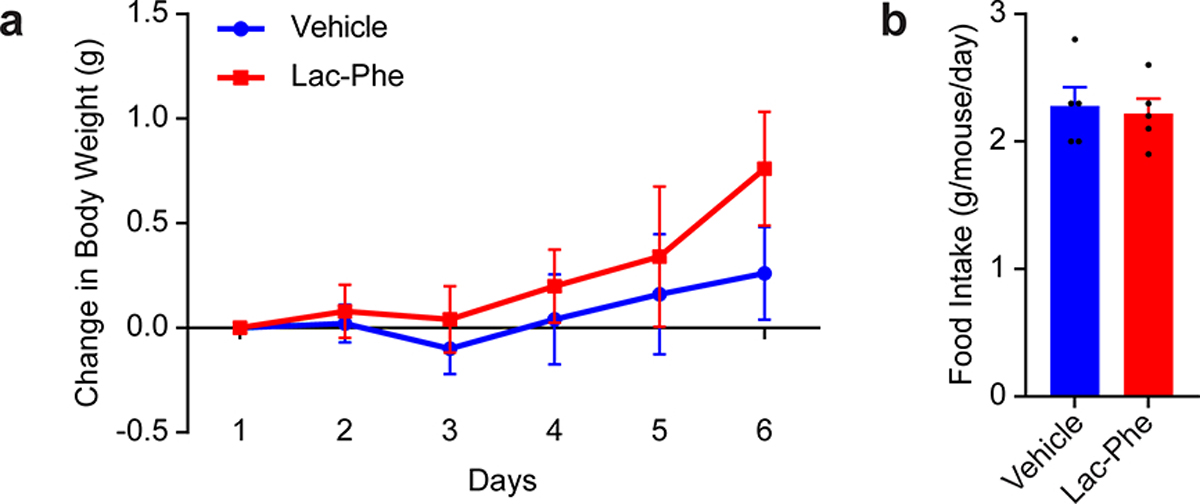
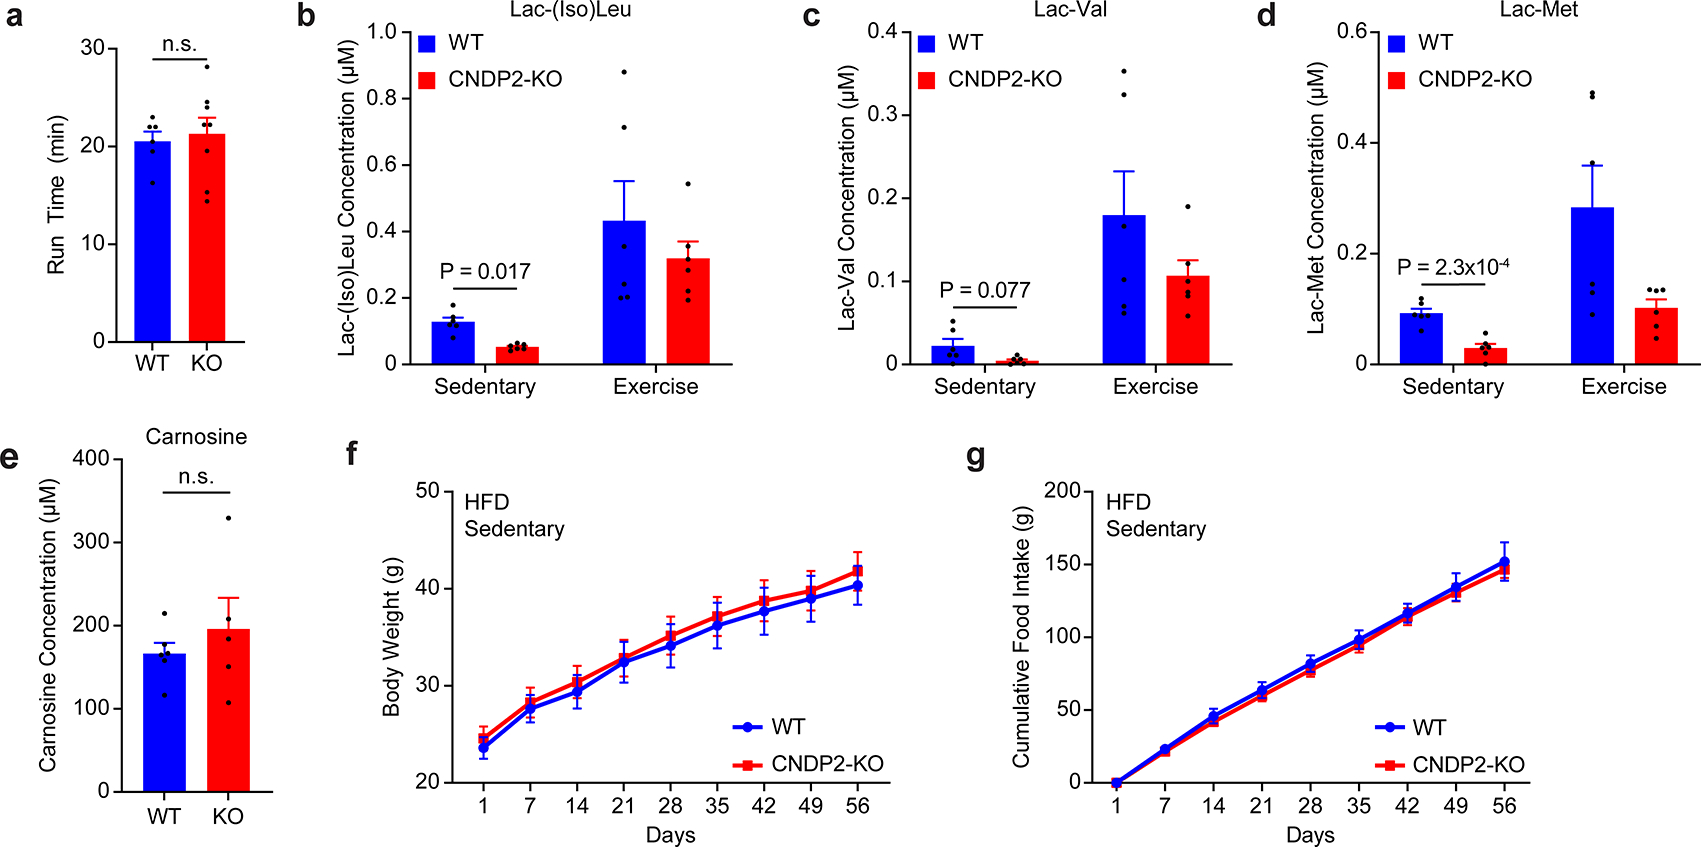
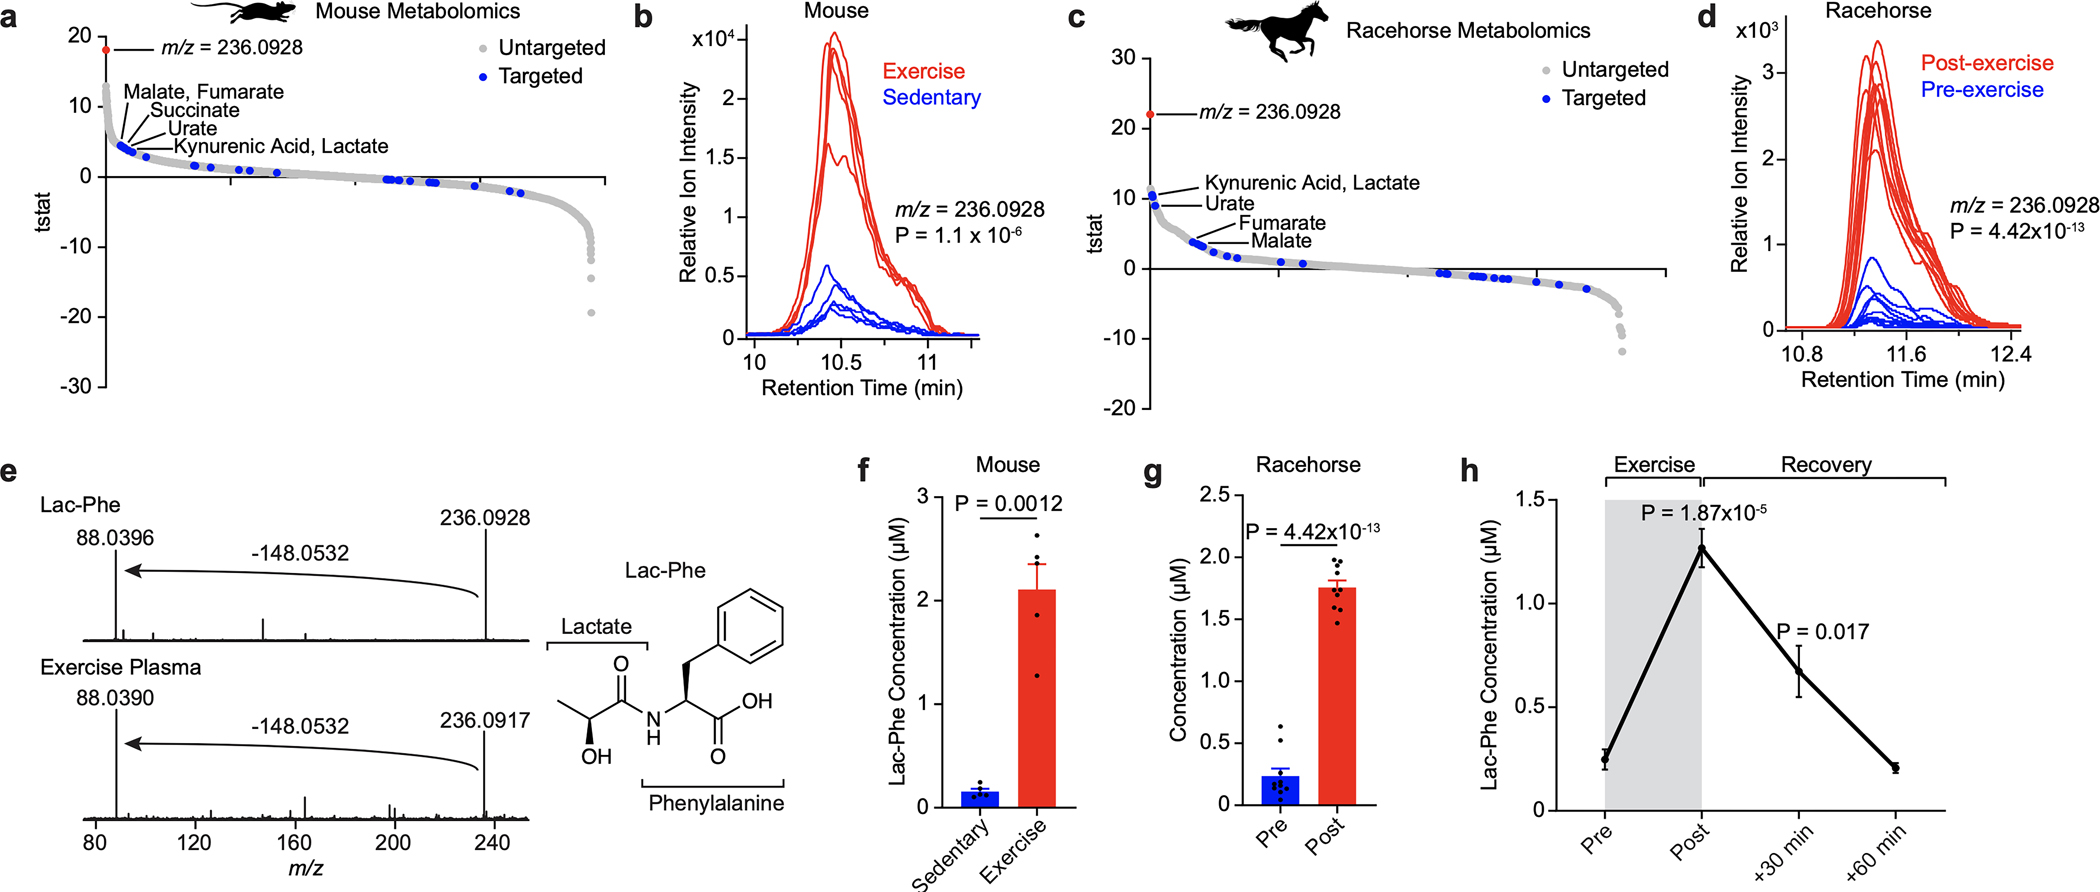
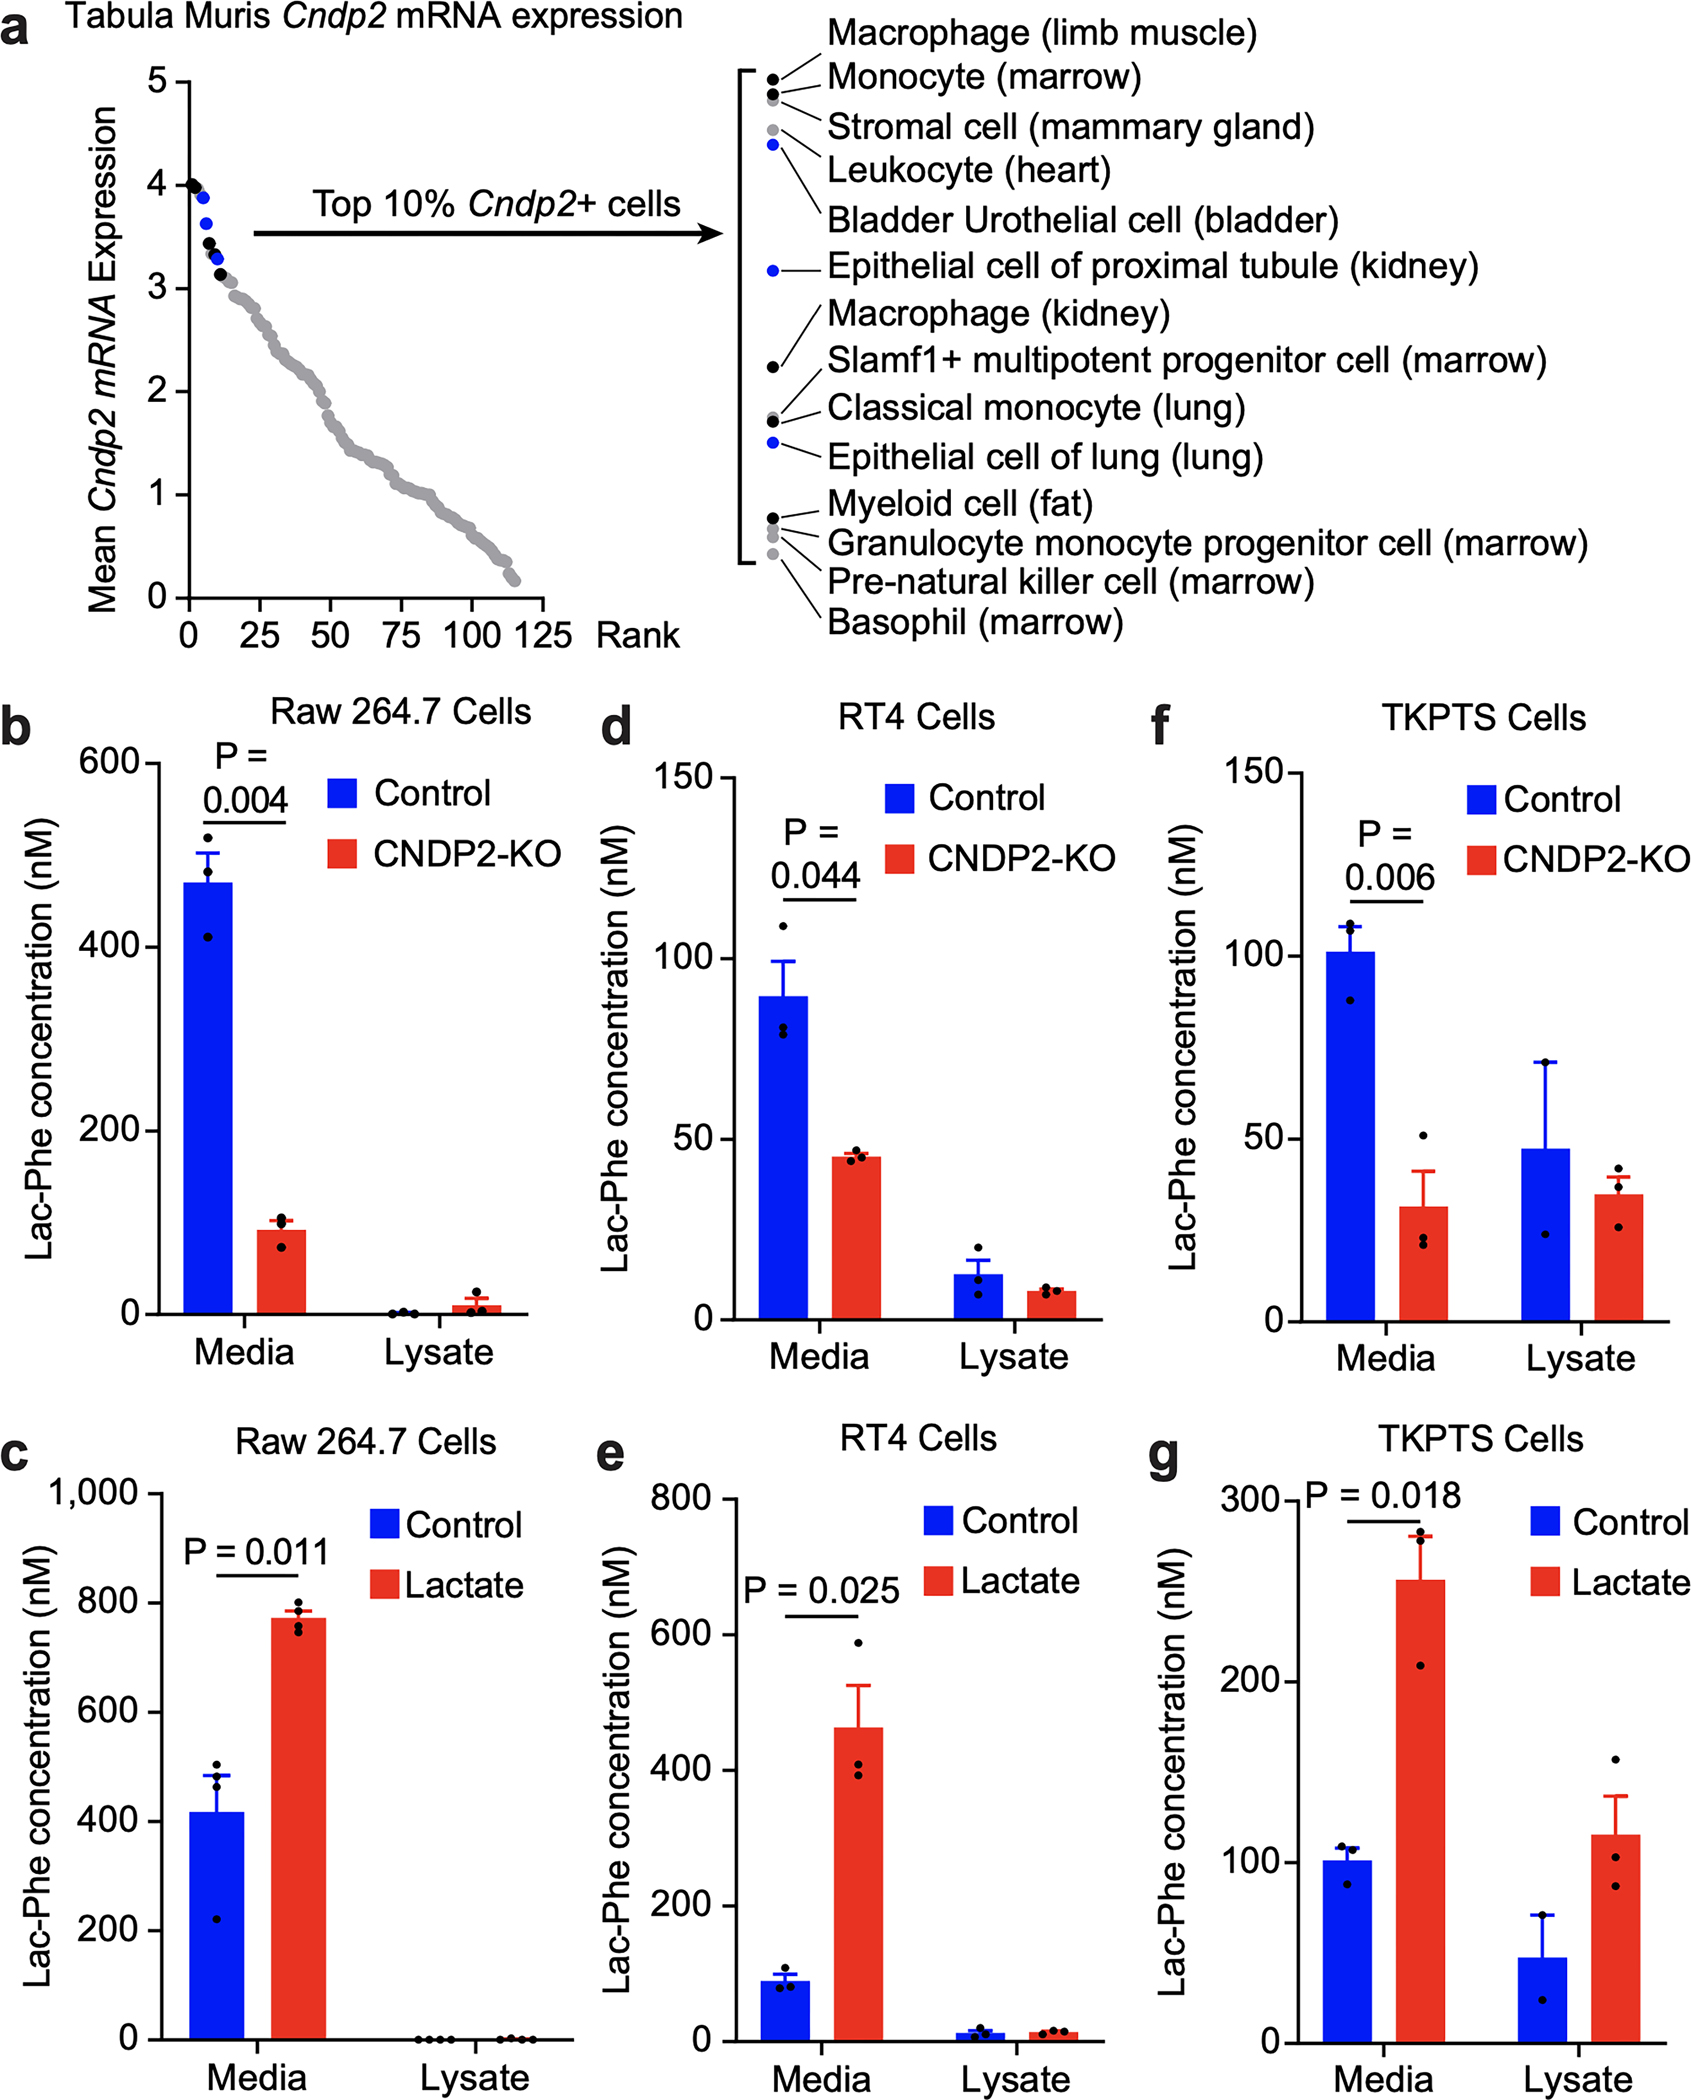
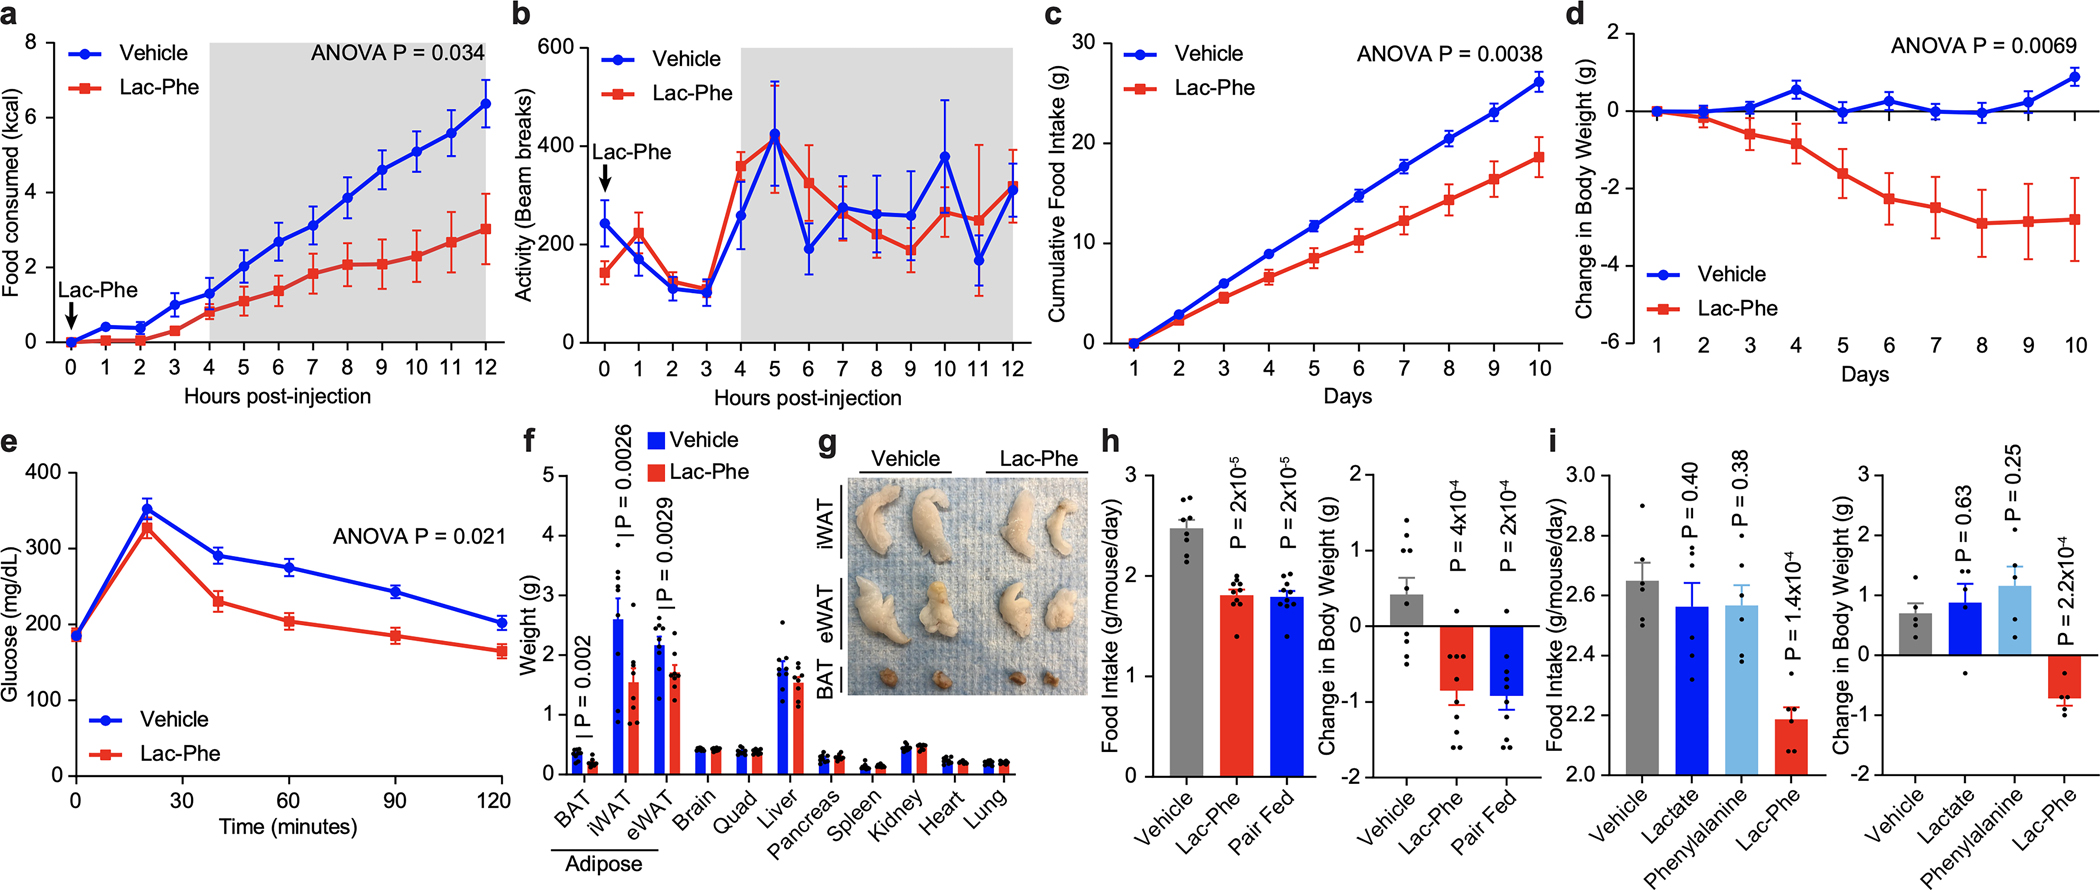
Exercise confers protection against obesity, type 2 diabetes and other cardiometabolic diseases1-5. However, the molecular and cellular mechanisms that mediate the metabolic benefits of physical activity remain unclear6. Here we show that exercise stimulates the production of N-lactoyl-phenylalanine (Lac-Phe), a blood-borne signalling metabolite that suppresses feeding and obesity. The biosynthesis of Lac-Phe from lactate and phenylalanine occurs in CNDP2+ cells, including macrophages, monocytes and other immune and epithelial cells localized to diverse organs. In diet-induced obese mice, pharmacological-mediated increases in Lac-Phe reduces food intake without affecting movement or energy expenditure. Chronic administration of Lac-Phe decreases adiposity and body weight and improves glucose homeostasis. Conversely, genetic ablation of Lac-Phe biosynthesis in mice increases food intake and obesity following exercise training. Last, large activity-inducible increases in circulating Lac-Phe are also observed in humans and racehorses, establishing this metabolite as a molecular effector associated with physical activity across multiple activity modalities and mammalian species. These data define a conserved exercise-inducible metabolite that controls food intake and influences systemic energy balance.


Conflict of interest statement

Competing interest declaration

The authors declare the following competing interests: a provisional patent application has been filed by Stanford University on lactoyl amino acids for the treatment of metabolic disease.

Figures

Extended Data Fig. 1.
Extended Data Fig. 1.. Additional metabolomic characterization of Lac-Phe and lactoyl amino acid dynamics in mouse and thoroughbred racehorse exercise.
(a) Schematic of speed and incline in the acute running protocol for mice. (b) Extracted ion chromatograms the endogenous m/z = 236.0928 peak in mouse plasma in comparison with a synthetic Lac-Phe standard. (c,d) Fragmentation spectra (c) extracted ion chromatogram (d) of the the endogenous m/z = 236.0928 peak in horse plasma in comparison with a synthetic Lac-Phe standard. (e) Quantitation of Lac-Phe levels in the indicated tissue from either sedentary mice (blue) or after a single bout of exhaustive running (red). (f,g) Quantitation of the indicated lactoyl amino acid level in blood plasma from mouse (f) or racehorse (g). For (e) and (f), N = 5/group; for (g), N=10/group. Data are shown as mean ± SEM. All experiments were performed once. P-values were calculated by Student’s two-sided t-test.
Extended Data Fig. 2.
Extended Data Fig. 2.. Additional characterization and validation of CNDP2 protein in cells and in mice.
(a) Schematic of the chemical reaction catalyzed by CNDP2 to produce Lac-Phe. (b) Cndp2 mRNA expression across tissues from Tabula Muris. (c-e) Anti-CNDP2 (top) and anti-tubulin (bottom) Western blots in WT and CNDP2-KO RAW264.7 (c), RT4 (d), or TKPTS (e) cells. (f-h) Anti-CNDP2 (top) and anti-actin (bottom) Western blots of liver (f), kidney (g), or quadraceps (h) harvested from either sedentary mice (left three lanes) or mice after a single bout of exhaustive exercise (right three lanes). For gel source data, see Supplementary Figure 1. For (c), experiments were performed twice. For (d-h), experiments were performed once.
Extended Data Fig. 3.
Extended Data Fig. 3.. Additional characterization of the effects of Lac-Phe administration to diet-induced obese mice.
(a,b) Phenotype associations of the single nucleotide polymorphisms rs373836366 (a) and rs780772968 (b) from the Type 2 Diabetes Knowledge Portal. (c,d) Plasma Lac-Phe levels (c) and blood lactate levels (d) in plasma of mice following a single injection of Lac-Phe (50 mg/kg, IP). (e-g) 12 hr oxygen consumption VO2 (e), carbon dioxide production VCO2 (f), and respiratory exchange ratio RER (g) of 22-week old DIO mice following a single injection of vehicle or Lac-Phe (50 mg/kg, IP). (h-j) Food intake (h), kaolin intake (i), and water intake (j) in 21-week old DIO mice following a single injection of vehicle or Lac-Phe (50 mg/kg, IP). (k,l) Plasma leptin (k) and acyl-ghrelin (l) levels in 17-week old DIO mice 30 min after a single injection of vehicle or Lac-Phe (50 mg/kg, IP). For (c), (d), (k), and (l), N=3/group. For (e-j), N=7/group. Data are shown as means ± SEM. All experiments were performed once. P-values were calculated by Student’s two-sided t-test.
Extended Data Fig. 4.
Extended Data Fig. 4.. Metabolic effects of Lac-Phe administration to chow-fed, lean mice.
(a) Lac-Phe levels in plasma of male lean mice (22–27 g) following a single injection of Lac-Phe (50 mg/kg, IP). (b-f) 12 h food consumption (b), ambulatory activity (c), oxygen consumption VO2 (d), carbon dioxide production VCO2 (e), and respiratory exchange ratio RER (f) of chow fed lean mice following a single injection of Lac-Phe (50 mg/kg, IP). (g) 24 h food intake in lean mice after a single injection of Lac-Phe at the indicated dose. For (a), N=3/group. For (b-f), N=8/group. For (g), N=5/group. Data are shown as means ± SEM. For (a-f), experiments were performed once. For (g), experiments were performed two times. P-values were calculated by Student’s two-sided t-test.
Extended Data Fig. 5.
Extended Data Fig. 5.. Metabolic effects of oral Lac-Phe administration to diet-induced obese mice.
(a,b) Change in body weight (a) and daily food intake (b) of 16-week diet-induced obese mice treated with Lac-Phe (50 mg/kg/day, PO). N=5/group. Data are shown as means ± SEM. Experiments were performed once.
Extended Data Fig. 6.
Extended Data Fig. 6.. Additional characterization of CNDP2-KO mice.
(a) Treadmill time until exhaustion for WT and CNDP2-KO (“KO”) mice. (b-d) Plasma levels of the indicated lactoyl amino acid in WT or CNDP2-KO mice in the sedentary state or after a single bout of acute exhaustive running (“exercise”). (e) Plasma levels of carnosine in sedentary WT or CNDP2-KO mice. (f,g) Body weight (f) and cumulative daily food intake (g) of WT (blue) or CNDP2-KO (red) mice under high fat diet, sedentary conditions. For (a), N=6 for WT and N=8 for CNDP2-KO; for (b-d), N=6/group; for (e), N=6 for WT and N=5 for CNDP2-KO; for (f,g), N=8 for WT and N=11 for CNDP2-KO. Data are shown as means ± SEM. For (a-g), experiments were performed once. P-values for (a-e) were calculated by Student’s two-sided t-test.
Extended Data Fig. 7.
Extended Data Fig. 7.. Plasma Lac-Phe levels in WT and ABCC5-KO mice sedentary mice or after a single bout of treadmill running to exhaustion.
N=3/group. Data are shown as means ± SEM. Experiments were performed once. P-values were calculated by Student’s two-sided t-test.
Extended Data Fig. 8.
Extended Data Fig. 8.. Additional characterization of plasma Lac-Phe levels in humans.
(a,b) Tandem MS fragmentation (a) and co-elution (b) of an authentic Lac-Phe standard and the endogenous m/z = 236.0928 mass from human plasma run on the Snyder laboratory untargeted metabolomics platform (see Methods). (c) Time course of phenylalanine levels in blood before and after a single acute bout of treadmill running from the human acute treadmill exercise study (Cohort 1, N=36). (d) Time course of lactate levels before and after sprint (red), resistance (blue), and endurance (light blue) exercise from the human crossover acute exercise study (Cohort 2, N=8). For (c,d), data are shown as mean ± SEM, **p < 0.01, ***p < 0.001. Experiments were performed once. P-values were calculated by two-way ANOVA with repeated measures.
Fig. 1.
Fig. 1.. Lac-Phe is robustly induced in blood plasma after a single bout of running in mice and racehorses.
(a-d) T-statistic of all blood plasma peaks detected by targeted (blue circles) or untargeted (grey circles) metabolomics in post-run versus control mice (a) and racehorses (c), and extracted ion chromatogram of the top m/z = 236.0928 mass in mice (b) and racehorses (d). (e) Tandem MS fragmentation (left) and structural assignment (right) of an authentic Lac-Phe standard (top) and endogenous m/z = 236.0928 mass (bottom) from mouse plasma. (f,g) Absolute quantitation of Lac-Phe in mouse (f) or racehorse (g) plasma. (h) Time course of Lac-Phe in blood plasma after a single bout of exhaustion running in mice. For (a), (b), and (f), N=5/group. For (c), (d), and (g), N=10/group. Data are shown as means ± SEM. The experiments in (a-e) were performed once; the experiments in (f-g) were performed three times; and the experiments in (h) were performed two times. P-values were calculated by Student’s two-sided t-test.
Fig. 2.
Fig. 2.. CNDP2- and lactate-dependent production and secretion of Lac-Phe in vitro.
(a) Mean Cndp2 mRNA expression across mouse cells and tissues from Tabula Muris. Highlighted black dots, monocytes/macrophages; highlighted blue dots, epithelial cells. (b-g) Lac-Phe levels in conditioned media and cell lysate of WT and CNDP2-KO RAW264.7 macrophage cells (b,c), RT4 bladder epithelial cells (d,e), or TKPTS kidney epithelial cells (f,g) under the indicated condition. Lactate-treated cells were supplemented with 25 mM lactate for 24 h. For (b-i) N=3/group. Data are shown as means ± SEM. The experiments shown in (b) was performed three times and the experiments in (c-g) were performed once. P-values were calculated by Student’s two-sided t-test.
Fig. 3.
Fig. 3.. Lac-Phe suppresses food intake and obesity and improves glucose homeostasis.
(a,b) Cumulative food intake (a) and ambulatory activity (b) of 22-week male DIO mice following injection of either vehicle (blue) or Lac-Phe (red, 50 mg/kg, intraperitoneal [IP]). (c,d) Cumulative food intake (c) and change in body weight (d) of 22-week male DIO mice treated daily with vehicle (blue) or Lac-Phe (red, 50 mg/kg/day, IP). (e) Glucose tolerance test (1 g/kg glucose) of vehicle- or Lac-Phe treated mice. This assay was performed after a 6 h fast one day following the last Lac-Phe dose on day 10. (f-g) Tissue weights (f) and representative images of adipose tissues (g) from mice after 10 days of vehicle or Lac-Phe treatment. iWAT, inguinal white adipose tissue; eWAT, epididymal white adipose tissue; BAT, brown adipose tissue. (h) Average daily food intake (left) and change in body weight (right) of 15-week male DIO mice after 5-day treatment with vehicle (grey), Lac-Phe (red, 50 mg/kg/day, IP) or vehicle-treated pair-fed mice (blue). (i) Average daily food intake (left) and change in body weight (right) of 13-week male DIO mice after 7-day treatment with vehicle (grey), lactate (blue, 50 mg/kg/day, IP), phenylalanine (green, 50 mg/kg/day, IP), or Lac-Phe (red, 50 mg/kg/day, IP). For (a,b), N=6/group; for (c-g), N=9 for vehicle and N=8 for Lac-Phe groups; for (h), N=8 for vehicle, N=10 for Lac-Phe, and N=10 for pair fed groups; for (i), N=5/group. Data are shown as mean ± SEM. The experiments shown in (a,b) were performed once; the experiments shown in (c-d) were performed three times; and the experiments shown in (e-i) were performed once. P-values were calculated by two-way ANOVA with repeated measures (for a-e) and Student’s two-sided t-test (for f-i).
Fig. 4.
Fig. 4.. Increased food intake and obesity in mice genetically deficient in Lac-Phe.
(a) Plasma Lac-Phe levels in male WT (blue) and CNDP2 KO (red) mice under sedentary conditions or after a single bout of exhaustive treadmill running. (b,c) Cumulative daily food intake (b) and body weight (c) of male WT (blue) and CNDP2-KO (red) mice under an obesigenic diet/exercise training regimen in which mice were fed high fat diet (60% kcal from fat) and exercised by treadmill running 5 days/week (see Methods). (d) Change in body weight of WT (blue) and CNDP2-KO (“KO”, red) mice after 40 days of obesogenic diet alone (“HFD/Sedentary”) or obesogenic diet with treadmill running (“HFD/Exercise”). (e,f) Tissue weights (e) and representative images of adipose tissues (f) of WT (blue) and CNDP2-KO (red) mice following a combined obesogenic diet/treadmill running protocol. Tissue weights and images were taken on day 41. iWAT, inguinal white adipose tissue; eWAT, epididymal white adipose tissue; BAT, brown adipose tissue. For (a), N=6/group. For (b,c) and (e,f), N=8 for WT and N=8 for CNDP2-KO. For (d), N=8 for WT HFD/Sedentary, N=11 for CNDP2-KO HFD/Sedentary, N=9 for WT HFD/Exercise, and N=8 for CNDP2-KO HFD/Exercise. Data are shown as mean ± SEM. The experiments shown in (a-c) were performed two times and the experiments shown in (d-f) were performed once. P-values were calculated by two-way ANOVA with repeated measures (for b,c) or Student’s two-sided t-test (for a, d, and e).
Fig. 5.
Fig. 5.. Robust and sustained elevation of Lac-Phe following human exercise.
(a) Schematic of human acute treadmill exercise study design, N=36, “Cohort 1”. (b) Exercise-regulated metabolites (dark blue), lipids (grey), or proteins (light blue) from blood plasma in Cohort 1. A previously unassigned metabolite with a chemical formula matching that of Lac-Phe (red) was ranked the third most exercise-regulated molecule in the entire dataset. (c) Time course of Lac-Phe and lactate in blood in Cohort 1 after exercise in the non-exercised control group. (d) Schematic of human crossover acute exercise study design, N=8, “Cohort 2”. (e) Time course of Lac-Phe levels pre and post-exercise in Cohort 2. (f) Correlation of plasma Lac-Phe and lactate levels immediately pre- and post-exercise across the three exercise modalities in Cohort 2. Data are shown as mean ± SEM. The experiments were performed once. P-values were calculated by two-way ANOVA with repeated measures.

Comment in

References

    1. Eriksson KF & Lindgärde F Prevention of Type 2 (non-insulin-dependent) diabetes mellitus by diet and physical exercise. Diabetologia 34, 891–898 (1991). - PubMed
    1. Rejeski WJ et al. Lifestyle Change and Mobility in Obese Adults with Type 2 Diabetes. N. Engl. J. Med. 366, 1209–1217 (2012). - PMC - PubMed
    1. Stampfer MJ, Hu FB, Manson JE, Rimm EB & Willett WC Primary prevention of coronary heart disease in women through diet and lifestyle. N. Engl. J. Med. 343, 16–22 (2000). - PubMed
    1. Helmrich SP, Ragland DR, Leung RW & Paffenbarger RS Physical activity and reduced occurrence of non-insulin-dependent diabetes mellitus. New English J. Med. 325, 147–152 (1991). - PubMed
    1. Rawshani A et al. Risk Factors, Mortality, and Cardiovascular Outcomes in Patients with Type 2 Diabetes. N. Engl. J. Med. 379, 633–644 (2018). - PubMed

Methods References

    1. De Wolf CJF et al. cGMP transport by vesicles from human and mouse erythrocytes. FEBS J. 274, 439–450 (2007). - PubMed
    1. Smith CA et al. XCMS: processing mass spectrometry data for metabolite profiling using nonlinear peak alignment, matching, and identification. Anal. Chem. 78, 779–787 (2006). - PubMed
    1. Agudelo LZ et al. Skeletal muscle PGC-1α1 modulates kynurenine metabolism and mediates resilience to stress-induced depression. Cell 159, 33–45 (2014). - PubMed
    1. Coxon JP et al. GABA concentration in sensorimotor cortex following high-intensity exercise and relationship to lactate levels. J. Physiol. 596, 691–702 (2018). - PMC - PubMed