. 2022 Jun;606(7916):976-983.
doi: 10.1038/s41586-022-04789-9. Epub 2022 Jun 15.

A pan-cancer compendium of chromosomal instability

Affiliations

A pan-cancer compendium of chromosomal instability

Ruben M Drews et al. Nature. 2022 Jun.

Abstract

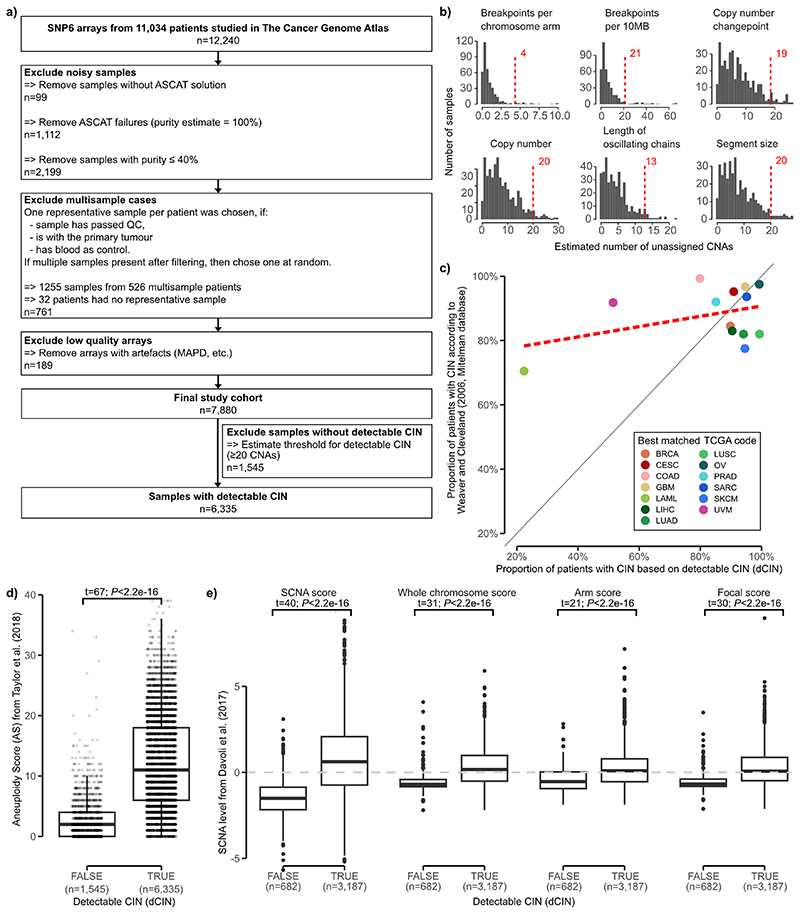
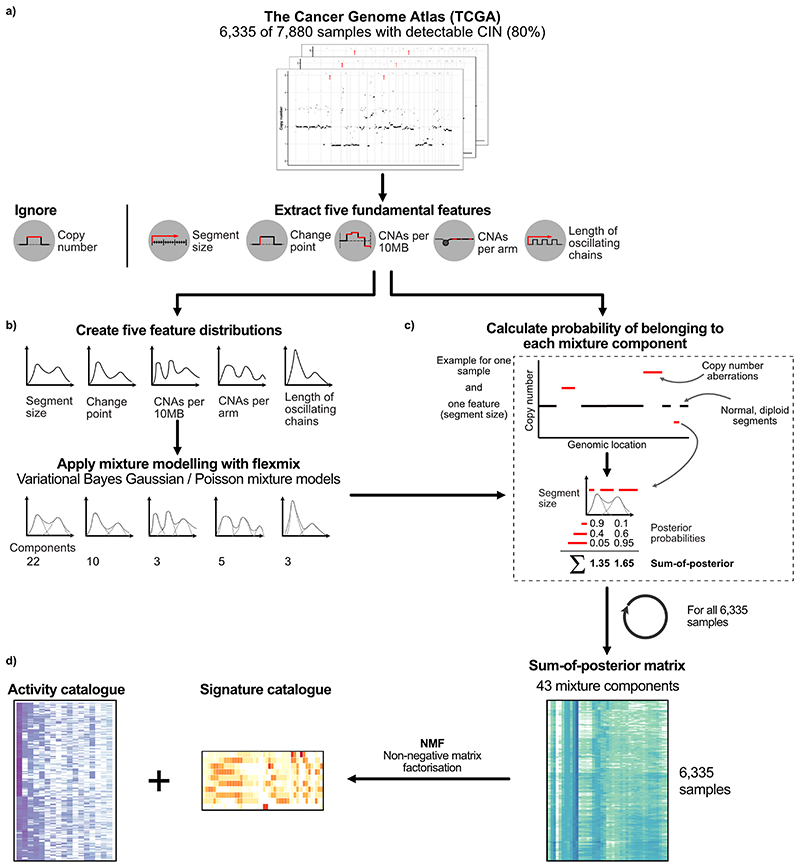
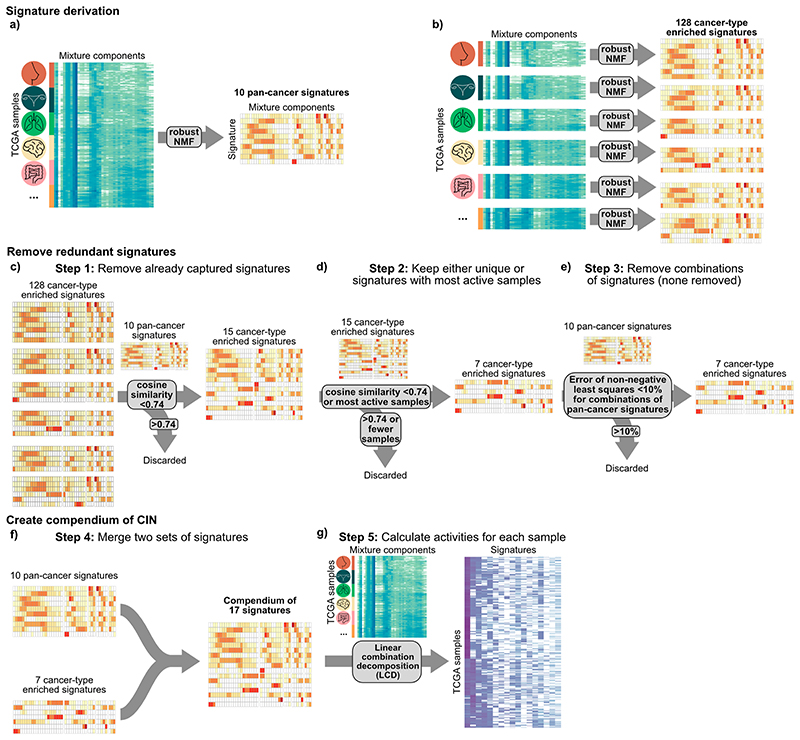
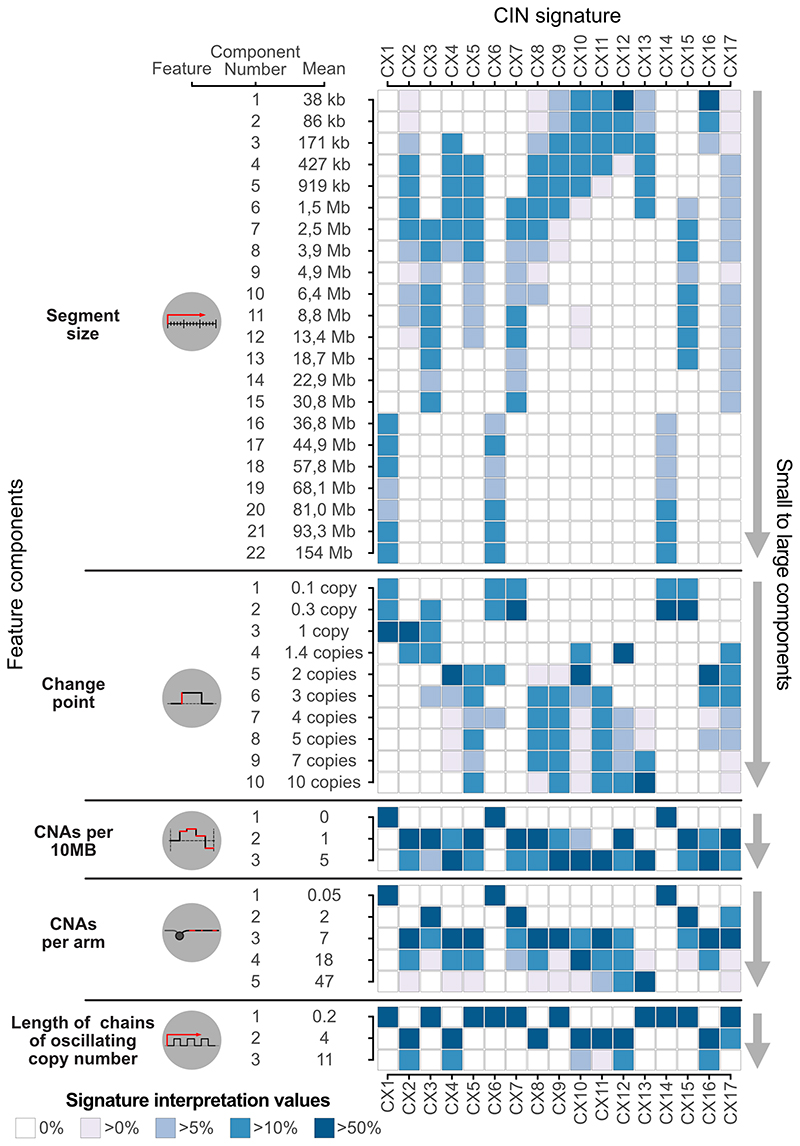
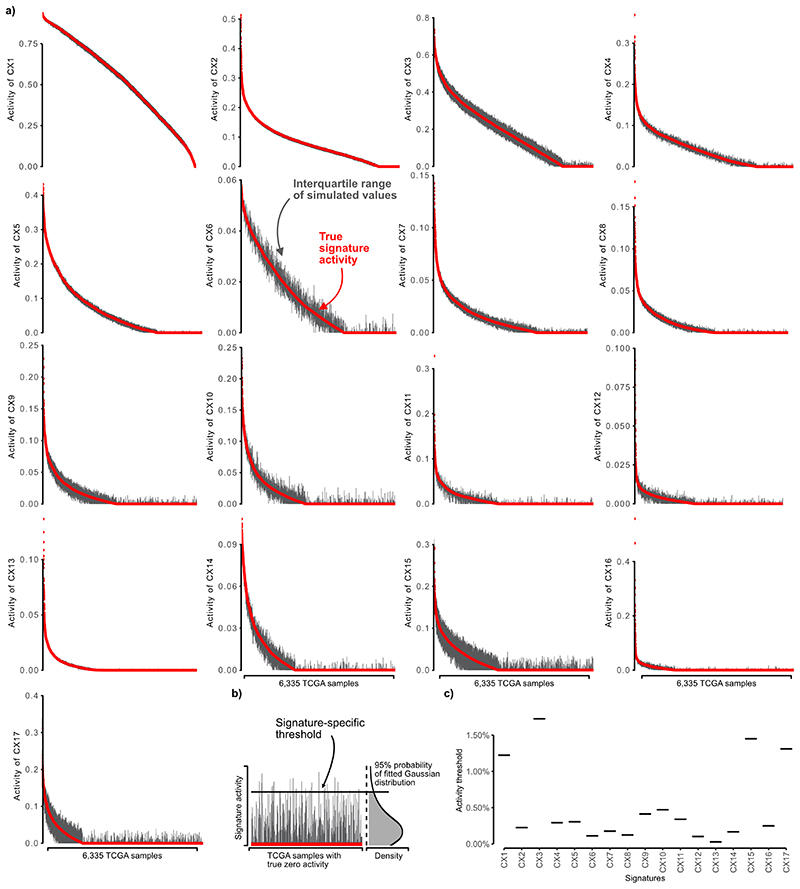
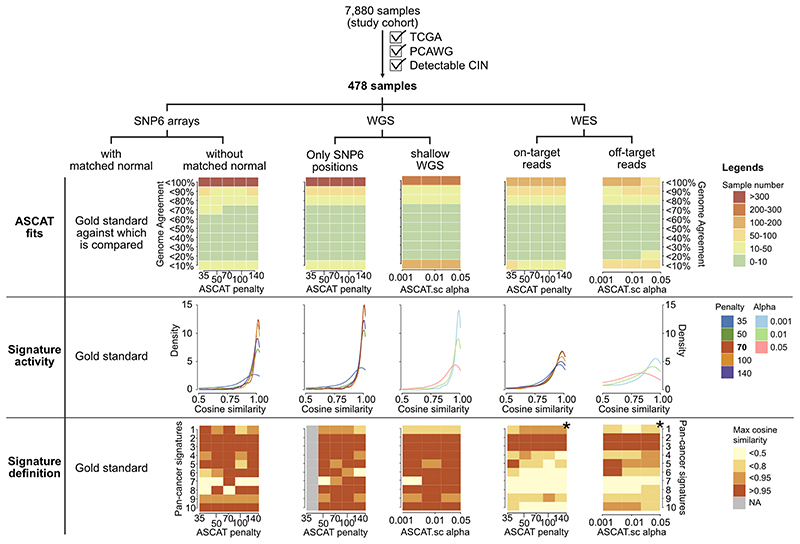
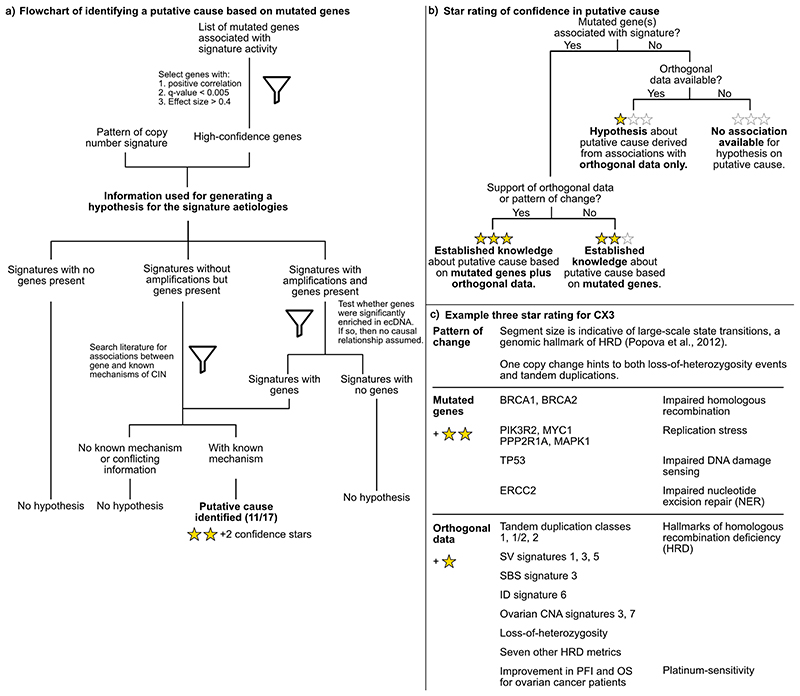
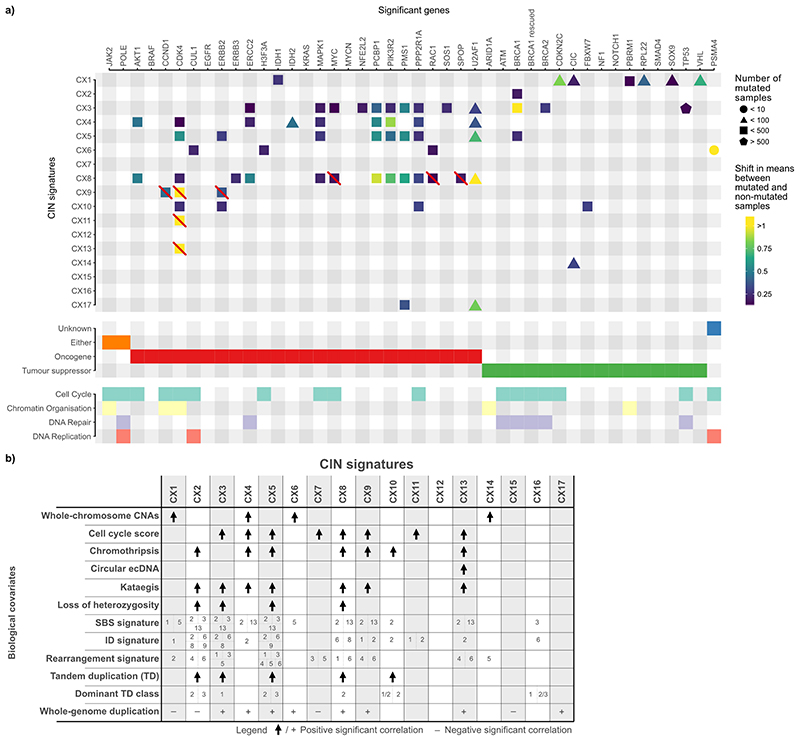
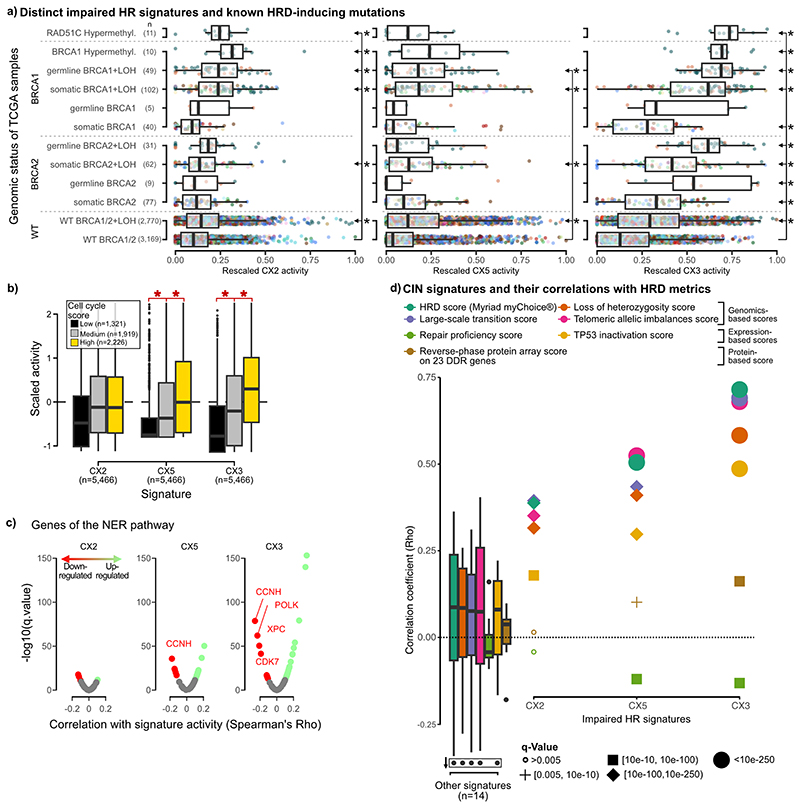
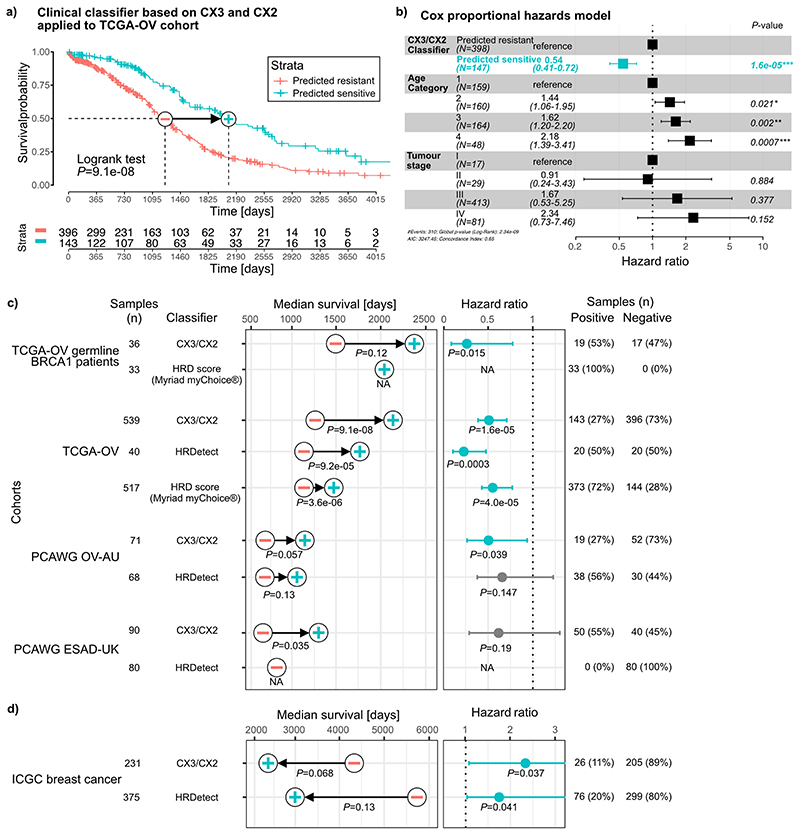
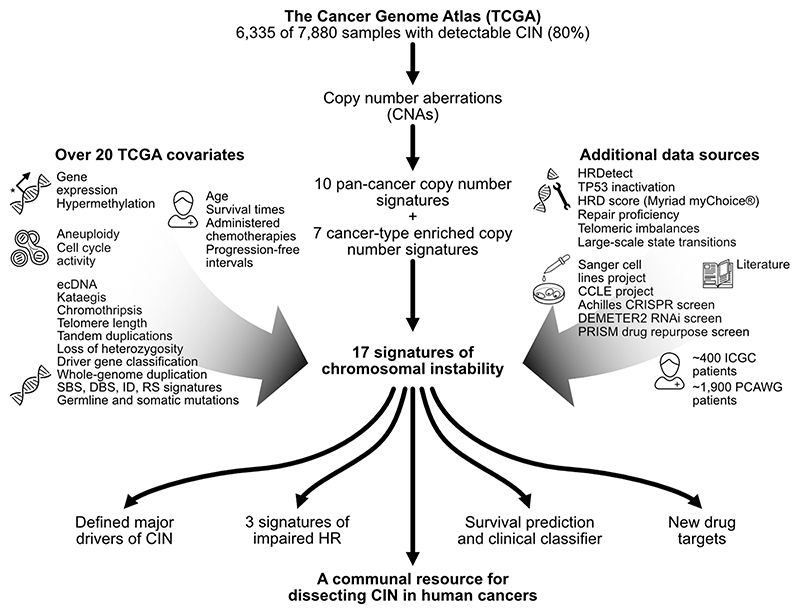
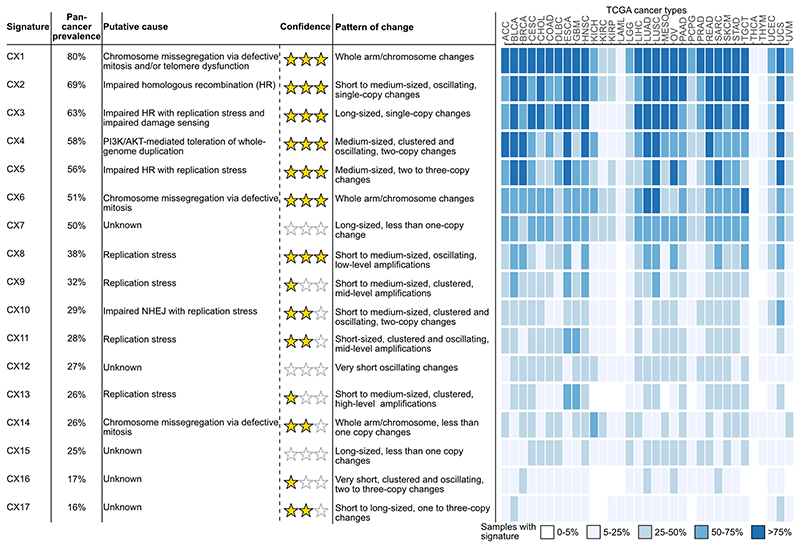
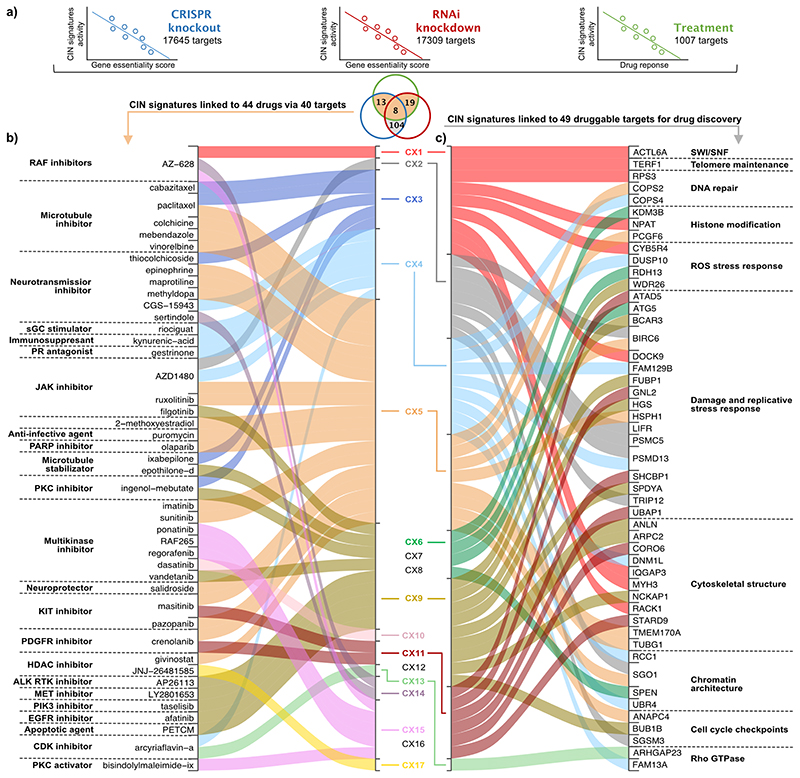
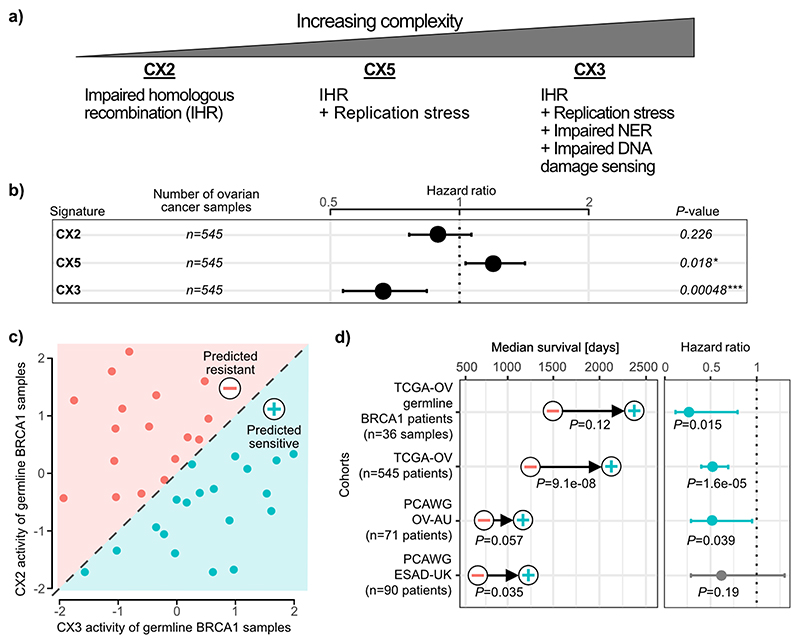
Chromosomal instability (CIN) results in the accumulation of large-scale losses, gains and rearrangements of DNA1. The broad genomic complexity caused by CIN is a hallmark of cancer2; however, there is no systematic framework to measure different types of CIN and their effect on clinical phenotypes pan-cancer. Here we evaluate the extent, diversity and origin of CIN across 7,880 tumours representing 33 cancer types. We present a compendium of 17 copy number signatures that characterize specific types of CIN, with putative aetiologies supported by multiple independent data sources. The signatures predict drug response and identify new drug targets. Our framework refines the understanding of impaired homologous recombination, which is one of the most therapeutically targetable types of CIN. Our results illuminate a fundamental structure underlying genomic complexity in human cancers and provide a resource to guide future CIN research.


Conflict of interest statement

Competing interests

J.D.B., G.M., F.M. are co-founders of Tailor Bio Ltd. R.M.D., B.H., G.M., F.M. applied for a patent based on the work presented in this paper (GB2114203.9). G.M., F.M. and J.D.B hold a patent on using copy number signatures to predict response to doxorubicin treatment in ovarian cancer (PCT/EP2021/065058).

Figures

Extended Data Fig. 1
Extended Data Fig. 1. Workflow of sample filtering and detectable chromosomal instability (dCIN)
a: REMARK diagram showing flow of samples through the study. b: For each copy number feature of the previous ovarian signatures: a histogram of number of events per sample that could not be assigned to an ovarian copy number signature on the TCGA ovarian cohort. Red dotted line indicates the quantile 0.95. c: Scatterplot of cancer types comparing our estimate of detectable CIN (Supplementary Methods) to estimates reported in the Mitelman database. d+e: Boxplots comparing our estimate of detectable CIN with aneuploidy score and four CNA-specific metrics. Boxes represent the interquartile range (IQR) with the median as a bolded line. The whiskers extend to the largest/smallest value no further than 1.5 * IQR from the hinge. Outliers beyond the end of the whiskers are marked individually as points. Results of two-sided Welch’s t-test shown on top of the boxplots.
Extended Data Fig. 2
Extended Data Fig. 2. Overview of copy number features and signature identification
a: A schematic showing the 5 fundamental copy number features that were computed using 6,335 samples with detectable CIN (dCIN). Note, a feature capturing absolute copy number is not included in our method. b: A schematic showing how mixture modelling is used to split the genome-wide feature distributions into smaller components by either Variational Bayes Gaussian mixture models or Finite Poisson mixture models. The actual number of resulting components is listed below each feature distribution. These components represent basic building blocks of each feature distribution. c: An example of how the probability of a CNA belonging to a mixture component (posterior probability) is calculated and how these are summed. d: (Right) The resulting 43-dimensional feature vectors for each sample, after all posterior probabilities are summed for each component. (Left) A schematic of how the sum-of-posterior matrix for all 6,335 samples was split in two matrices by a Bayesian implementation of the non-negative matrix factorisation (NMF), resulting in a signature catalogue and an activity catalogue.
Extended Data Fig. 3
Extended Data Fig. 3. Schematic of the signature compendium identification
a: From the complete input matrix 10 pan-cancer signatures were identified. b: For the 20 cancer types with over 100 samples each, 128 cancer-type enriched signatures (CTES) were identified. c: All CTES were removed that had a cosine similarity over 0.74 with any pan-cancer signature. d: From the groups of CTES that had cosine similarities over 0.74 to each other, the signature with activities in the largest number of samples was taken as a representative signature. e: We performed non-negative least squares on each pair of pan-cancer specific signatures to each CTES. For any combination which showed a reconstruction error below 0.1, this CTES was removed. f: The sets of 10 pan-cancer and 7 CTES were joined to a compendium of 17 signatures. g: Using linear combination decomposition, the signature activities were calculated for the 6,335 TCGA samples.
Extended Data Fig. 4
Extended Data Fig. 4. Signature interpretation matrix
Displayed on the left are the five features, their mixture components and component means. The heatmap on the right shows the signature interpretation values, which combine information from the sum-of-posterior matrix, signature activity matrix and the signature definition matrix (Supplementary Methods). Only components that are positively correlated with signature activity levels are displayed. Interpretation values are normalised per feature and signature.
Extended Data Fig. 5
Extended Data Fig. 5. Monte Carlo simulation results for determining signature-specific noise thresholds
a: Each plot (1 per signature) shows the interquartile range of sample signature activities after the introduction of noise in the copy number features using a Monte Carlo simulation. Samples are ordered by their observed signature activity (red line). b: Schematic showing how we fitted a Gaussian distribution to the simulated values of all samples with an observed signature activity of 0 (red line). The horizontal black line represents the quantile 0.95 of the fitted Gaussian and forms the basis of our signature specific noise threshold, where values below this line are not distinguishable from 0. c: Plot of the signature-specific thresholds for the 17 copy number signatures.
Extended Data Fig. 6
Extended Data Fig. 6. Signature stability across different copy number profiling technologies
Across the same set of 478 tumours, we compared the SNP6-array based copy number profiles and signatures to copy number profiles and signatures derived using different copy number profiling technologies. The columns contain results for the different technologies and the rows contain results for comparison between copy number profiles (top), signature activities (middle) and signature definitions (bottom, limited to pan-cancer signatures). For each comparison we show results for a range of penalties for ASCAT’s piecewise constant fitting or ASCAT.sc’s circular binary segmentation. (*): For settings marked with a star it was not possible to derive solutions for K=10, instead the optimal number of K was chosen (lower than K=10).
Extended Data Fig. 7
Extended Data Fig. 7. Workflow for determining signature aetiology and confidence rating
a: Flowchart showing how an association between a mutated gene and signature activity was used to derive a hypothesis for a putative aetiology. b: Flowchart representing the decision making process leading to the assignment of a 3-star rating confidence score. c: Example of the star rating process for CX3.
Extended Data Fig. 8
Extended Data Fig. 8. Summary of associations between signatures and other covariates
a: Main panel shows significant associations between copy number signatures and mutated genes. Gene annotations summarised in the panels below. Boxes with a red line indicate significant associations that were not considered when determining signature aetiologies as the significant enrichment was via amplification of the gene, which also resided in an ecDNA amplicon, which could be a consequence of the signature rather than a cause, potentially causing a spurious correlation with amplification signatures (CX8, CX9, CX11, CX13). b: Each row shows highly significant associations between signatures and different covariates. Unless otherwise specified, only positive correlations are shown.
Extended Data Fig. 9
Extended Data Fig. 9. Impaired homologous recombination signatures and their associations
a: Boxplots summarise signature activities of different patient groups (rows) defined by their driver gene mutation status. Ovarian samples are coloured in dark green and breast in orange. Boxes represent the interquartile range (IQR) with the median as a bolded line. The whiskers extend to the largest/smallest value no further than 1.5 * IQR from the hinge. Outliers beyond the end of the whiskers are marked individually as points. Significance tested with two-sided Welch’s t-test between WT BRCA1/2 and each of the categories and corrected for multiple testing by using Benjamini-Hochberg method. Statistically significant comparisons are shown to the right of the boxplots with stars denoting significance (q<0.05) and arrows denoting the two groups used for the statistical test. (BRCA1/2 = BRCA1 and BRCA2, WT = wild type; LOH = loss of heterozygosity) b: Boxplots (with same characteristics as in a) summarise the scaled signature activities of 5,466 TCGA samples split by low, medium and high cell cycle scores. The brackets and stars (q<0.05) show where there was a significant increase from low to medium to high cell cycle groups tested with a Welch’s t-test and corrected for multiple testing with Benjamini-Hochberg method. c: Volcano plots showing the results of a correlation between signature activity and expression of genes involved in nucleotide excision repair (NER). Each dot represents a gene, coloured dots show significant correlations. d: Spearman correlation coefficient (y-axis) of correlation between signature activities and seven common metrics of HRD (listed at top). Individual coefficients are displayed for impaired homologous recombination (IHR) signatures and the distribution of coefficients from remaining signatures are represented by boxplots (with same characteristics as in a).
Extended Data Fig. 10
Extended Data Fig. 10. Performance of classifiers for predicting platinum sensitivity
a: Kaplan-Meier estimator showing the overall survival probabilities of TCGA ovarian cancer patients split into two groups using our CX3/CX2 classifier. b: Hazard ratios and their 95% confidence interval obtained from a Cox proportional hazards model trained on our CX3/CX2 classification predicting overall survival of TCGA ovarian cancer patients. The model also corrected for age and cancer stage of the patients. P-value represents the significance of a Wald test. c+d: Median survival and hazard ratios generated for five cancer cohorts from the TCGA, PCAWG and ICGC projects using predictions from three classifiers (our CX3/CX2 classifier, HRDetect and Myriad myChoice based on the HRD score). Improvements in median survival tested by log-rank test (Kaplan-Meier survival analysis), with the minus symbol representing the predicted resistant group and the plus symbol the predicted sensitive group. Hazard ratios, their 95% confidence interval, and Wald test significance of the predicted sensitive group compared to the predicted resistant group are obtained from Cox proportional hazards models correcting for stage and age of patients, except for HRDetect where tumour stage was omitted as the models did not converge if included. The number and proportion of patients predicted to be sensitive (with HRD) and resistant (without HRD) by each classifier are listed on the right.
Fig. 1
Fig. 1. Study overview
This schematic summarises our robust analysis framework which uses copy number to derive pan-cancer copy number signatures and provide insights. On the left and right are lists of the datasets used to support the signature aetiologies and insights. HR = homologous recombination.
Fig. 2
Fig. 2. Proposed aetiologies and prevalence of copy number signatures
A summary of the pan-cancer frequency, proposed aetiology (where possible), aetiology confidence rating, pattern of copy number change and distribution across cancer types is provided for each signature. Signatures are labelled based on pan-cancer prevalence, with signature CX1 having the highest pan-cancer frequency. Confidence measures for each signature aetiology are indicated by a star rating. The heatmap shows signature frequency for each of the 33 cancer types.
Fig. 3
Fig. 3. Signatures as biomarkers for drug response and discovery of novel drug targets
a: A schematic showing how response biomarkers and novel drug targets were found by correlating signature activities with gene essentiality determined by CRISPR/Cas9 or RNAi screens, and with response to drug perturbations measured as the area under dose response curve, across 297 cell lines. The Venn diagram shows the overlap of significant correlations for each of the signature/target gene associations. The colour of the circles matches the schematic above, and the shaded areas indicate which results relate to panels a and b. b: A summary of the significant associations between copy number signatures and drug response to 44 therapies. Each signature on the right is linked to a therapy on the left if the signature is predictive of response to CRISPR and/or RNAi perturbation of a target gene, and treatment with a therapy that targets that gene. c: A summary of the significant associations between copy number signatures and target gene perturbation. Each signature on the left is linked to a target gene on the right if the signature is predictive of response to CRISPR and RNAi perturbation of the target gene. The listed targets were filtered for druggability according to their structure or by ligand-base approaches (n=104) and their previous known association with CIN (n=49).
Fig. 4
Fig. 4. Predicting platinum sensitivity using impaired homologous recombination signatures
a: A proposed model of increasing CIN complexity for impaired homologous recombination (IHR) signatures based on the signature aetiologies. b: Results for each IHR signature after training a Cox proportional hazards model to predict overall survival across 545 ovarian cancers treated with platinum-based chemotherapy. Hazard ratios, their 95% confidence interval and Wald test significance are reported. c: A schematic of the clinical classifier built on CX3 and CX2 activities of ovarian samples with germline BRCA1 mutations. d: Results of survival analyses after applying the classifier from (c) to assign patients into predicted sensitive (plus symbol) or predicted resistant (minus symbol) groups. Each row displays results for each of the four cancer cohorts from the TCGA and PCAWG projects. Differences in median survival are indicated by the arrow, with p-values from a log-rank test appearing below (Kaplan-Meier survival analysis). Hazard ratios and their 95% confidence interval of the predicted sensitive group compared to the predicted resistant group are obtained from Cox proportional hazards models correcting for stage and age of patients. P-value represents the corresponding Wald test.

Comment in

  • Copy-number classifiers for cancer.
    Burgess DJ. Burgess DJ. Nat Rev Genet. 2022 Aug;23(8):457. doi: 10.1038/s41576-022-00516-2. Nat Rev Genet. 2022. PMID: 35764797 No abstract available.

References

    1. Bakhoum SF, Cantley LC. The Multifaceted Role of Chromosomal Instability in Cancer and Its Microenvironment. Cell. 2018;174:1347–1360. - PMC - PubMed
    1. Hanahan D, Weinberg RA. Hallmarks of Cancer: The Next Generation. Cell. 2011;144:646–674. - PubMed
    1. Tijhuis AE, Johnson SC, McClelland SE. The emerging links between chromosomal instability (CIN), metastasis, inflammation and tumour immunity. Mol Cytogenet. 2019;12:17. - PMC - PubMed
    1. Chakravarti D, LaBella KA, DePinho RA. Telomeres: history, health, and hallmarks of aging. Cell. 2021;184:306–322. - PMC - PubMed
    1. Bakhoum SF, et al. Chromosomal instability drives metastasis through a cytosolic DNA response. Nature. 2018;553:467–472. - PMC - PubMed

MeSH terms

LinkOut - more resources