. 2022 Jun;606(7916):960-967.
doi: 10.1038/s41586-022-04825-8. Epub 2022 Jun 15.

Caspase-7 activates ASM to repair gasdermin and perforin pores

Affiliations

Caspase-7 activates ASM to repair gasdermin and perforin pores

Kengo Nozaki et al. Nature. 2022 Jun.

Abstract

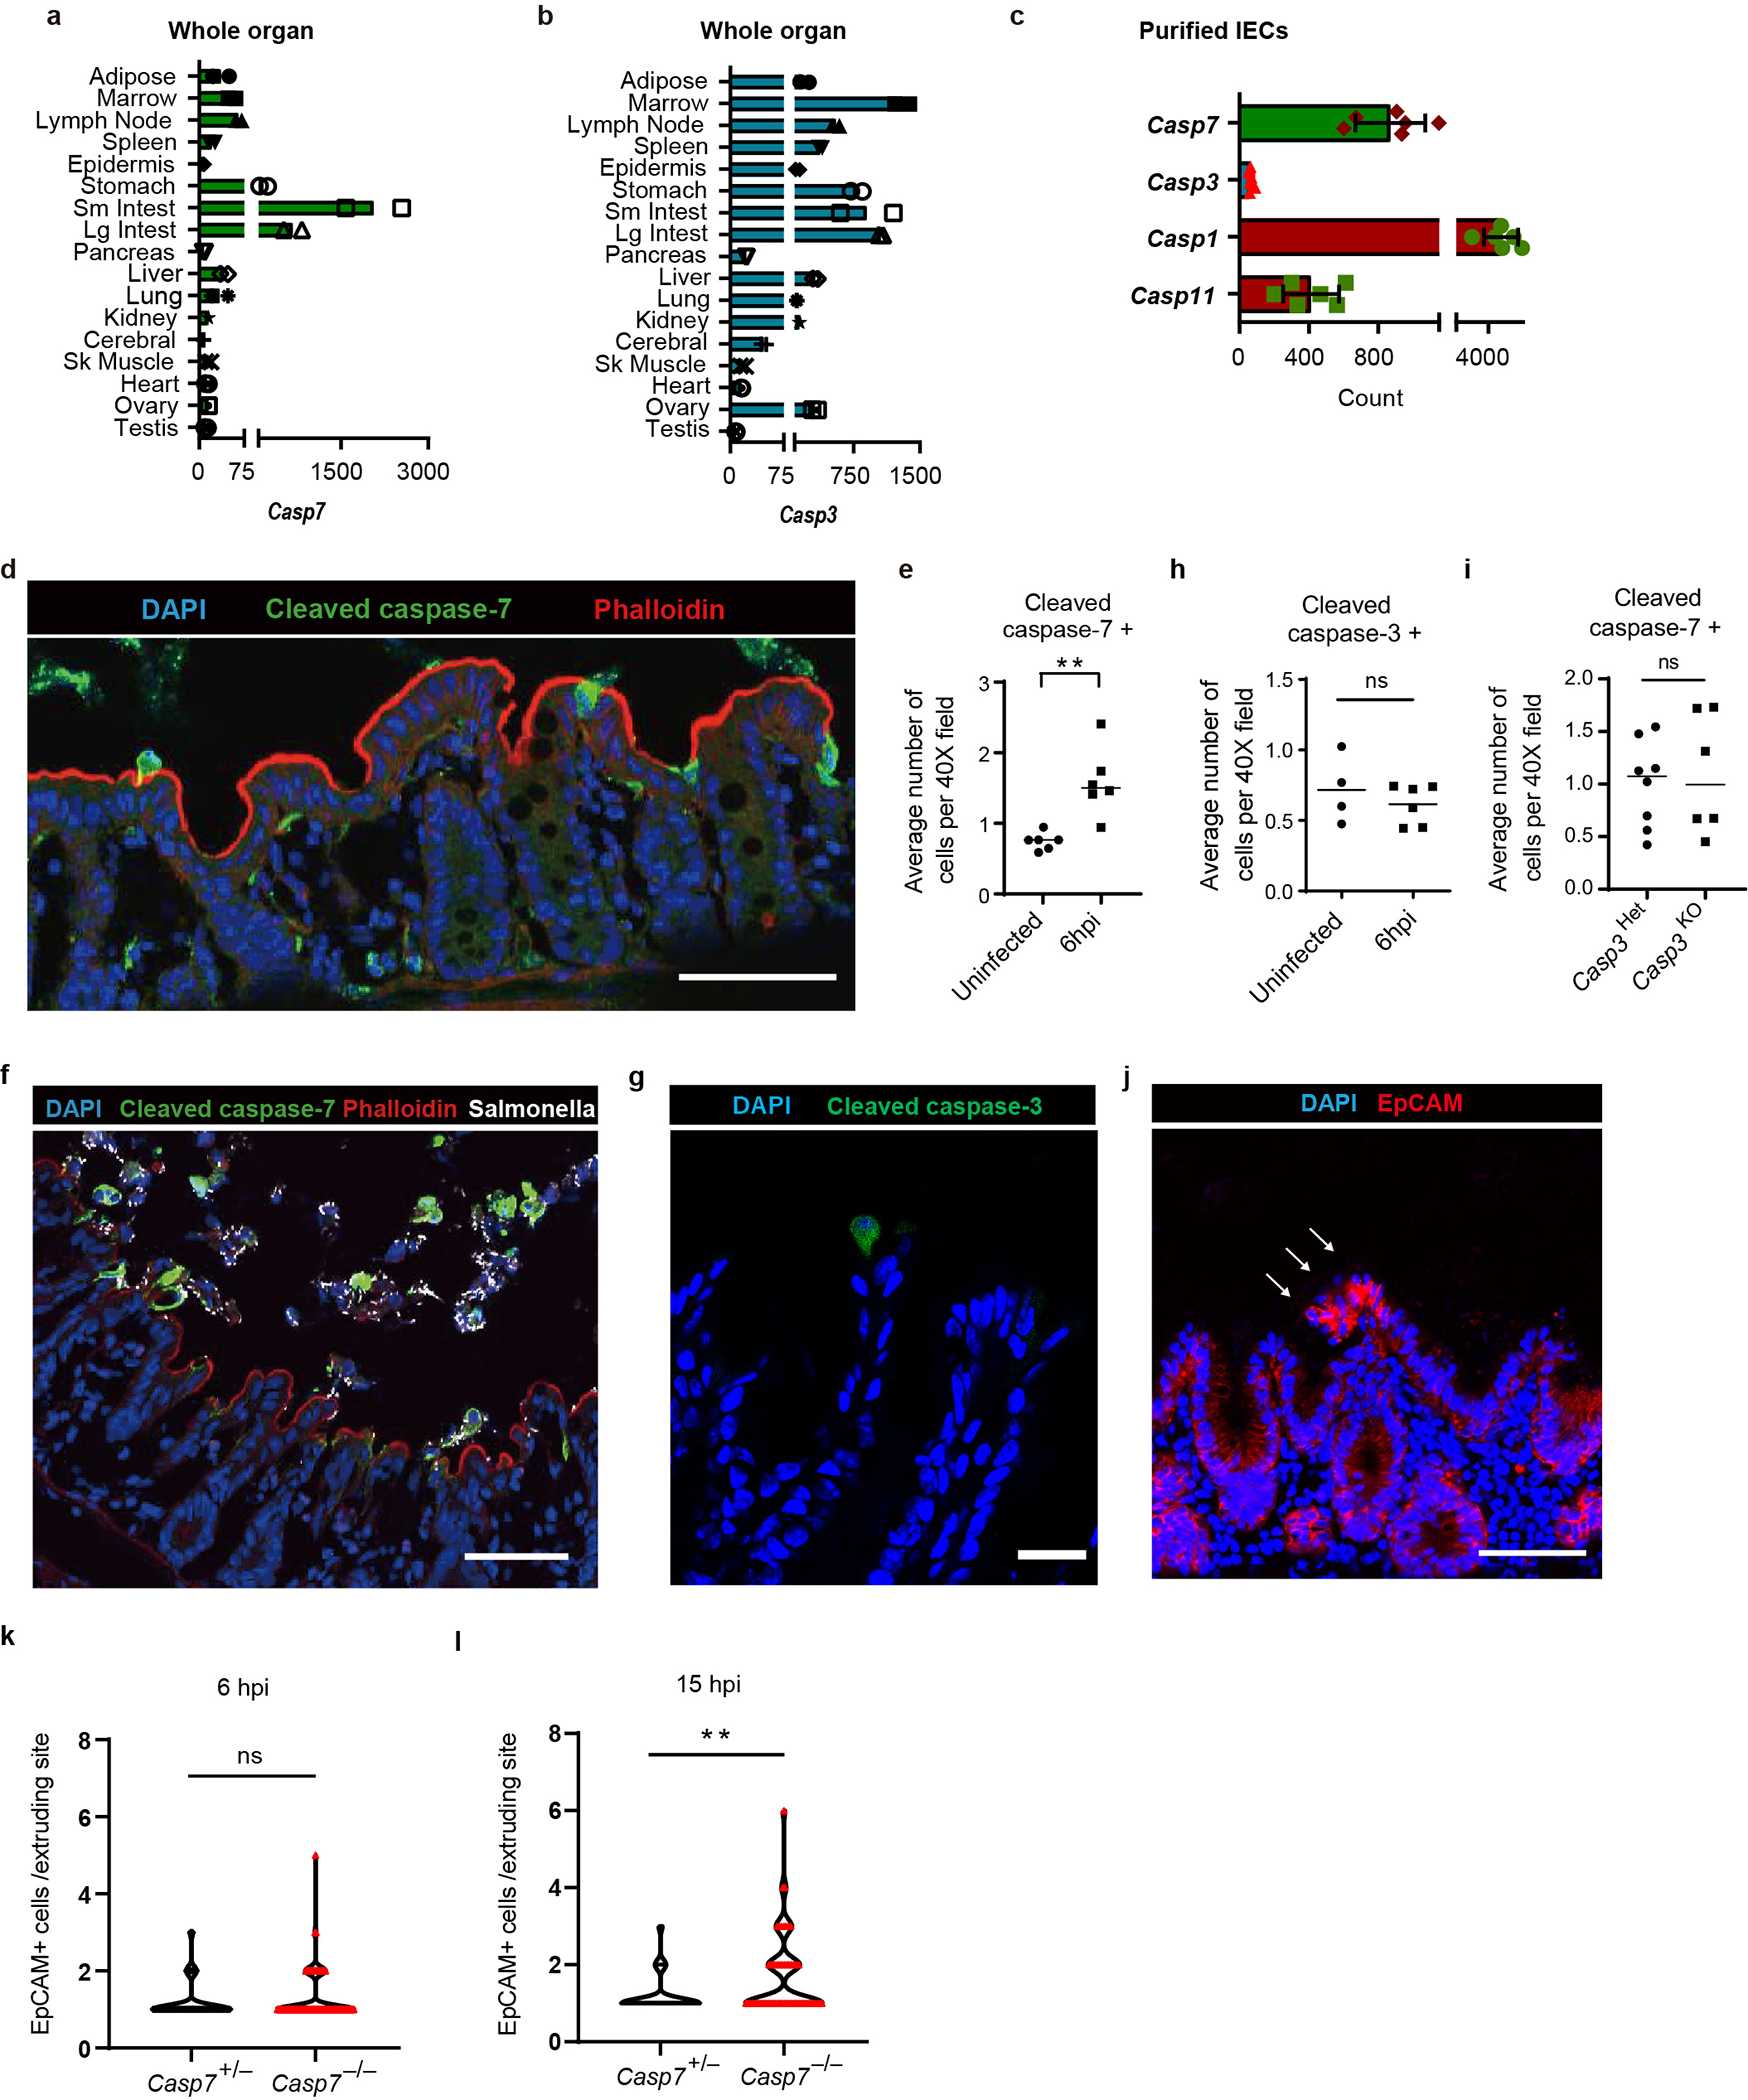
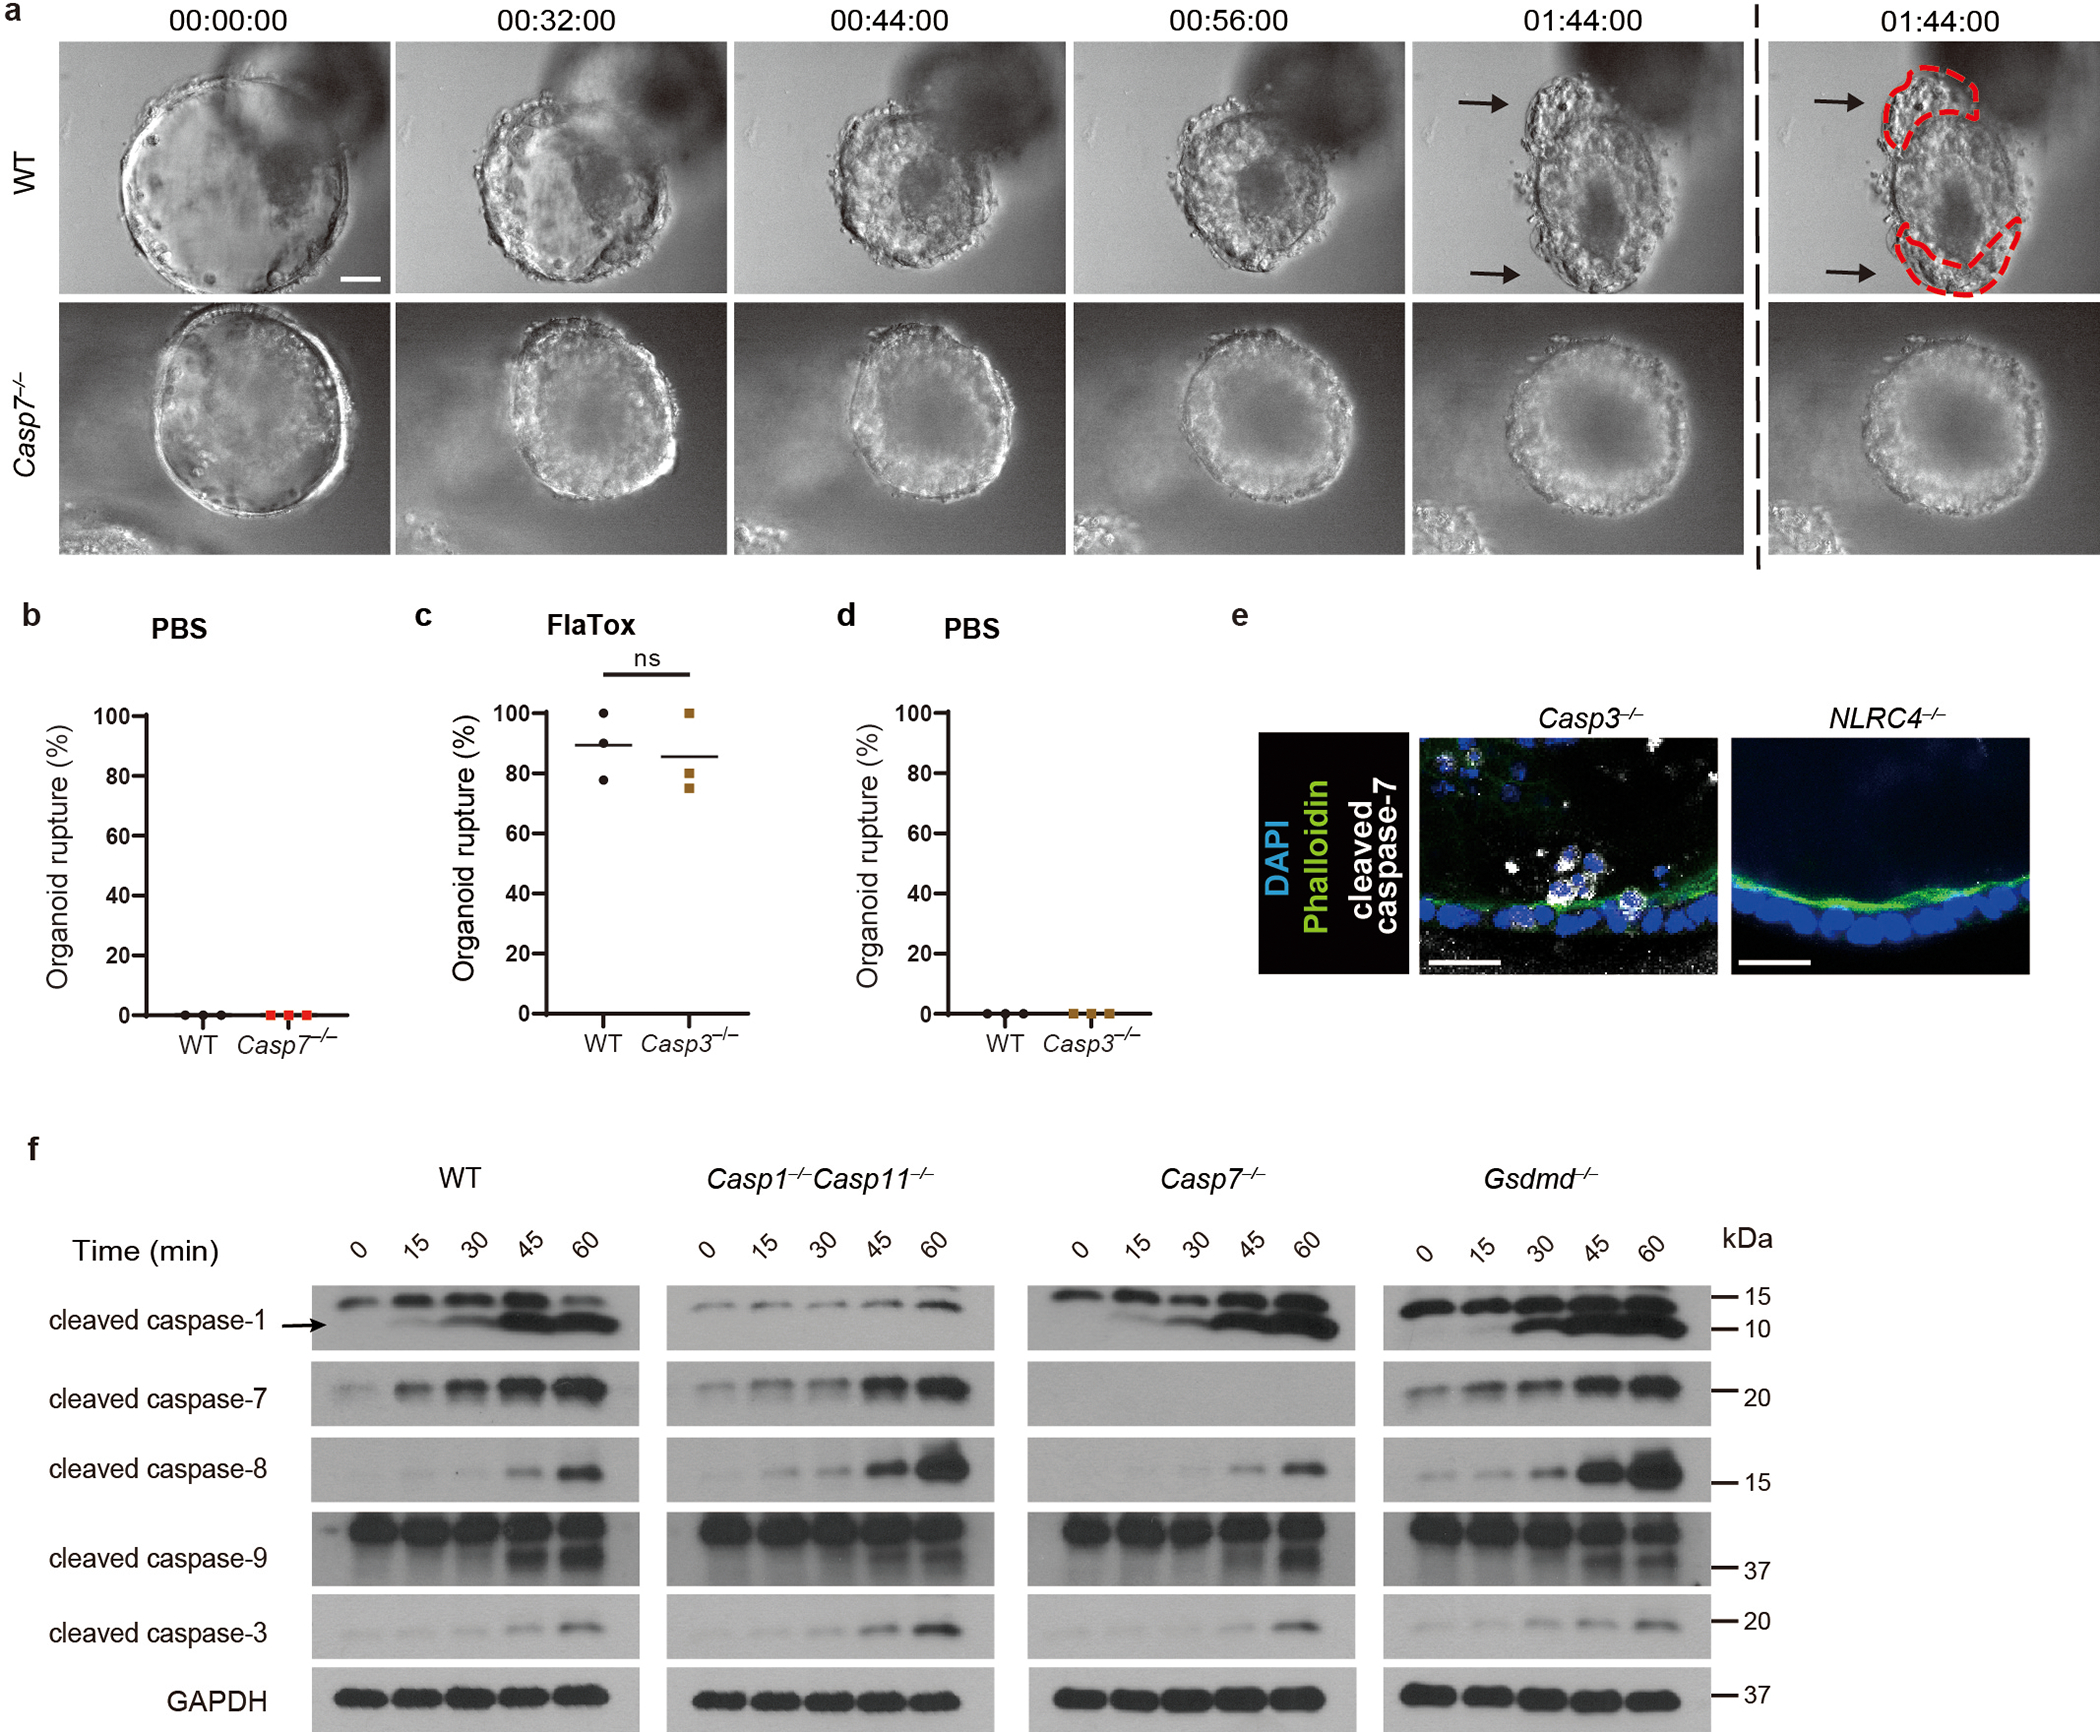
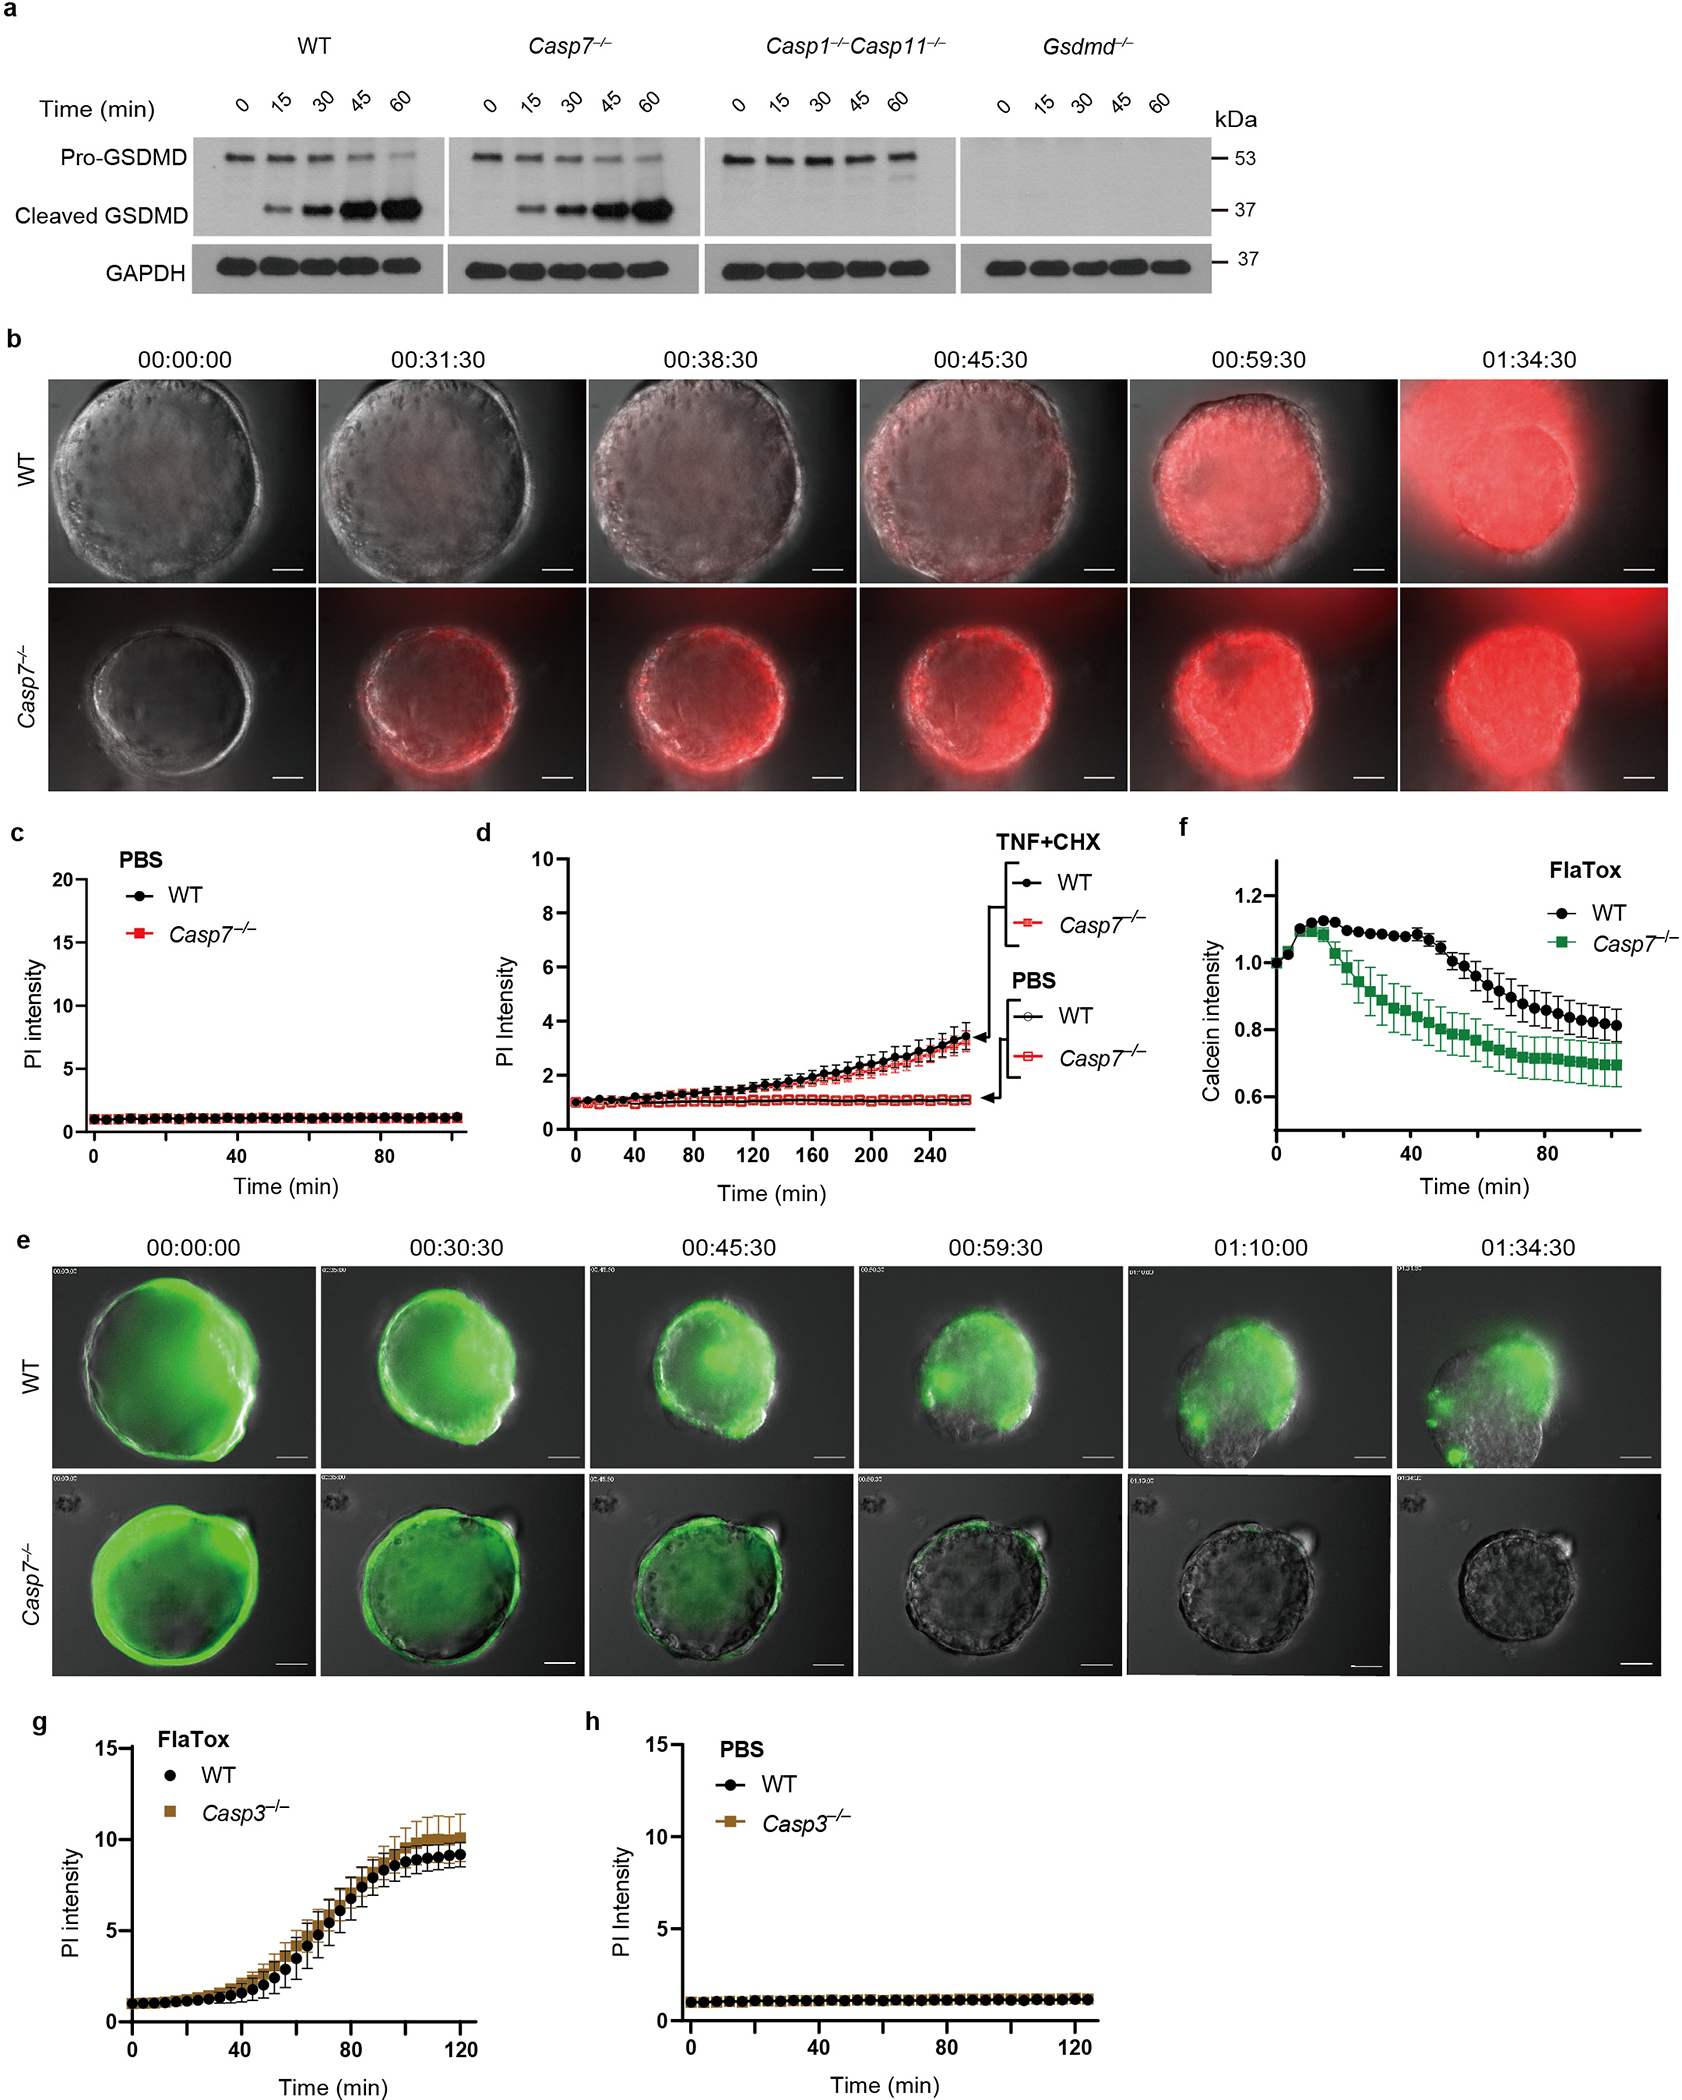
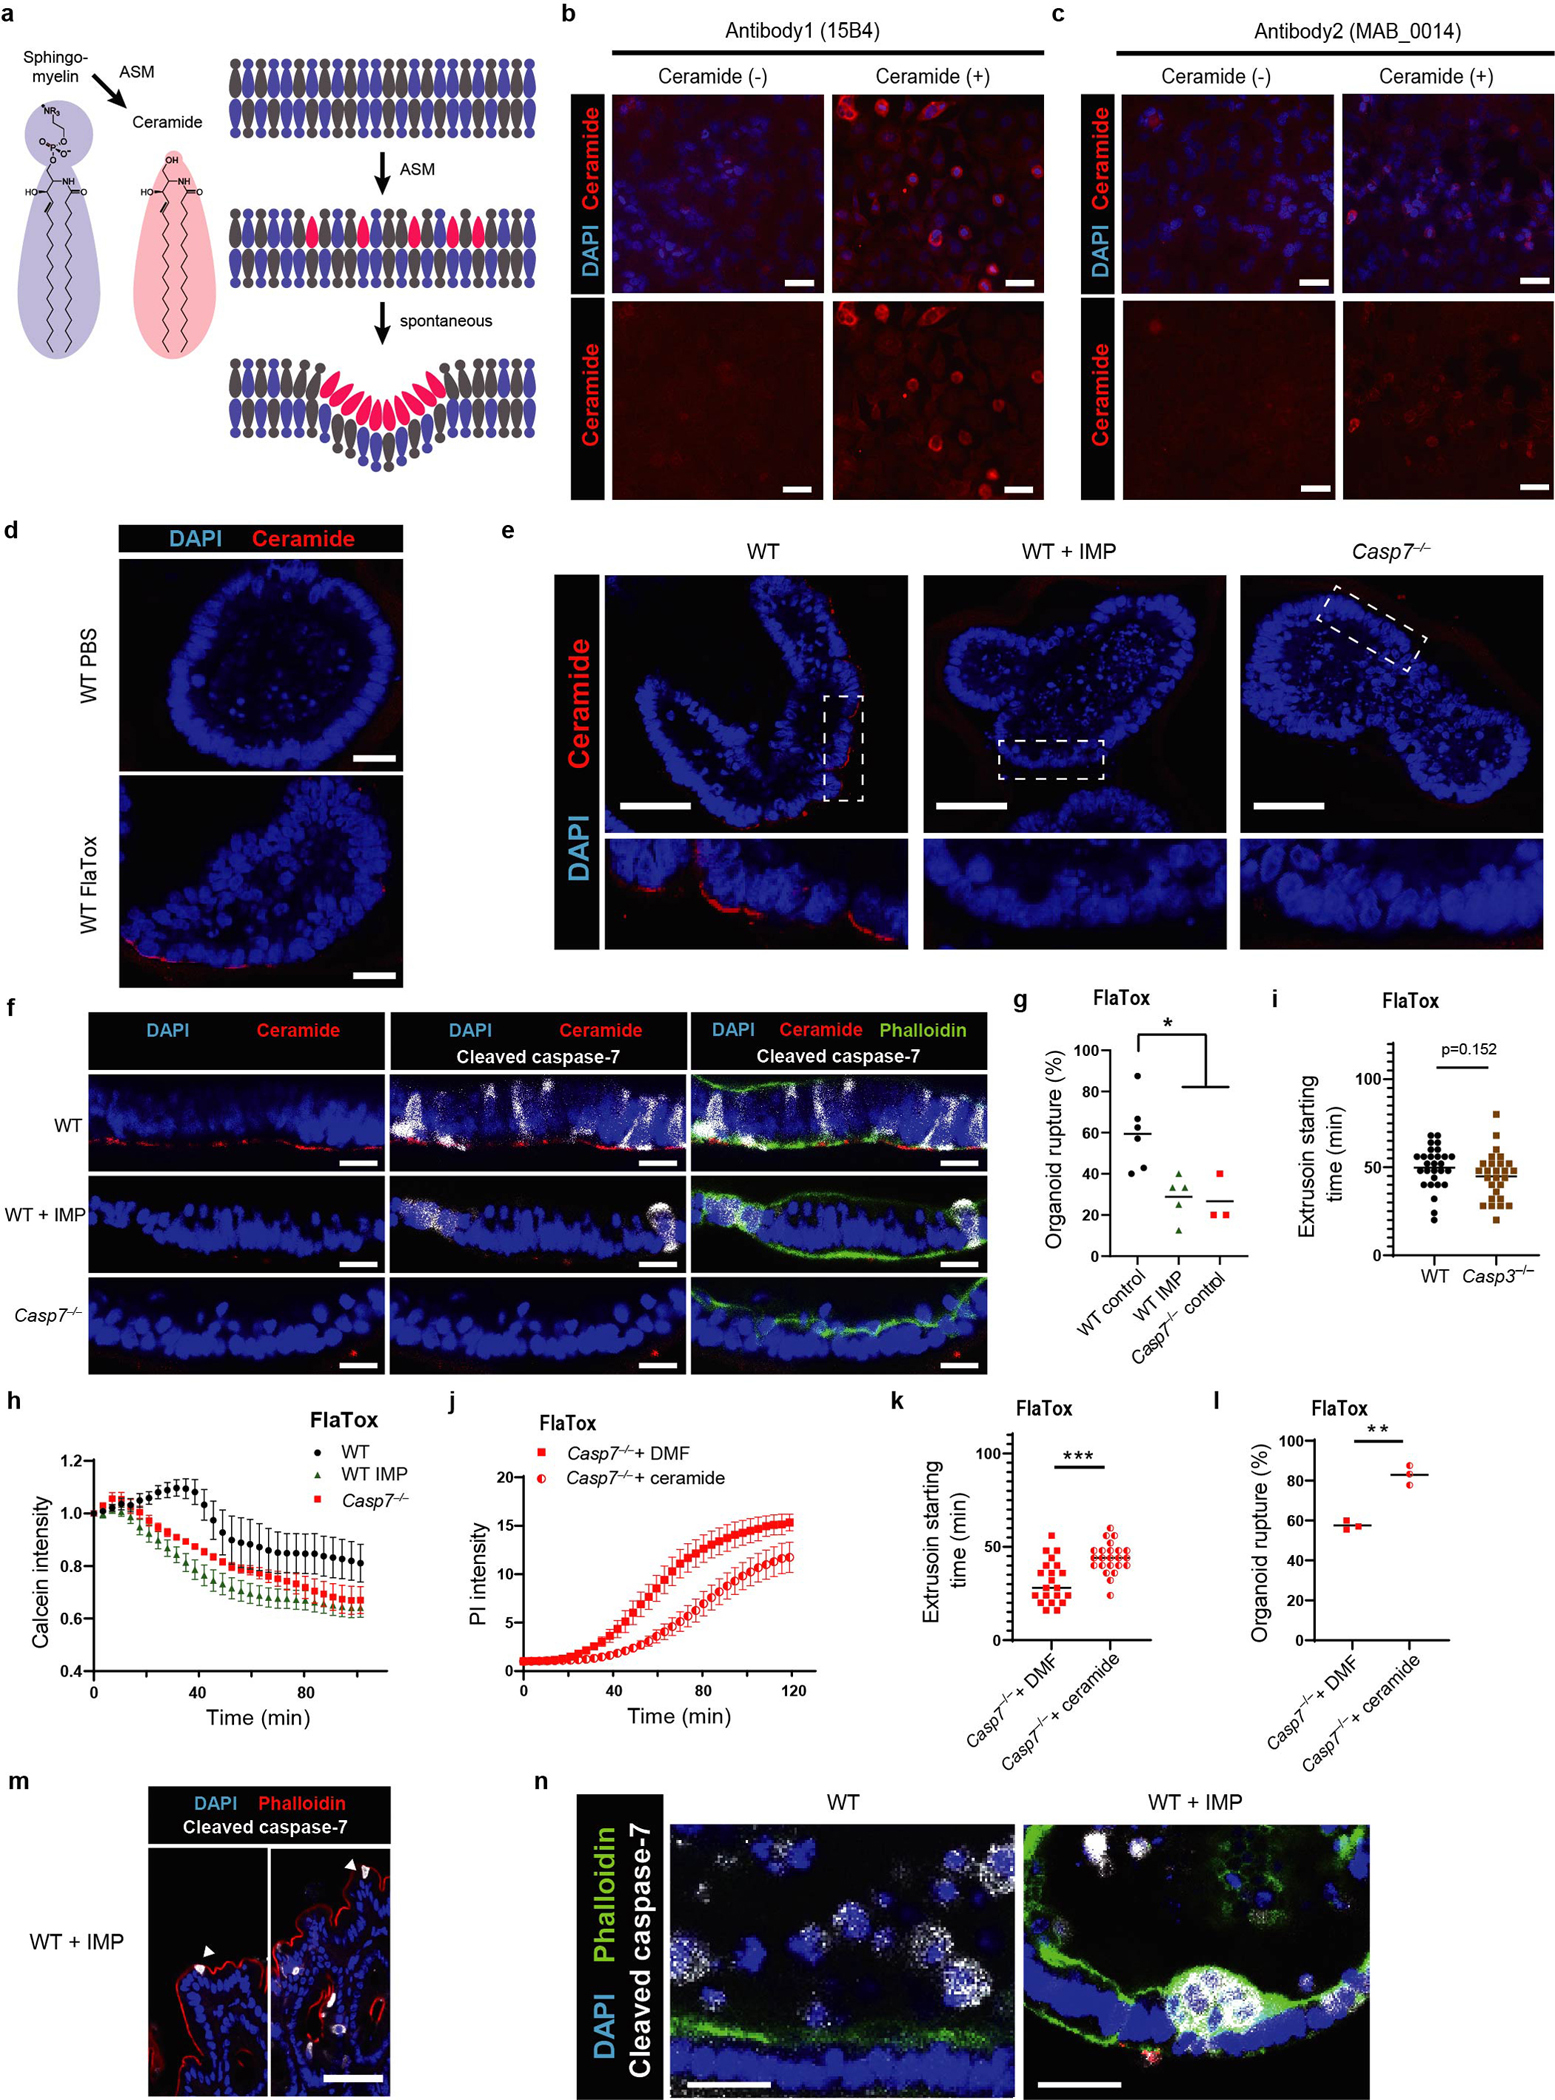
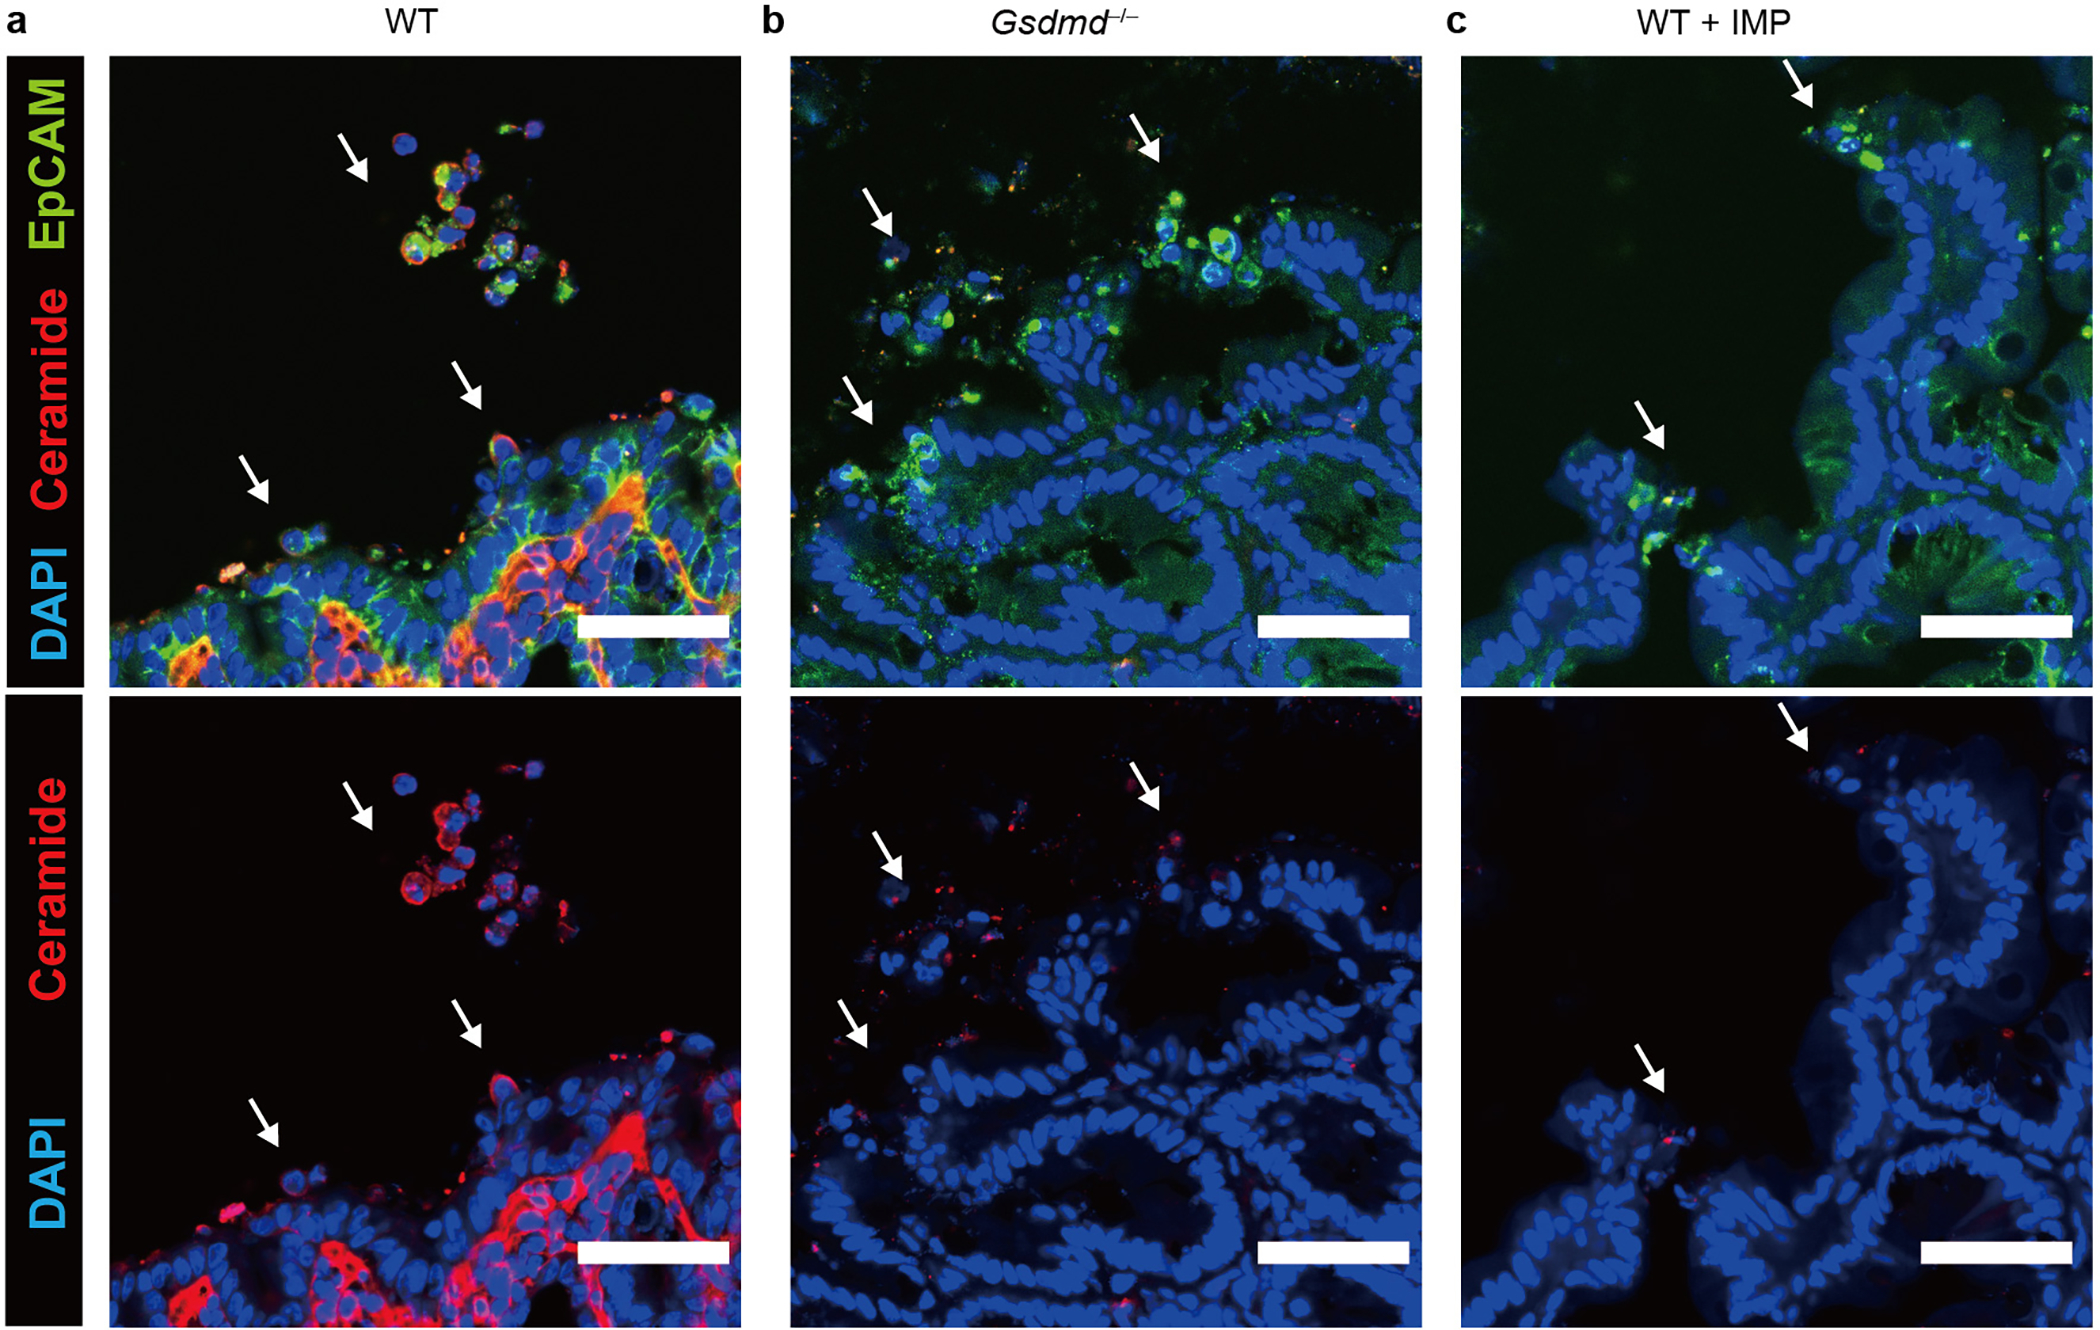
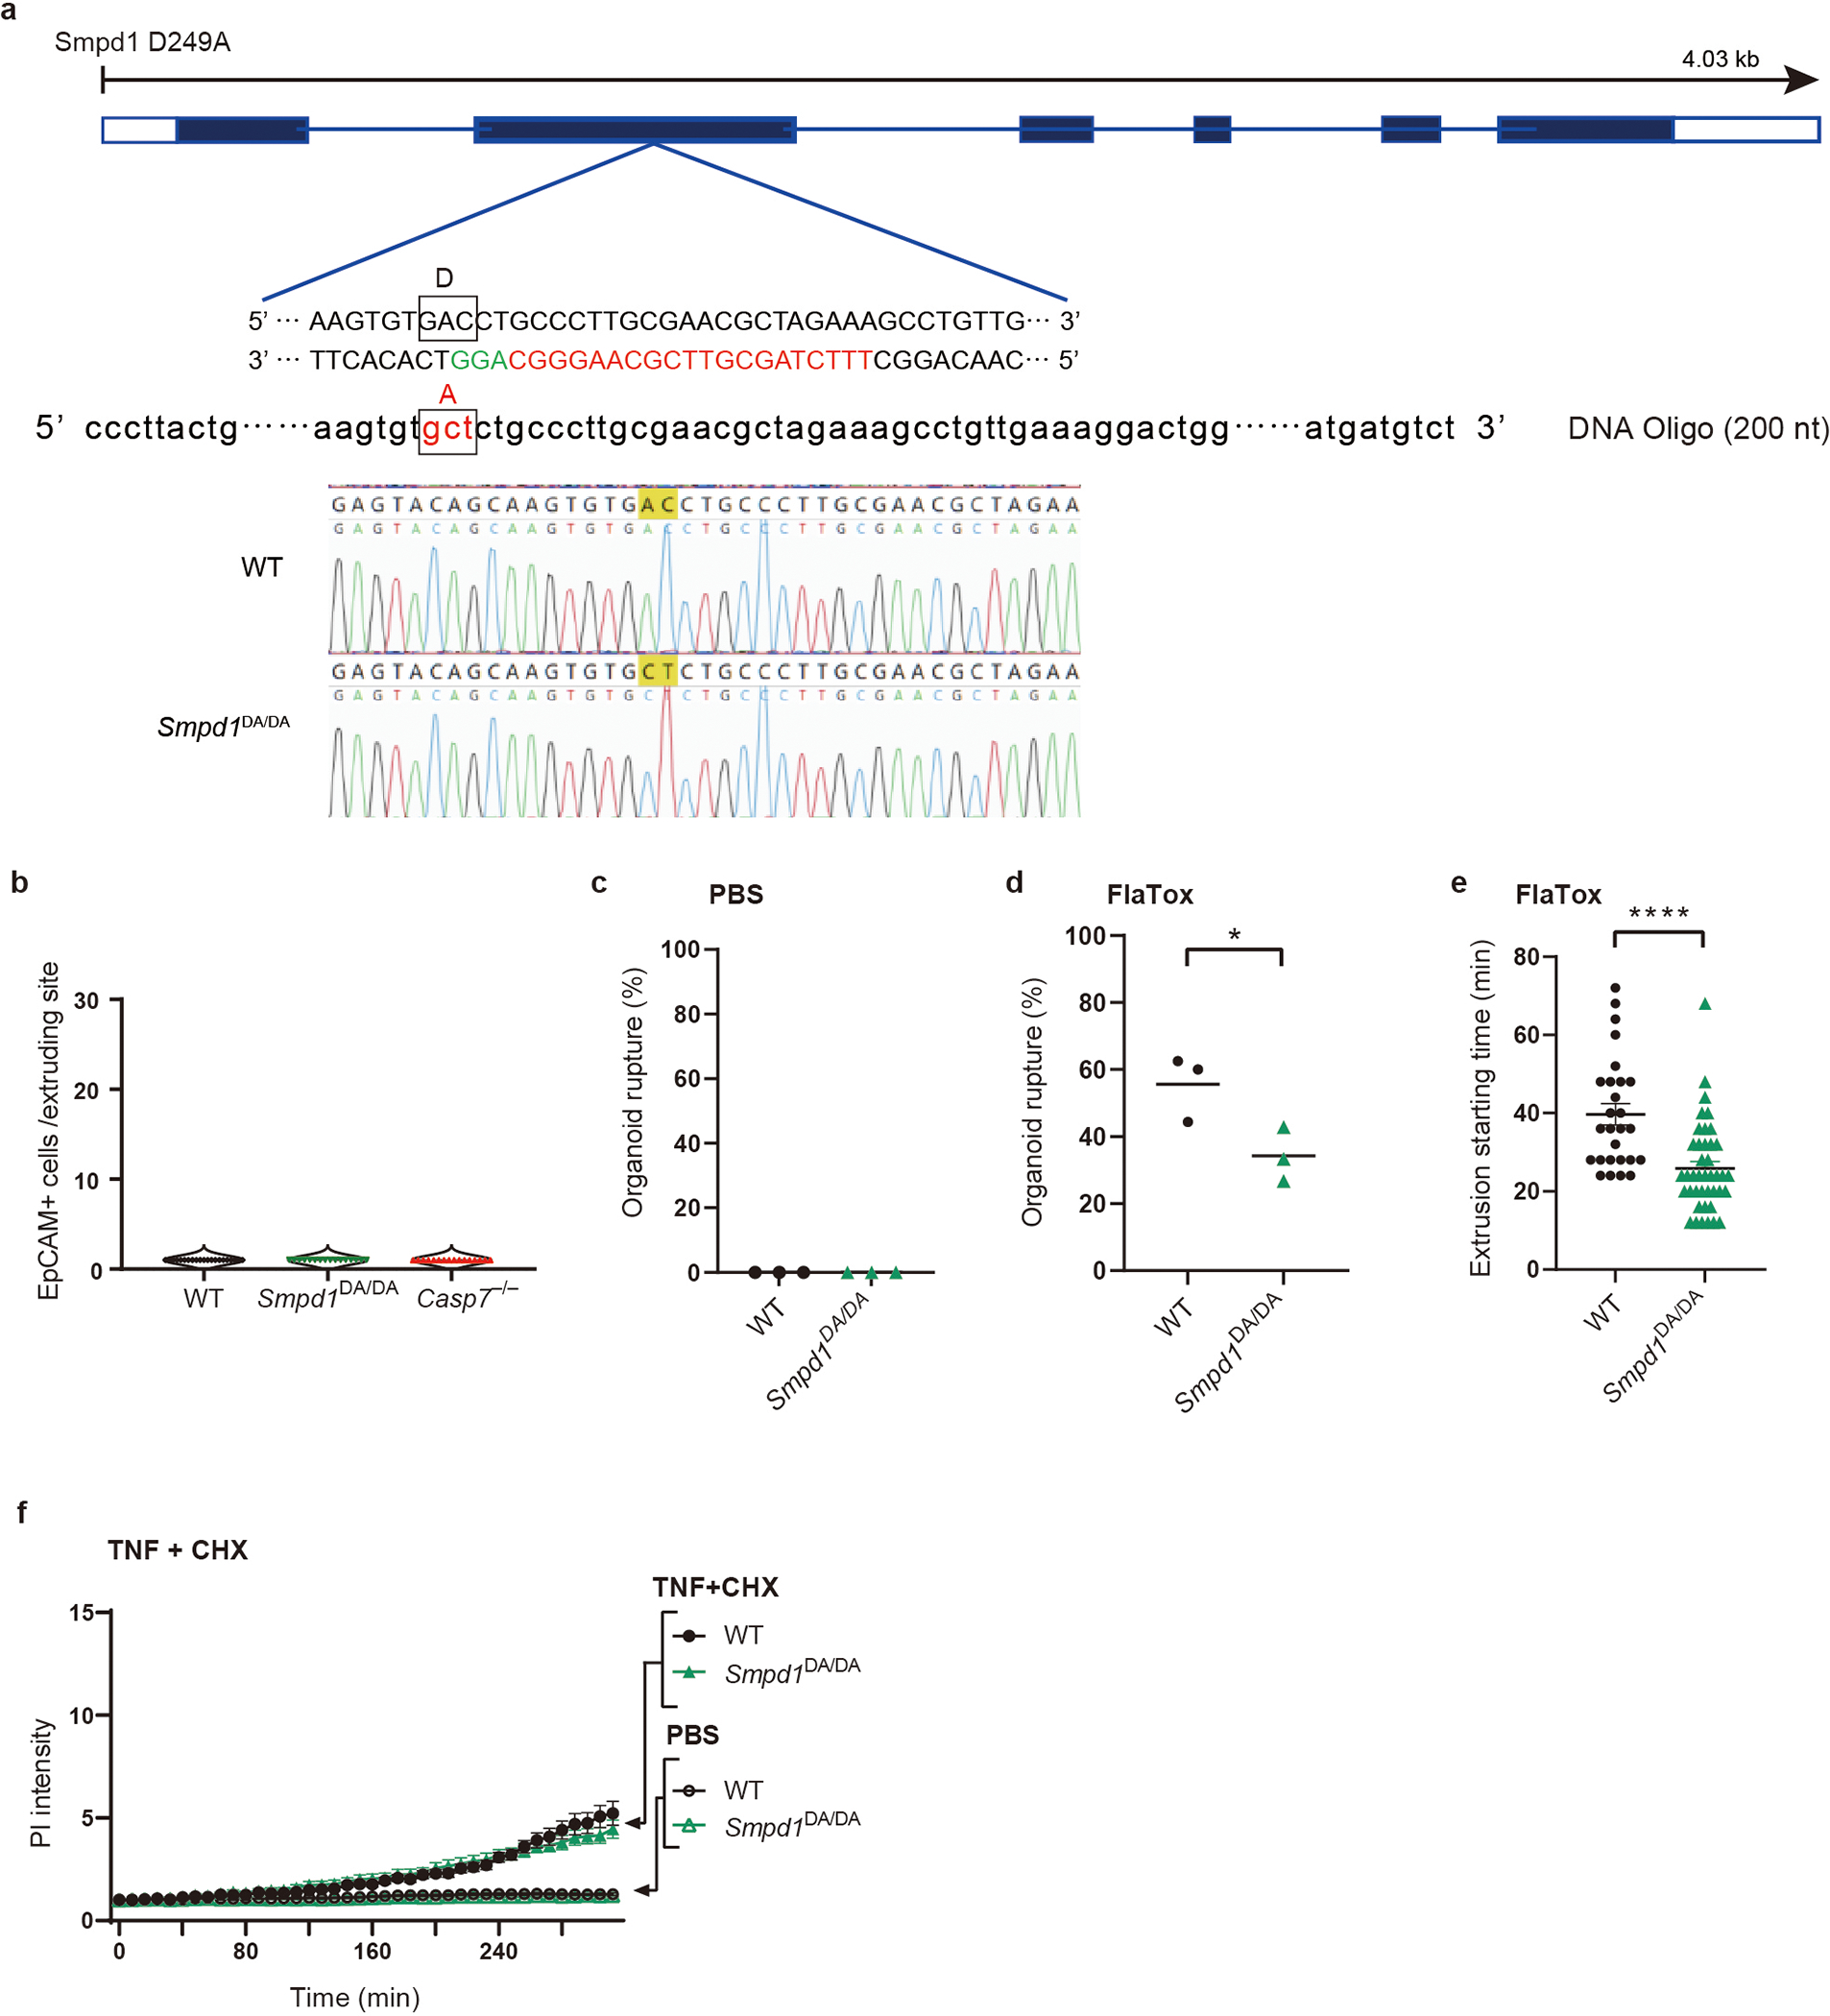
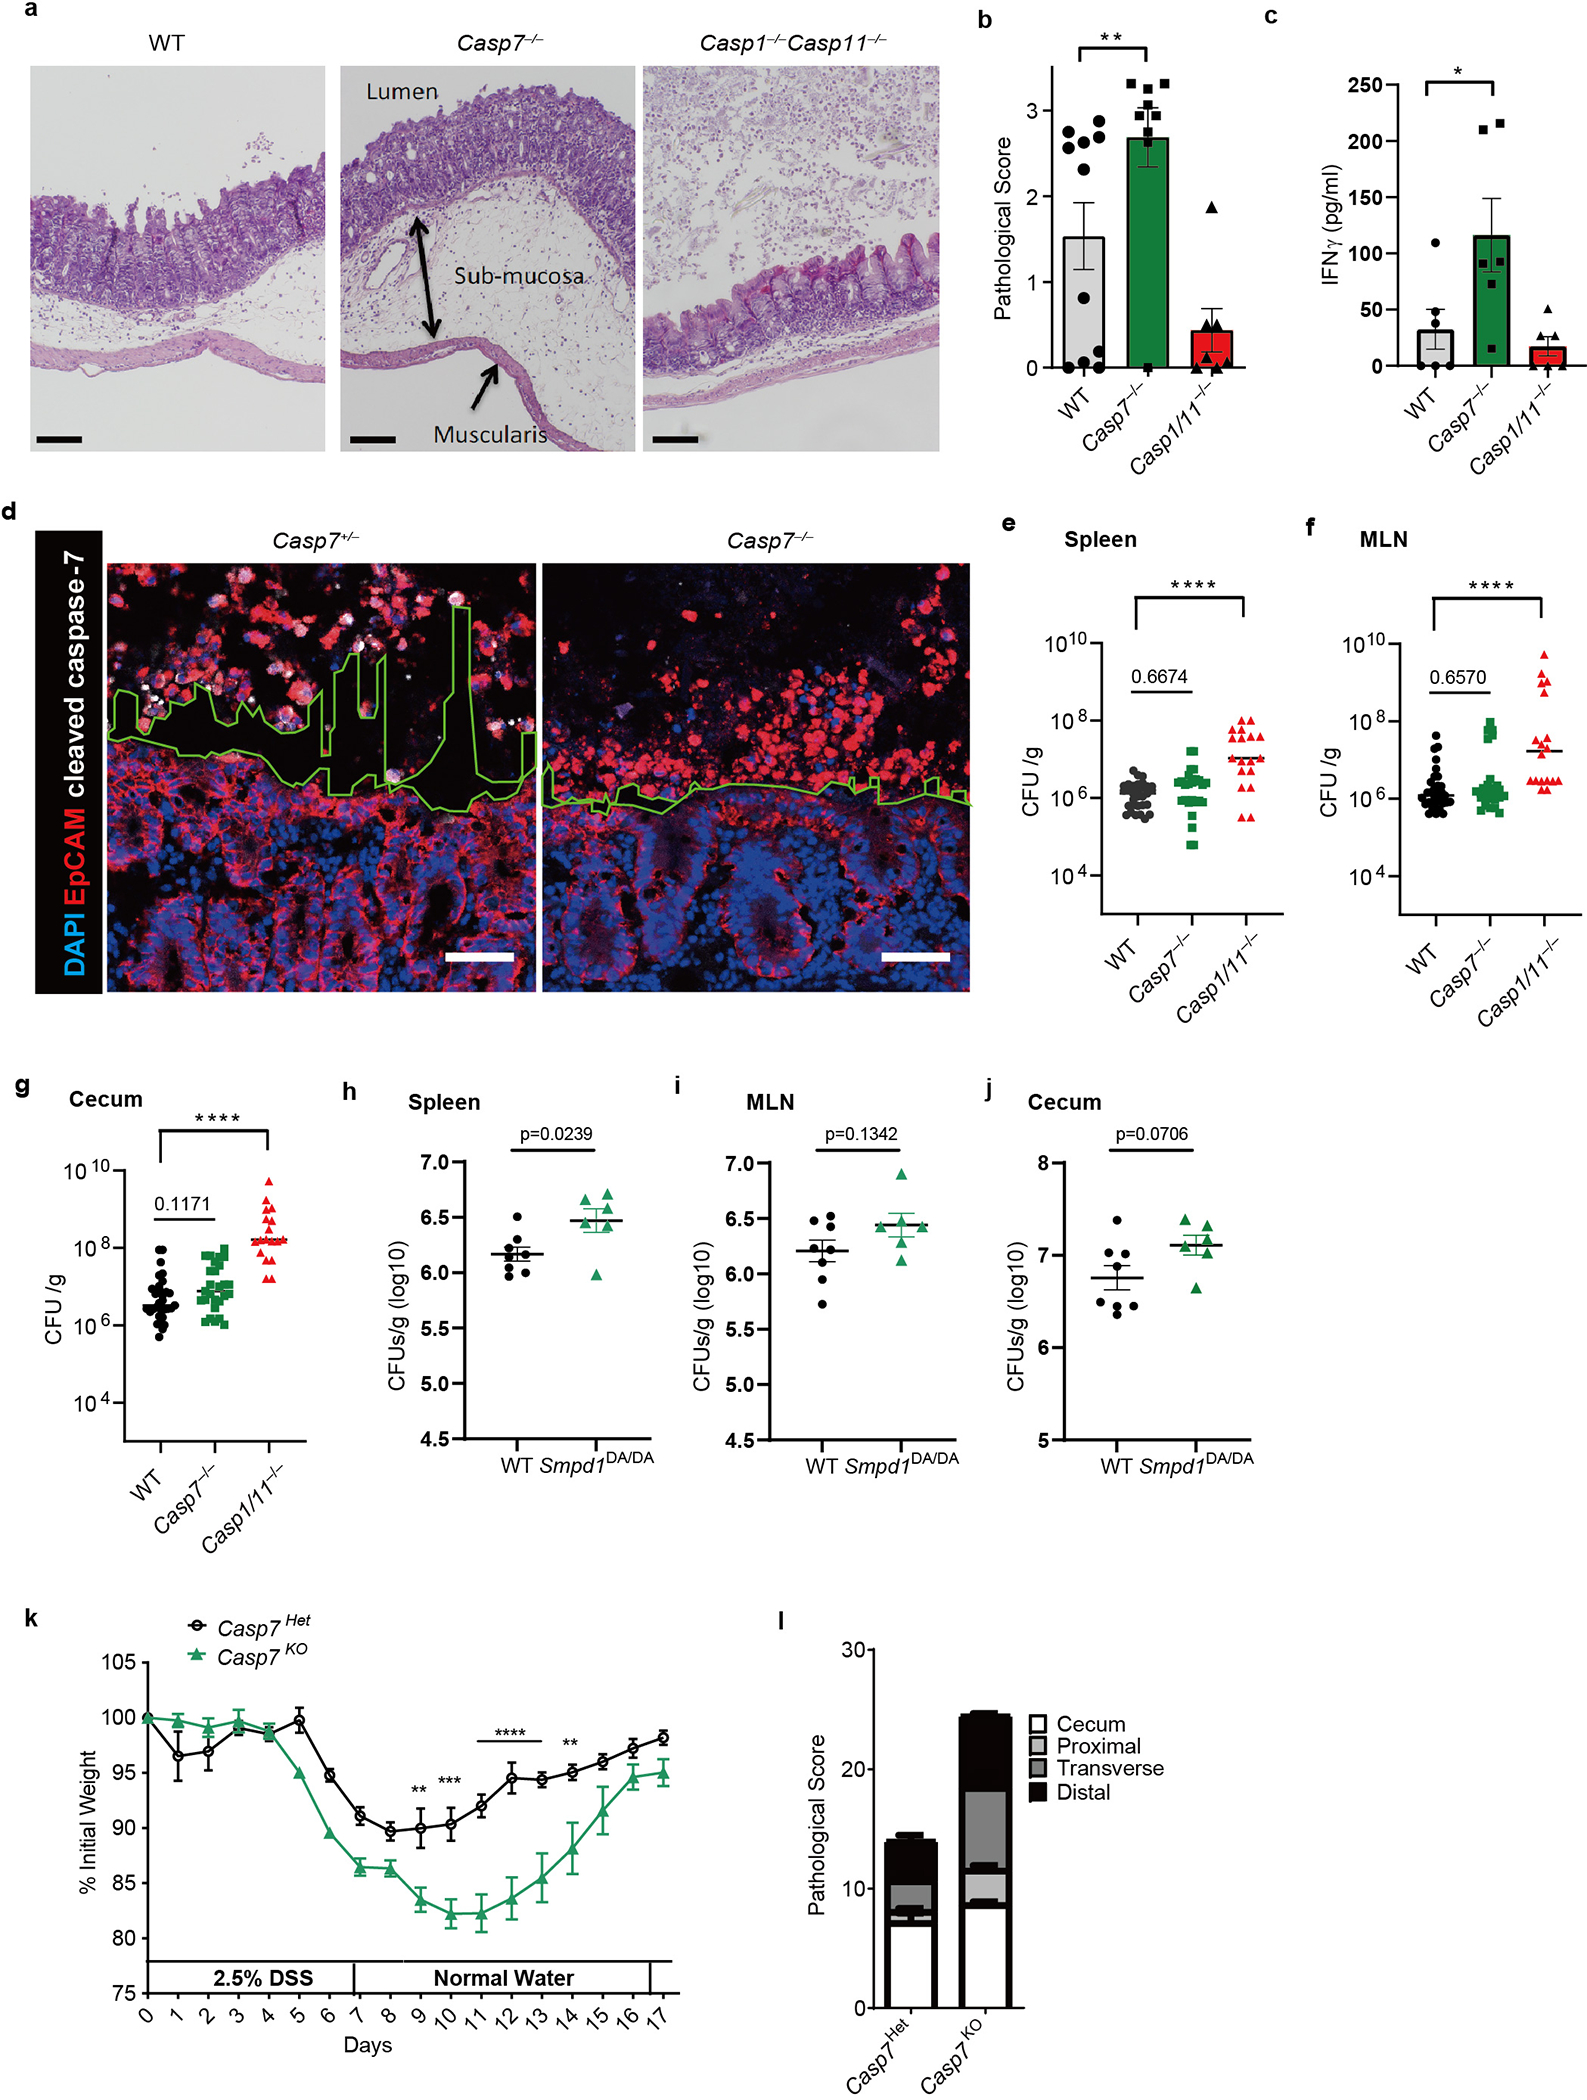
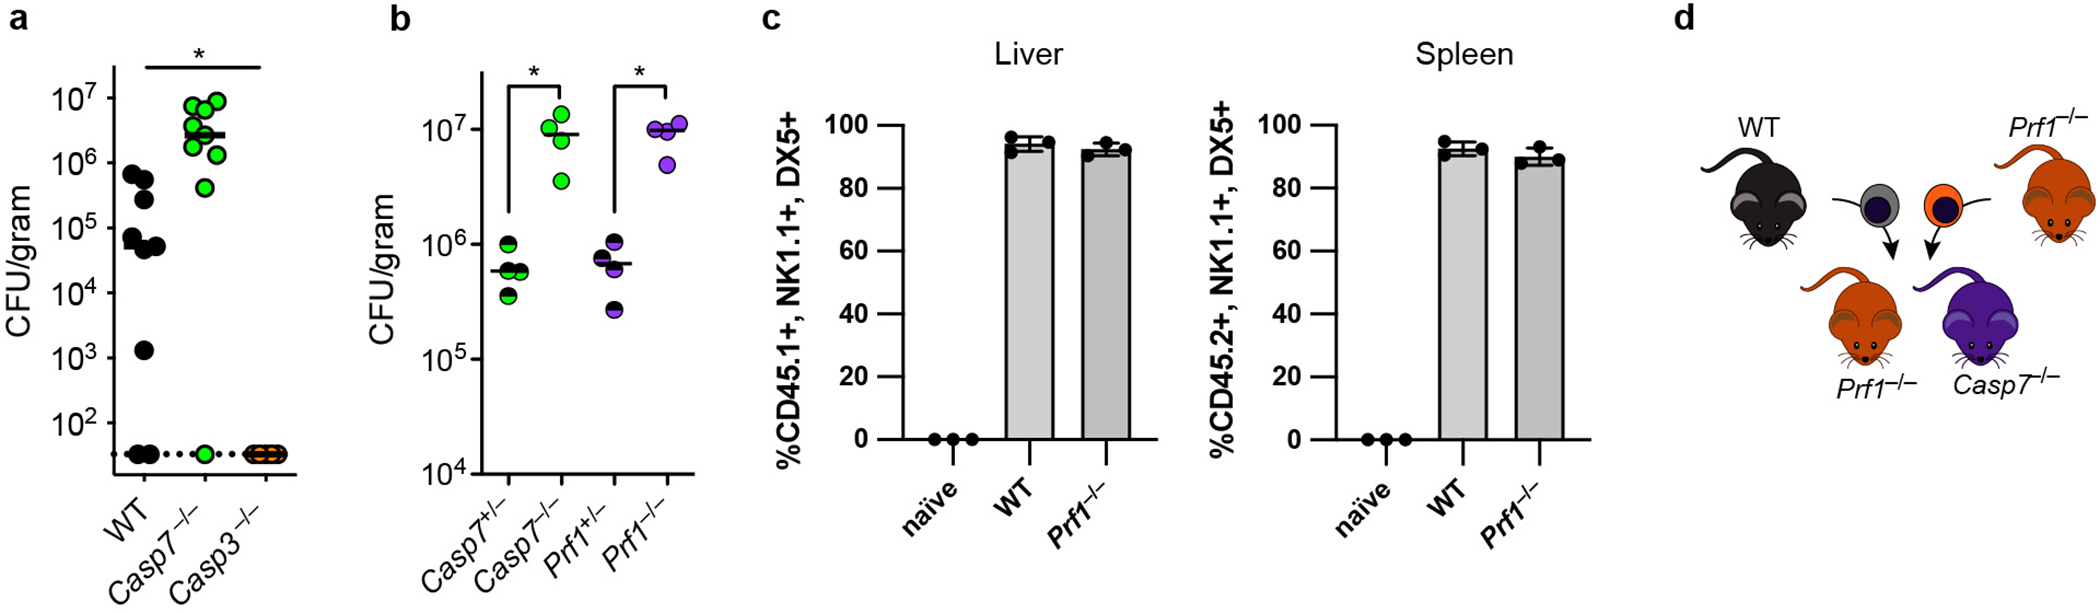
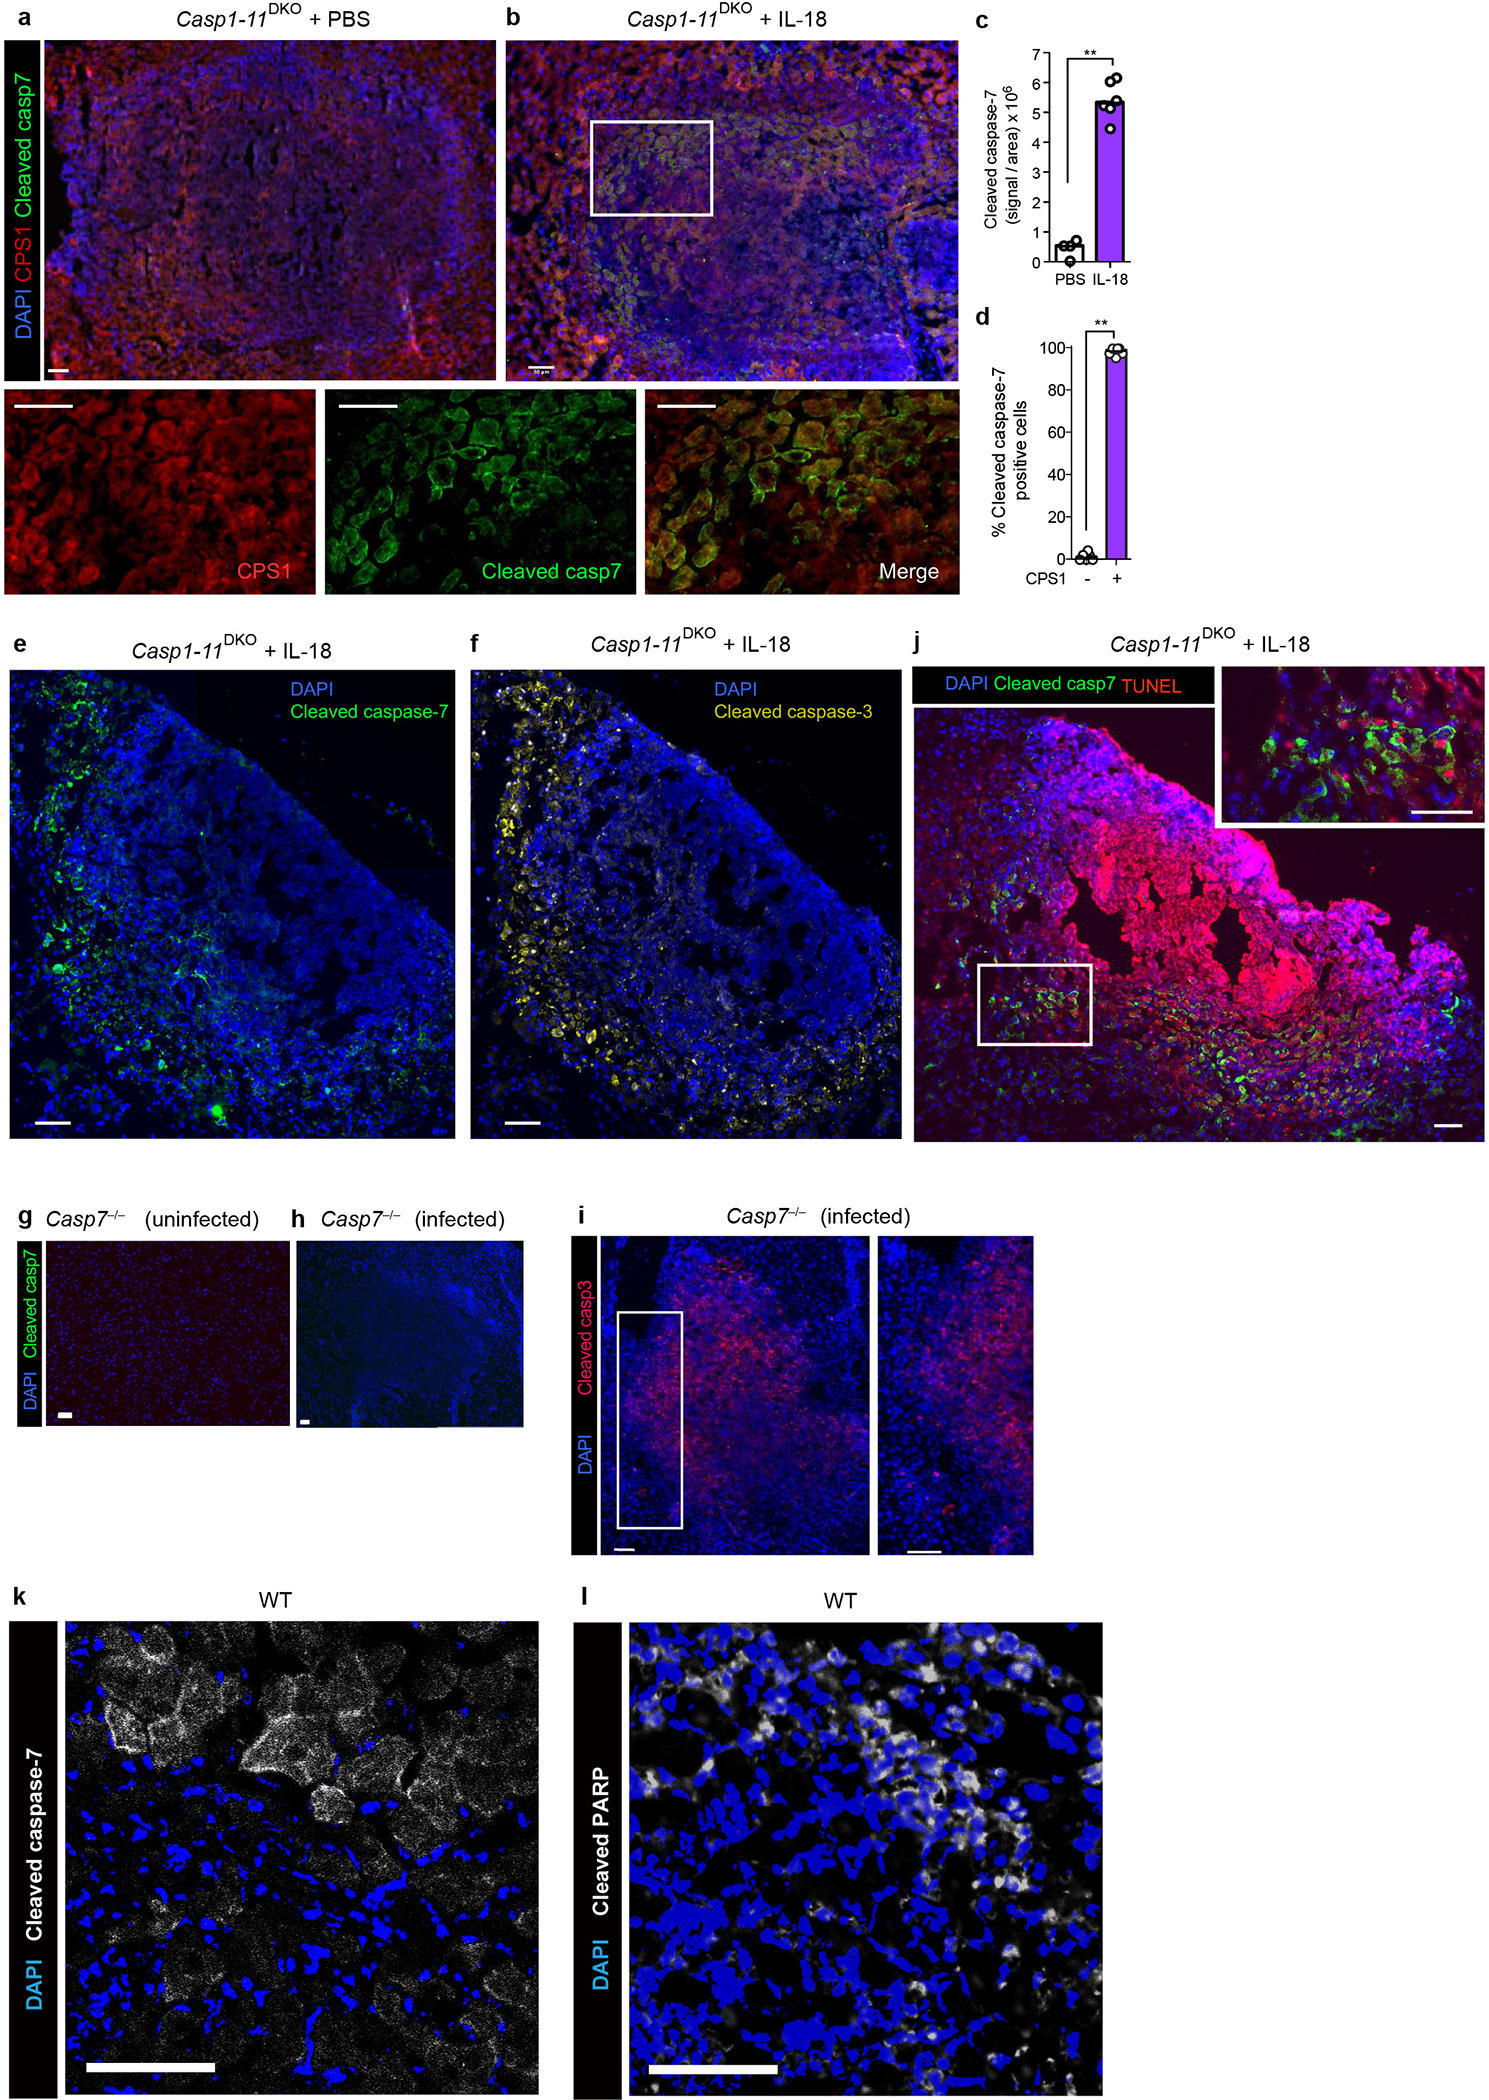
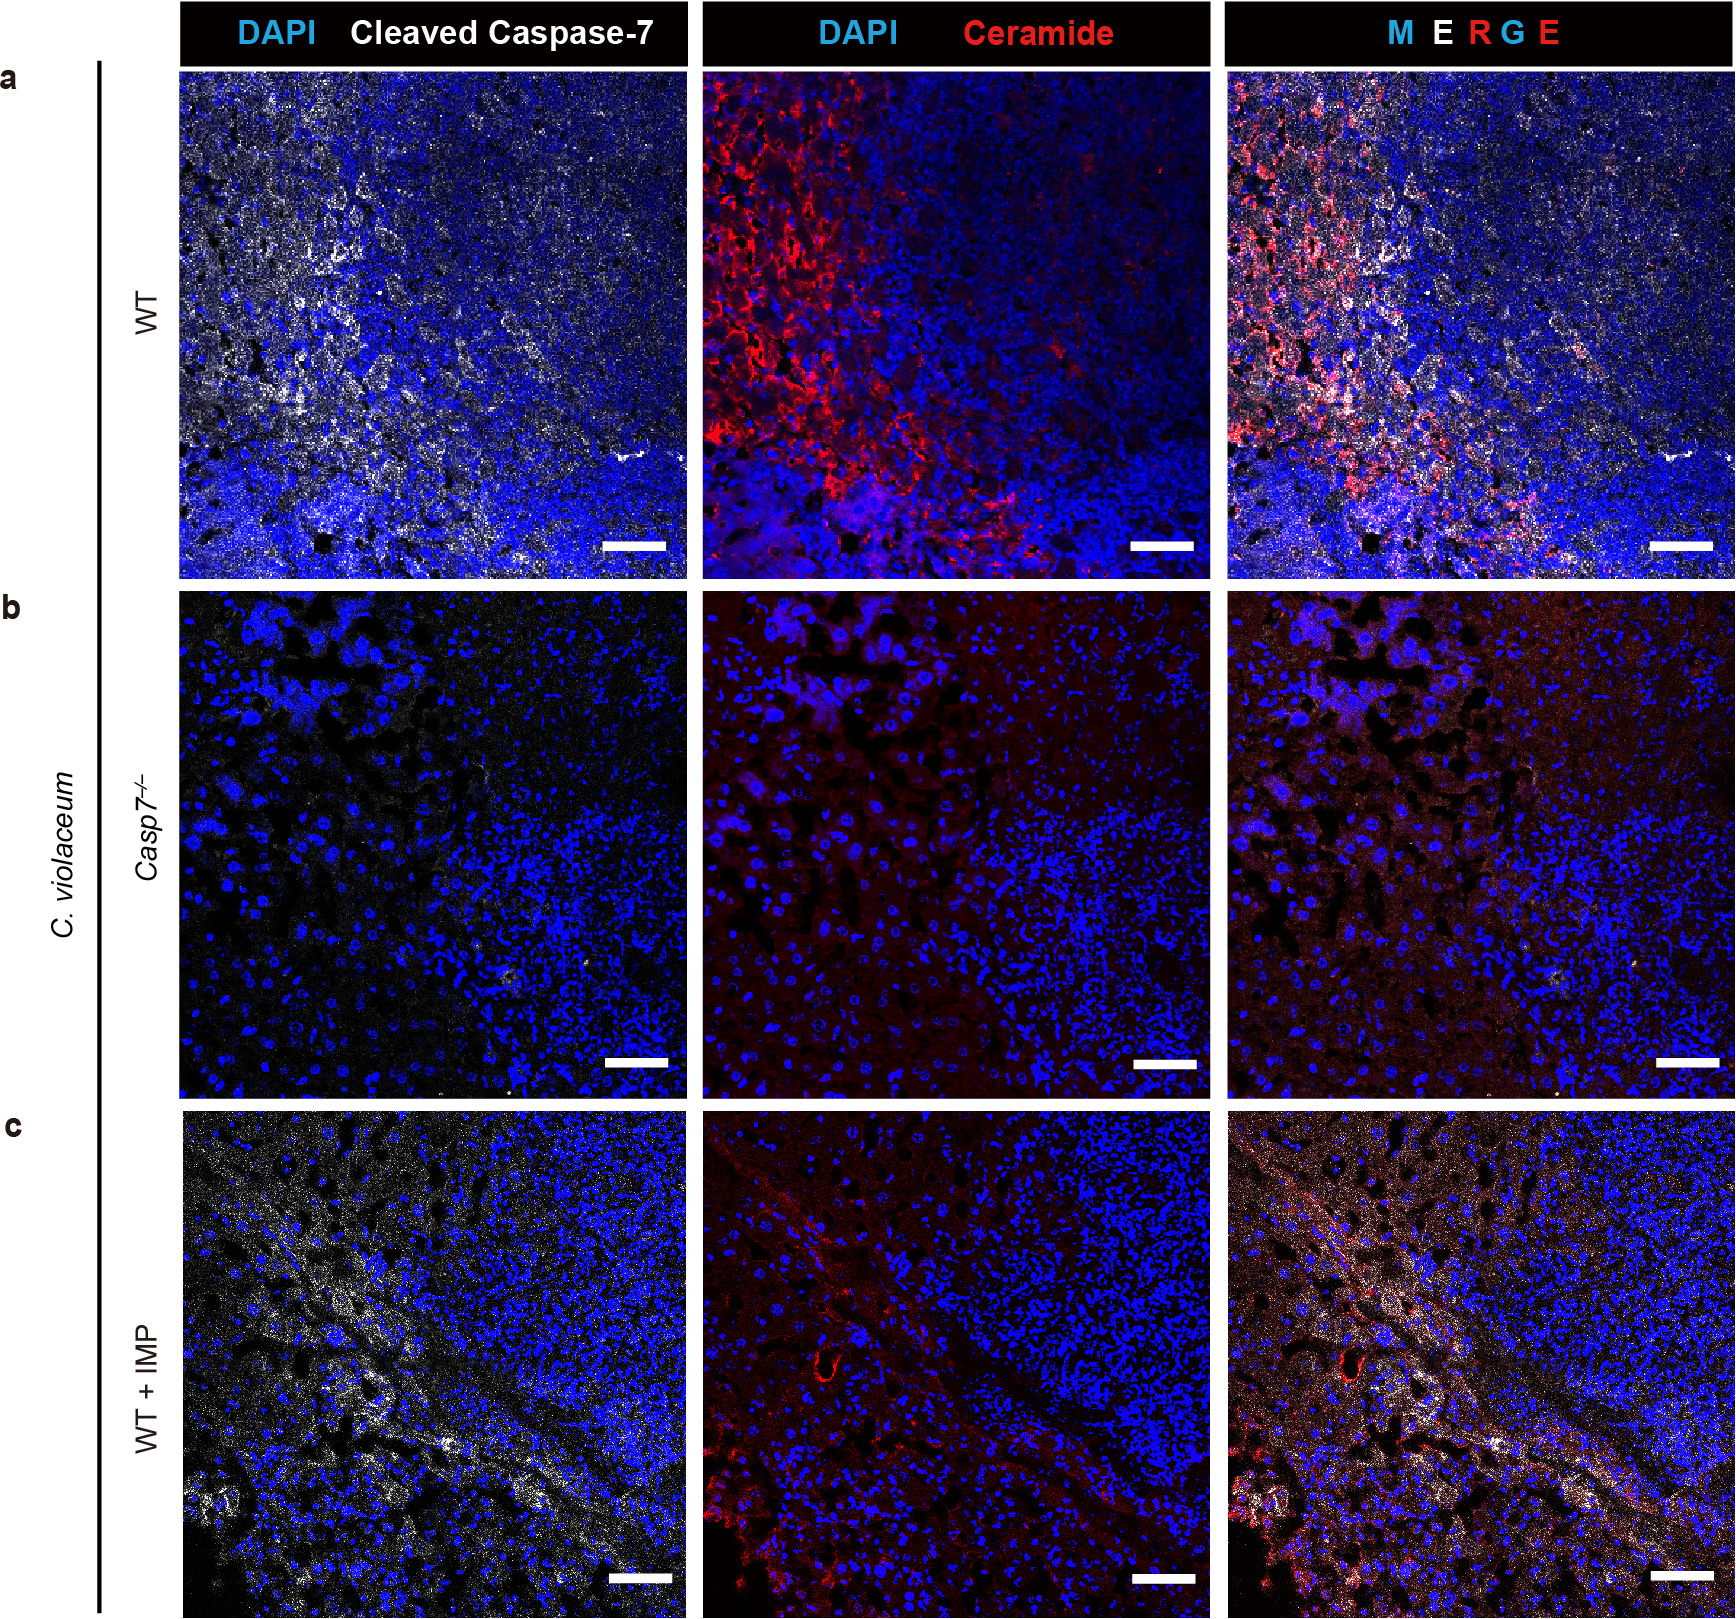
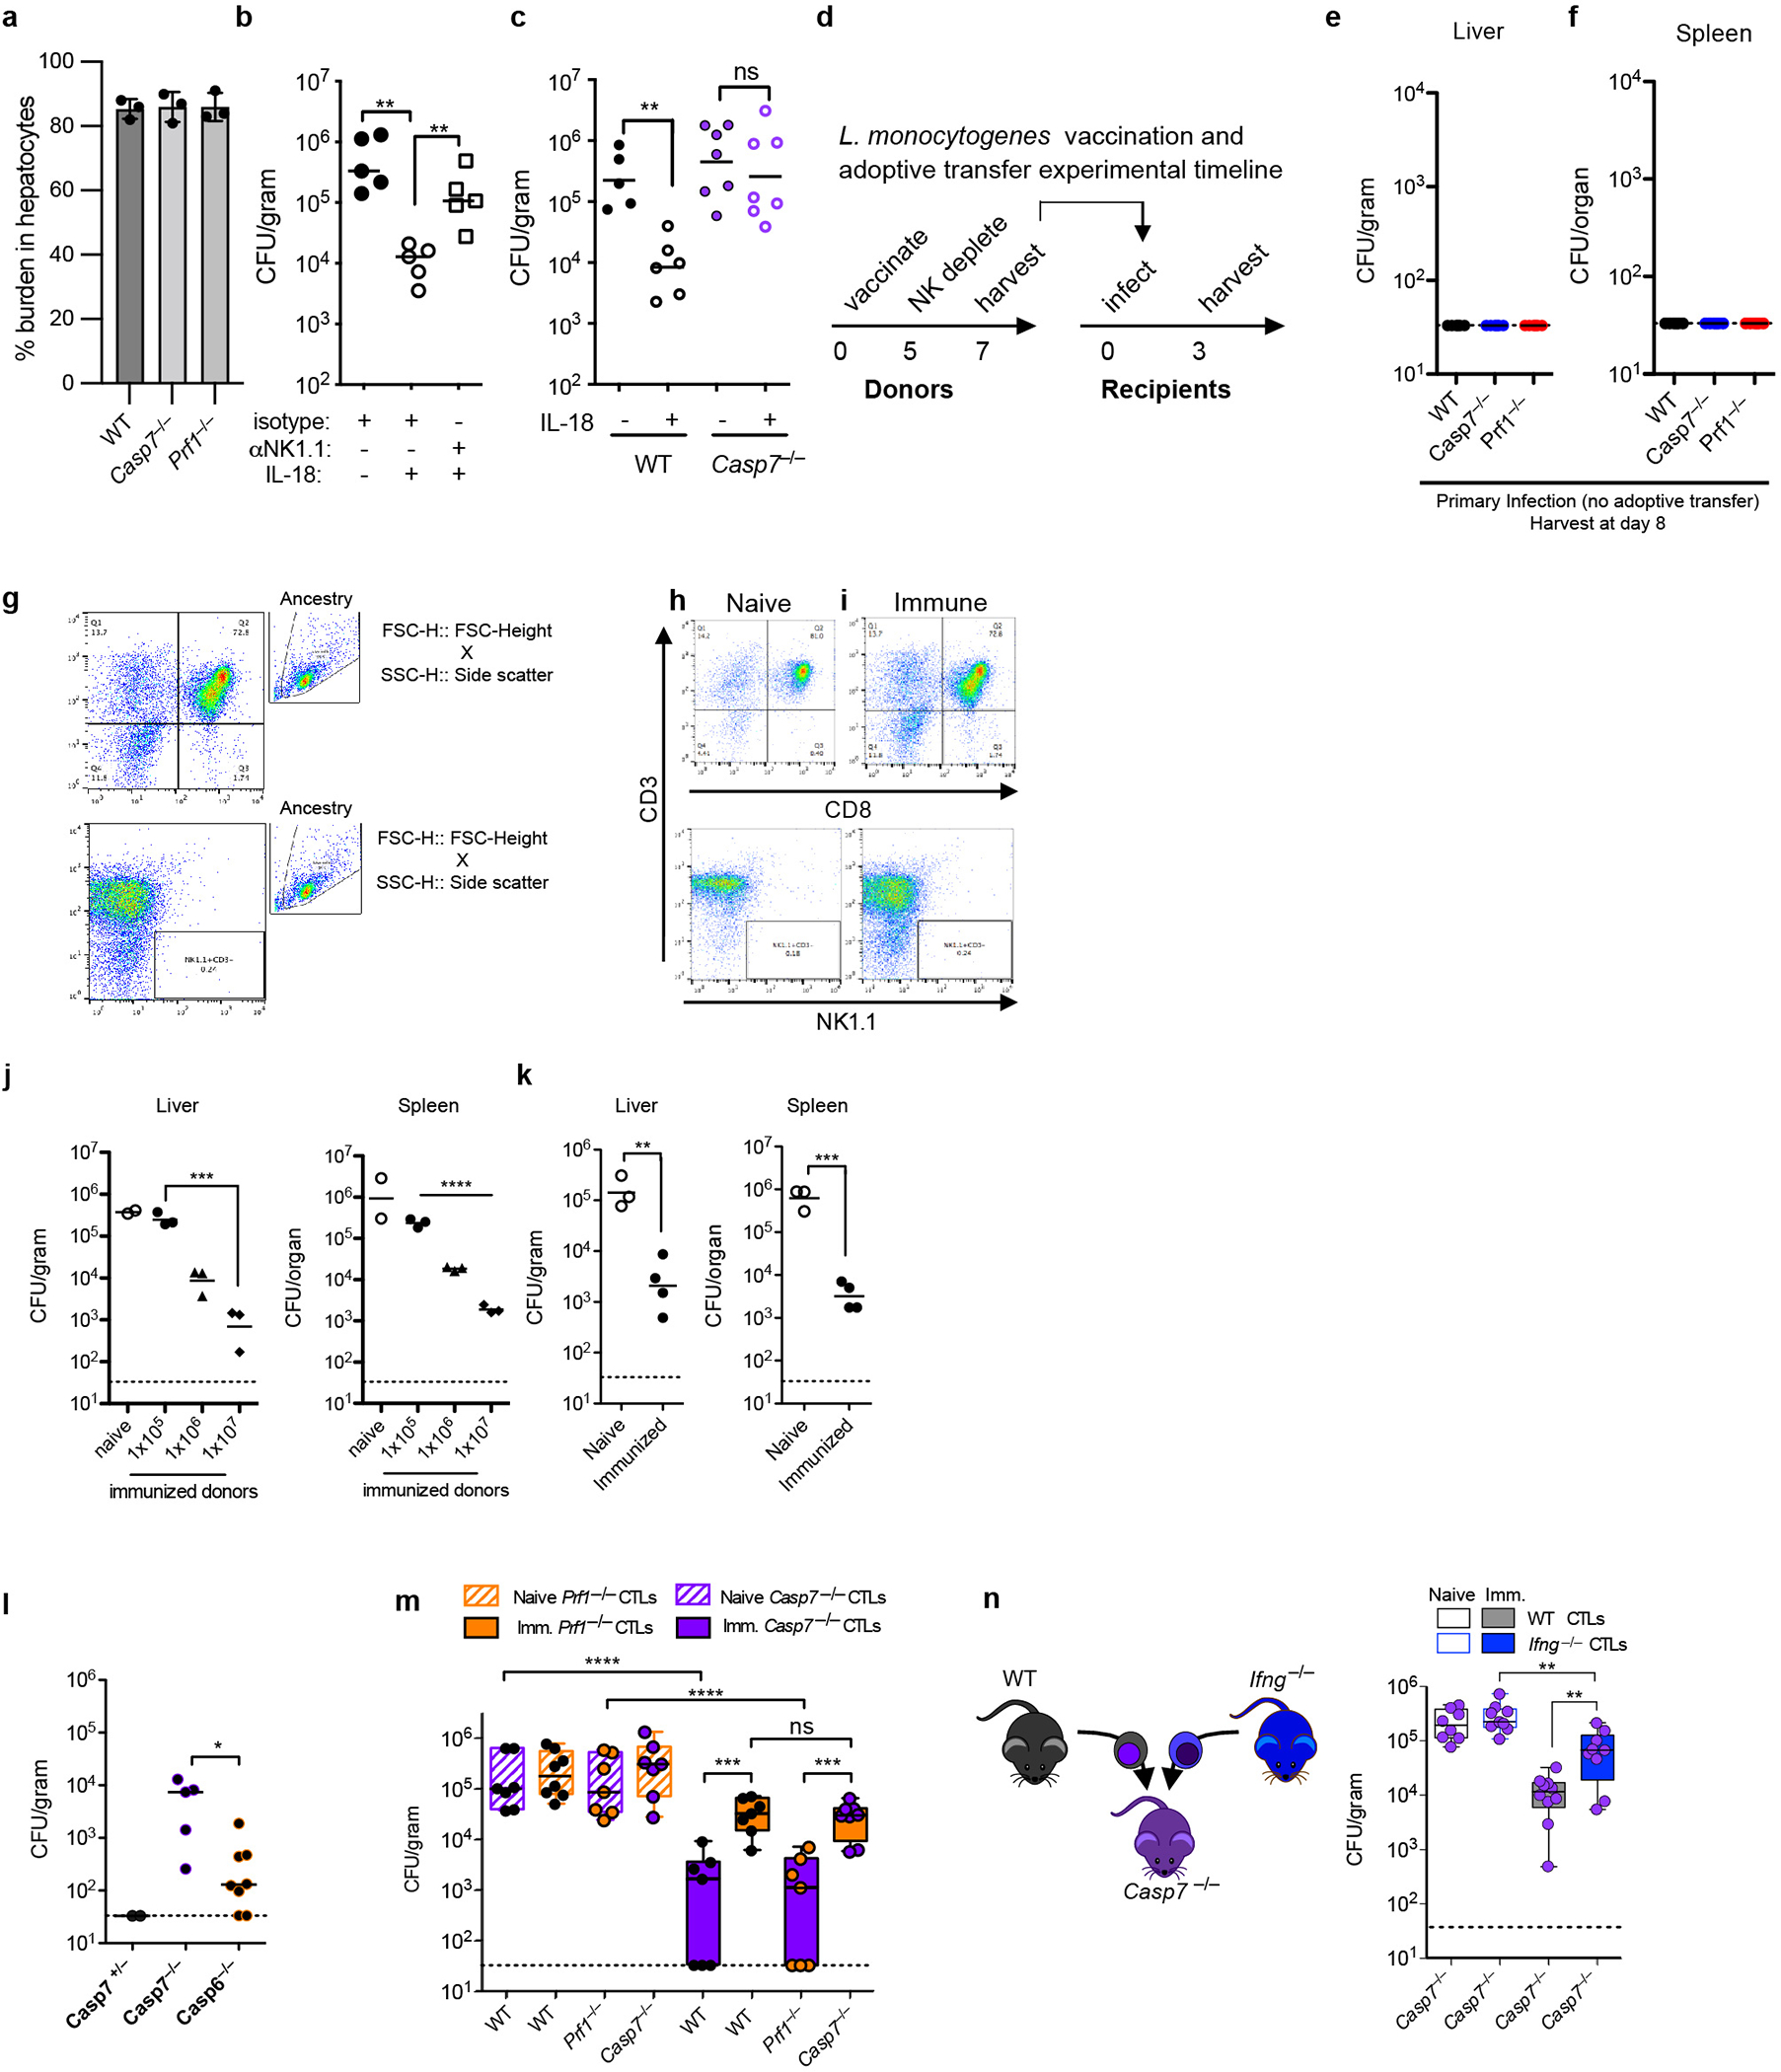
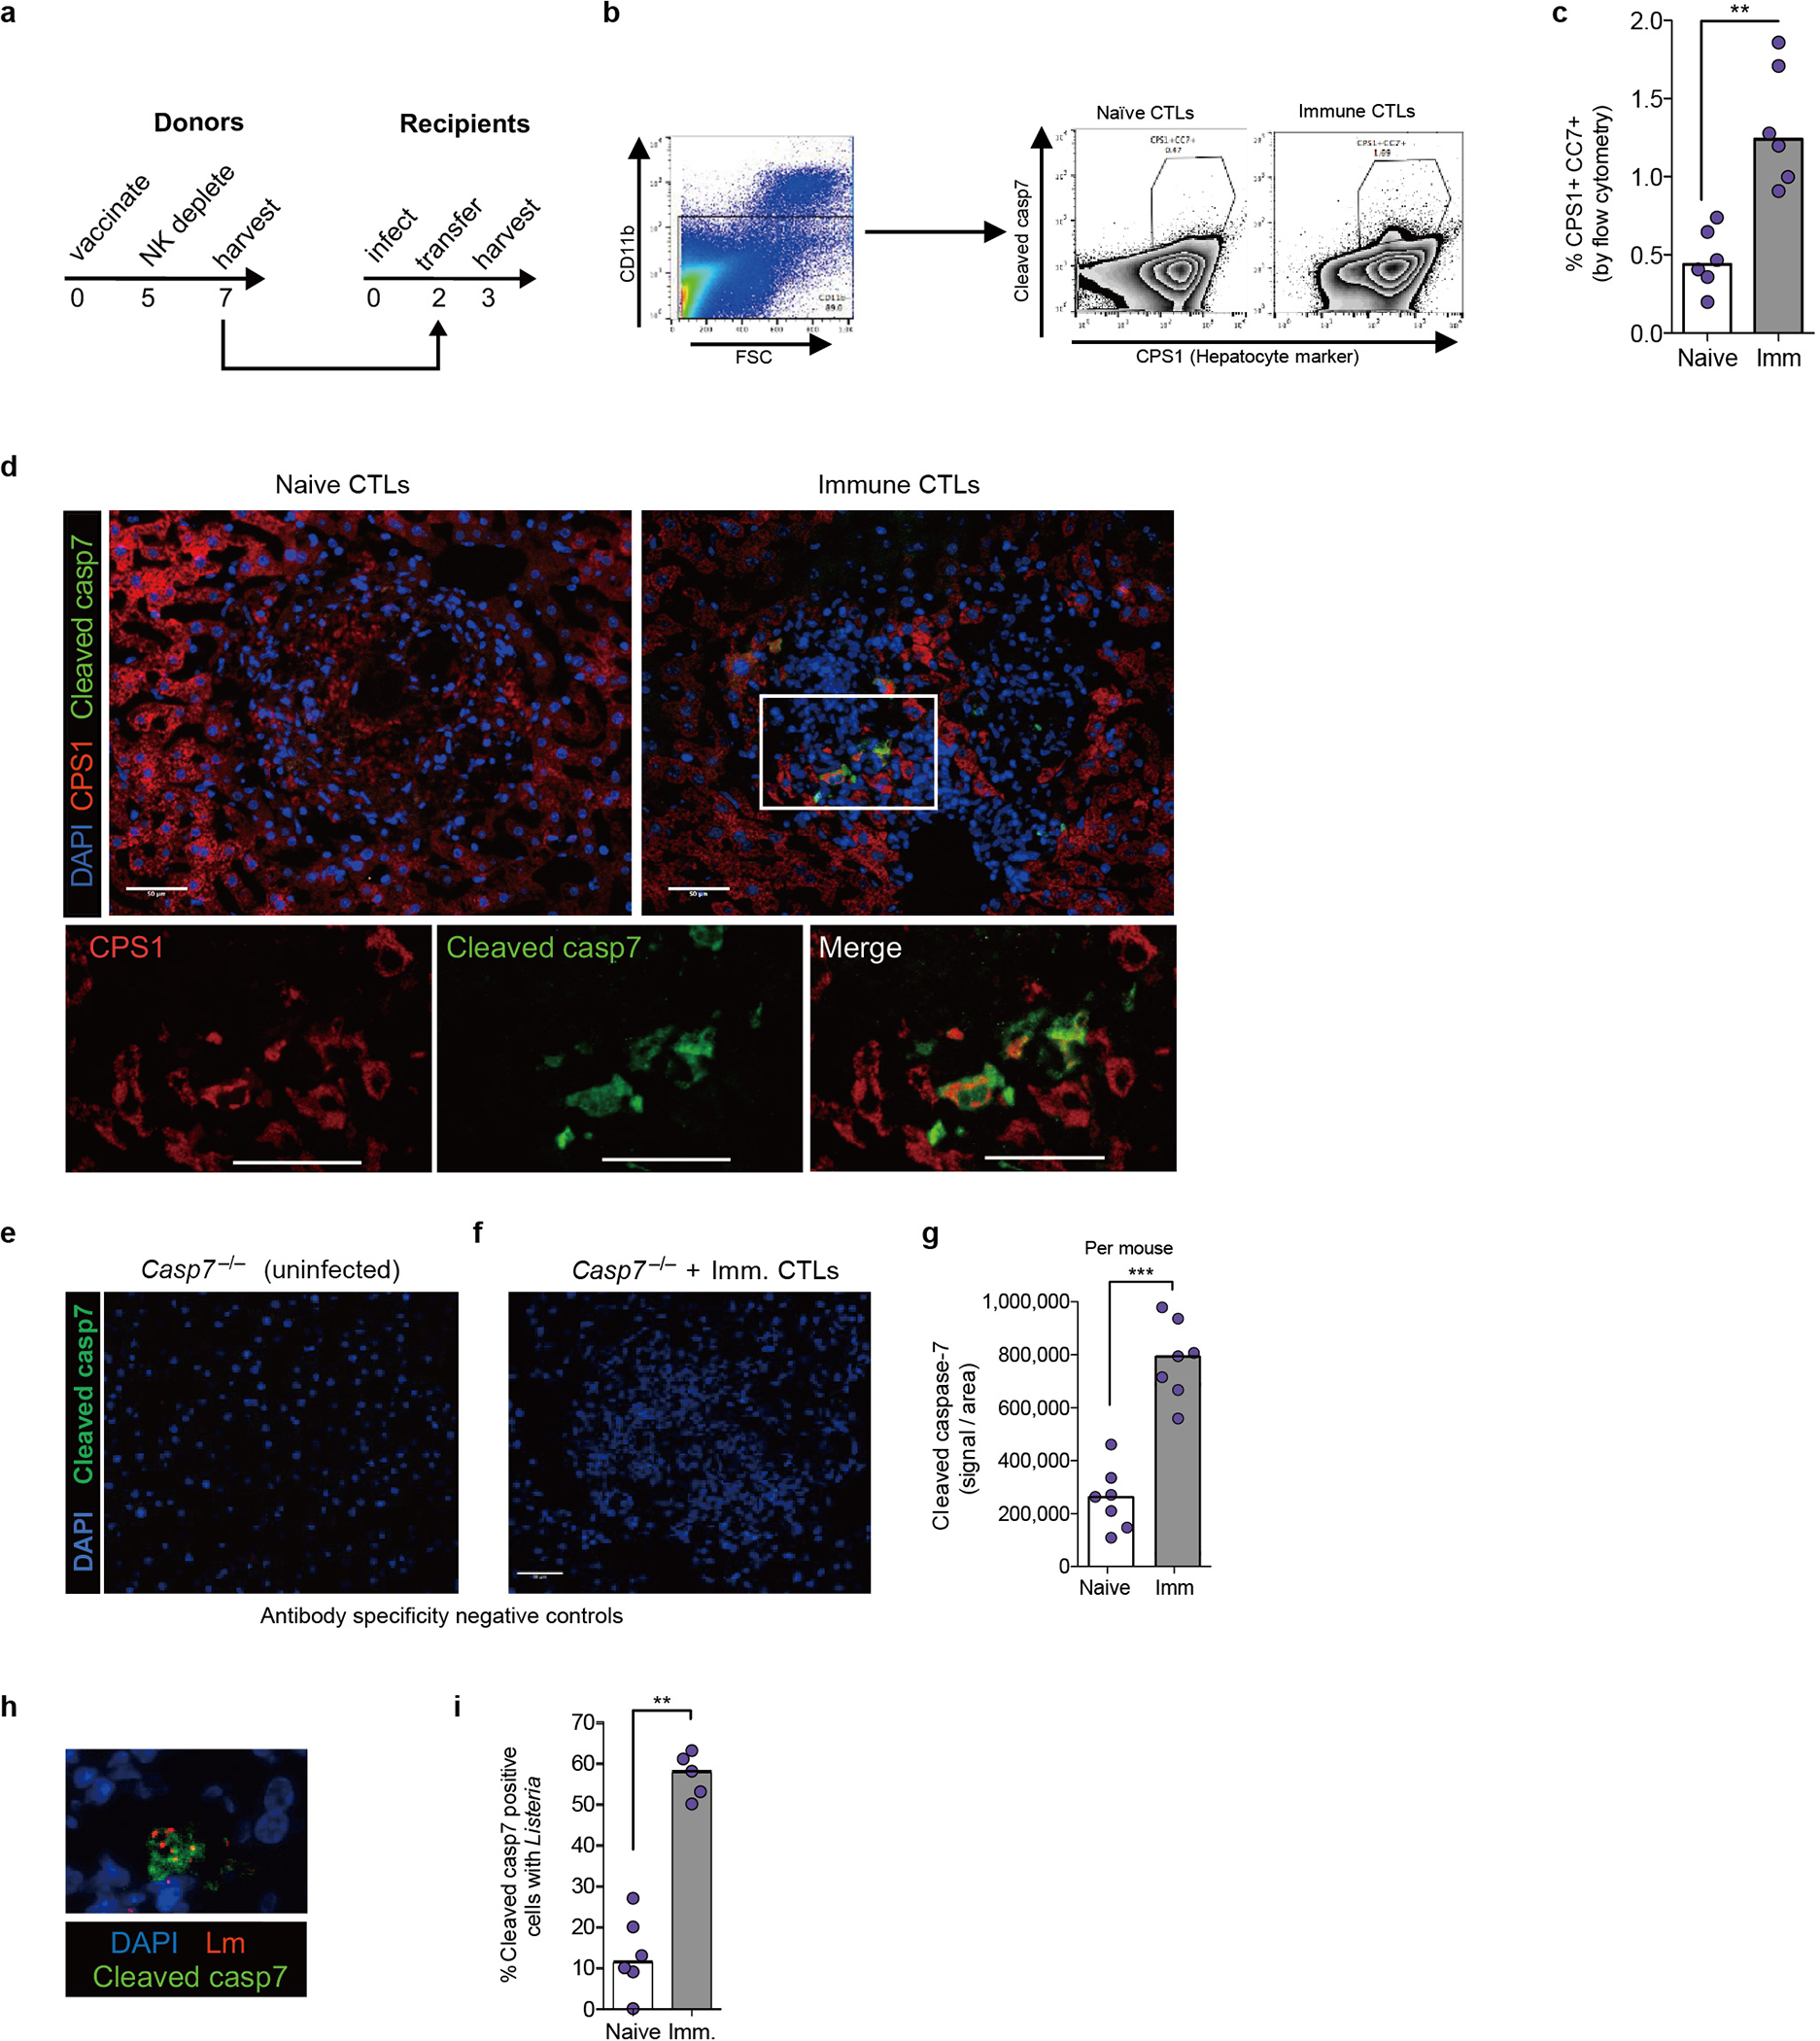
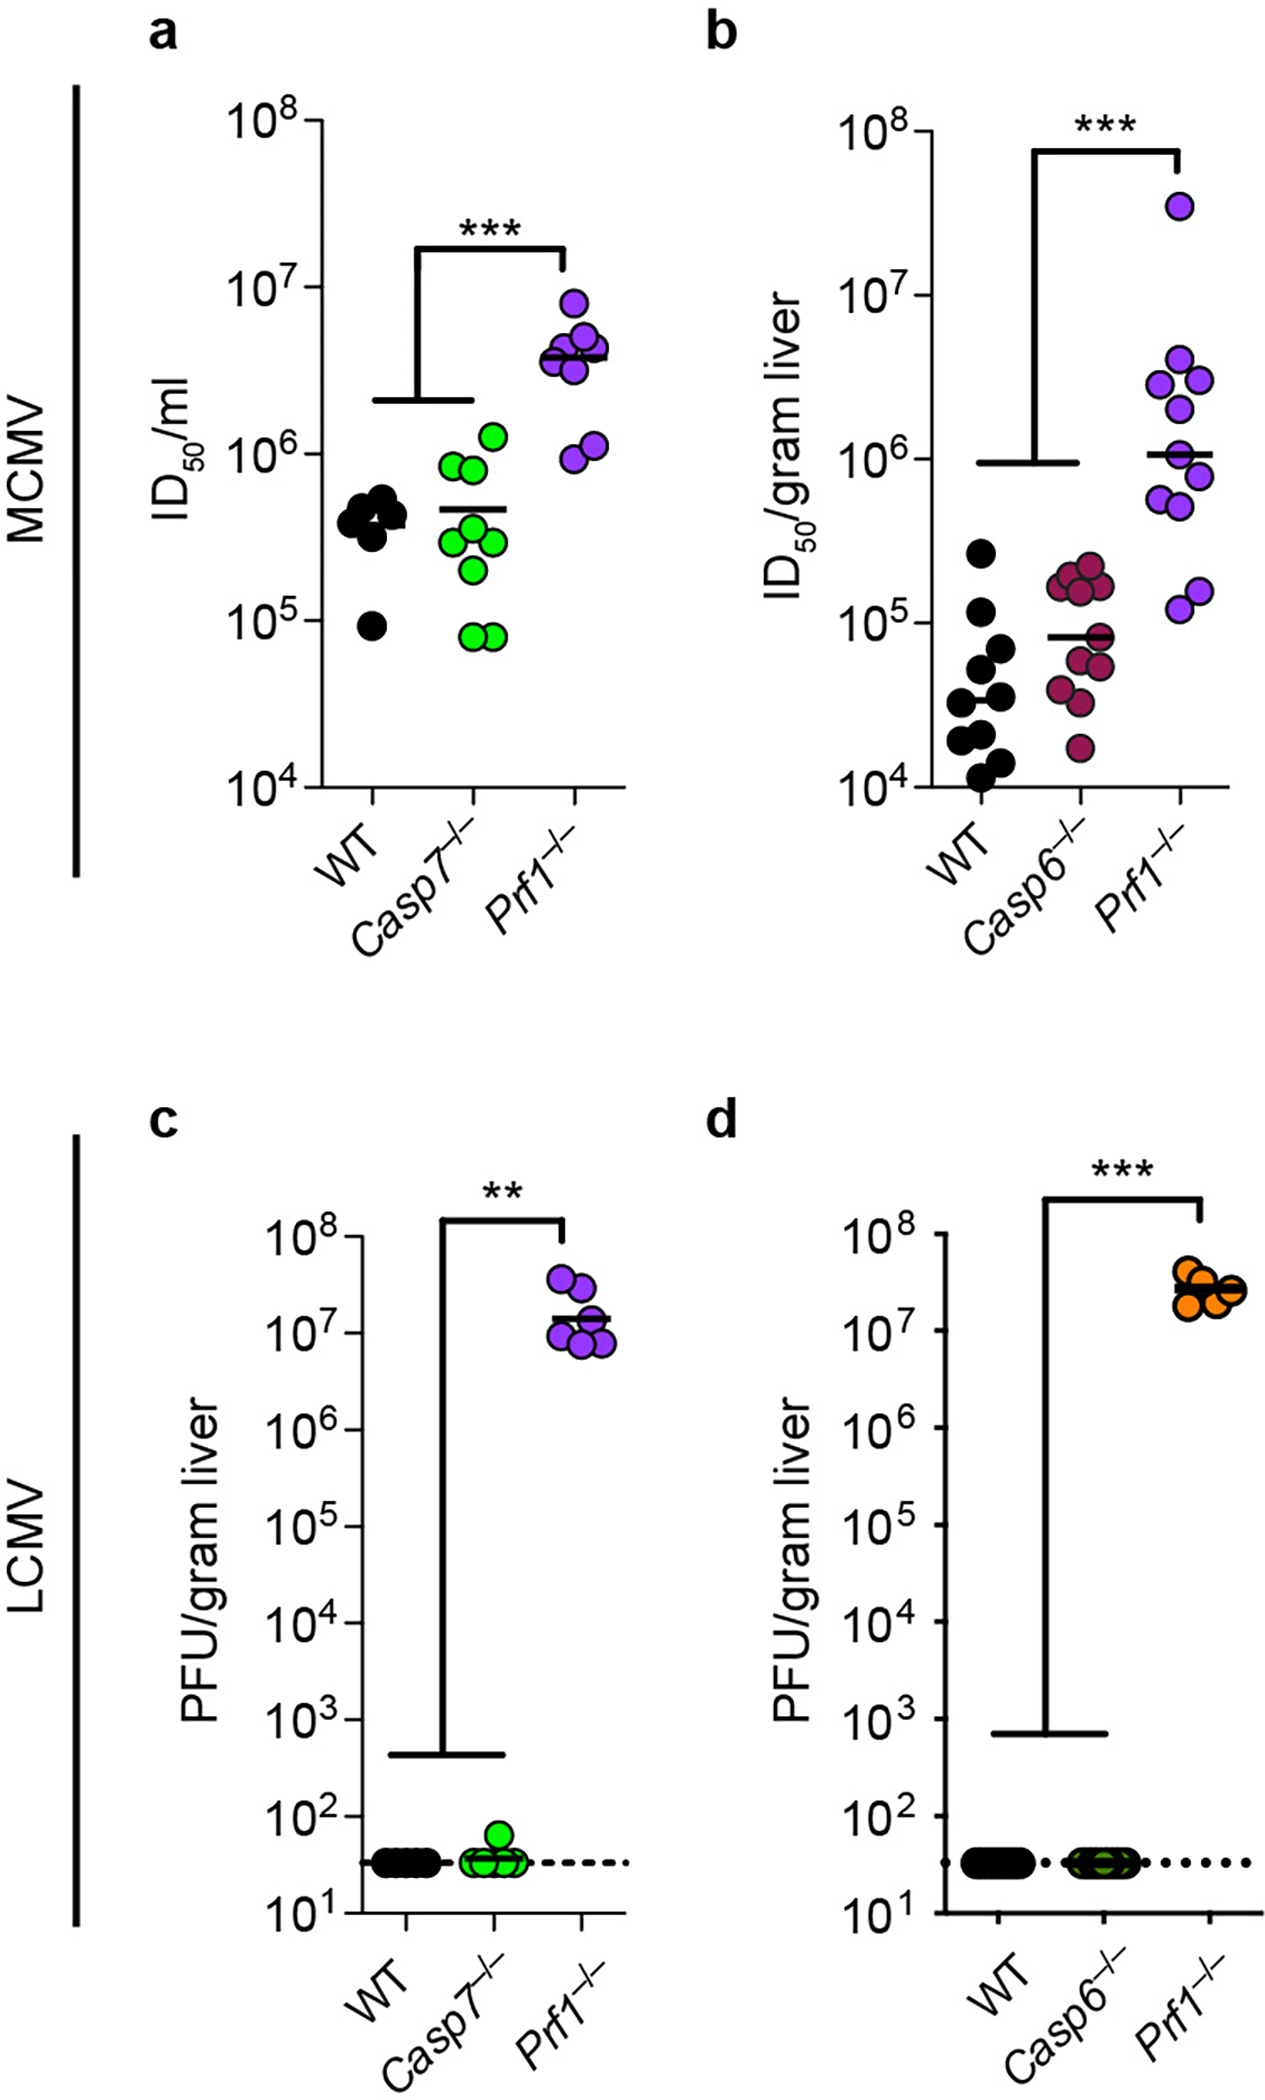
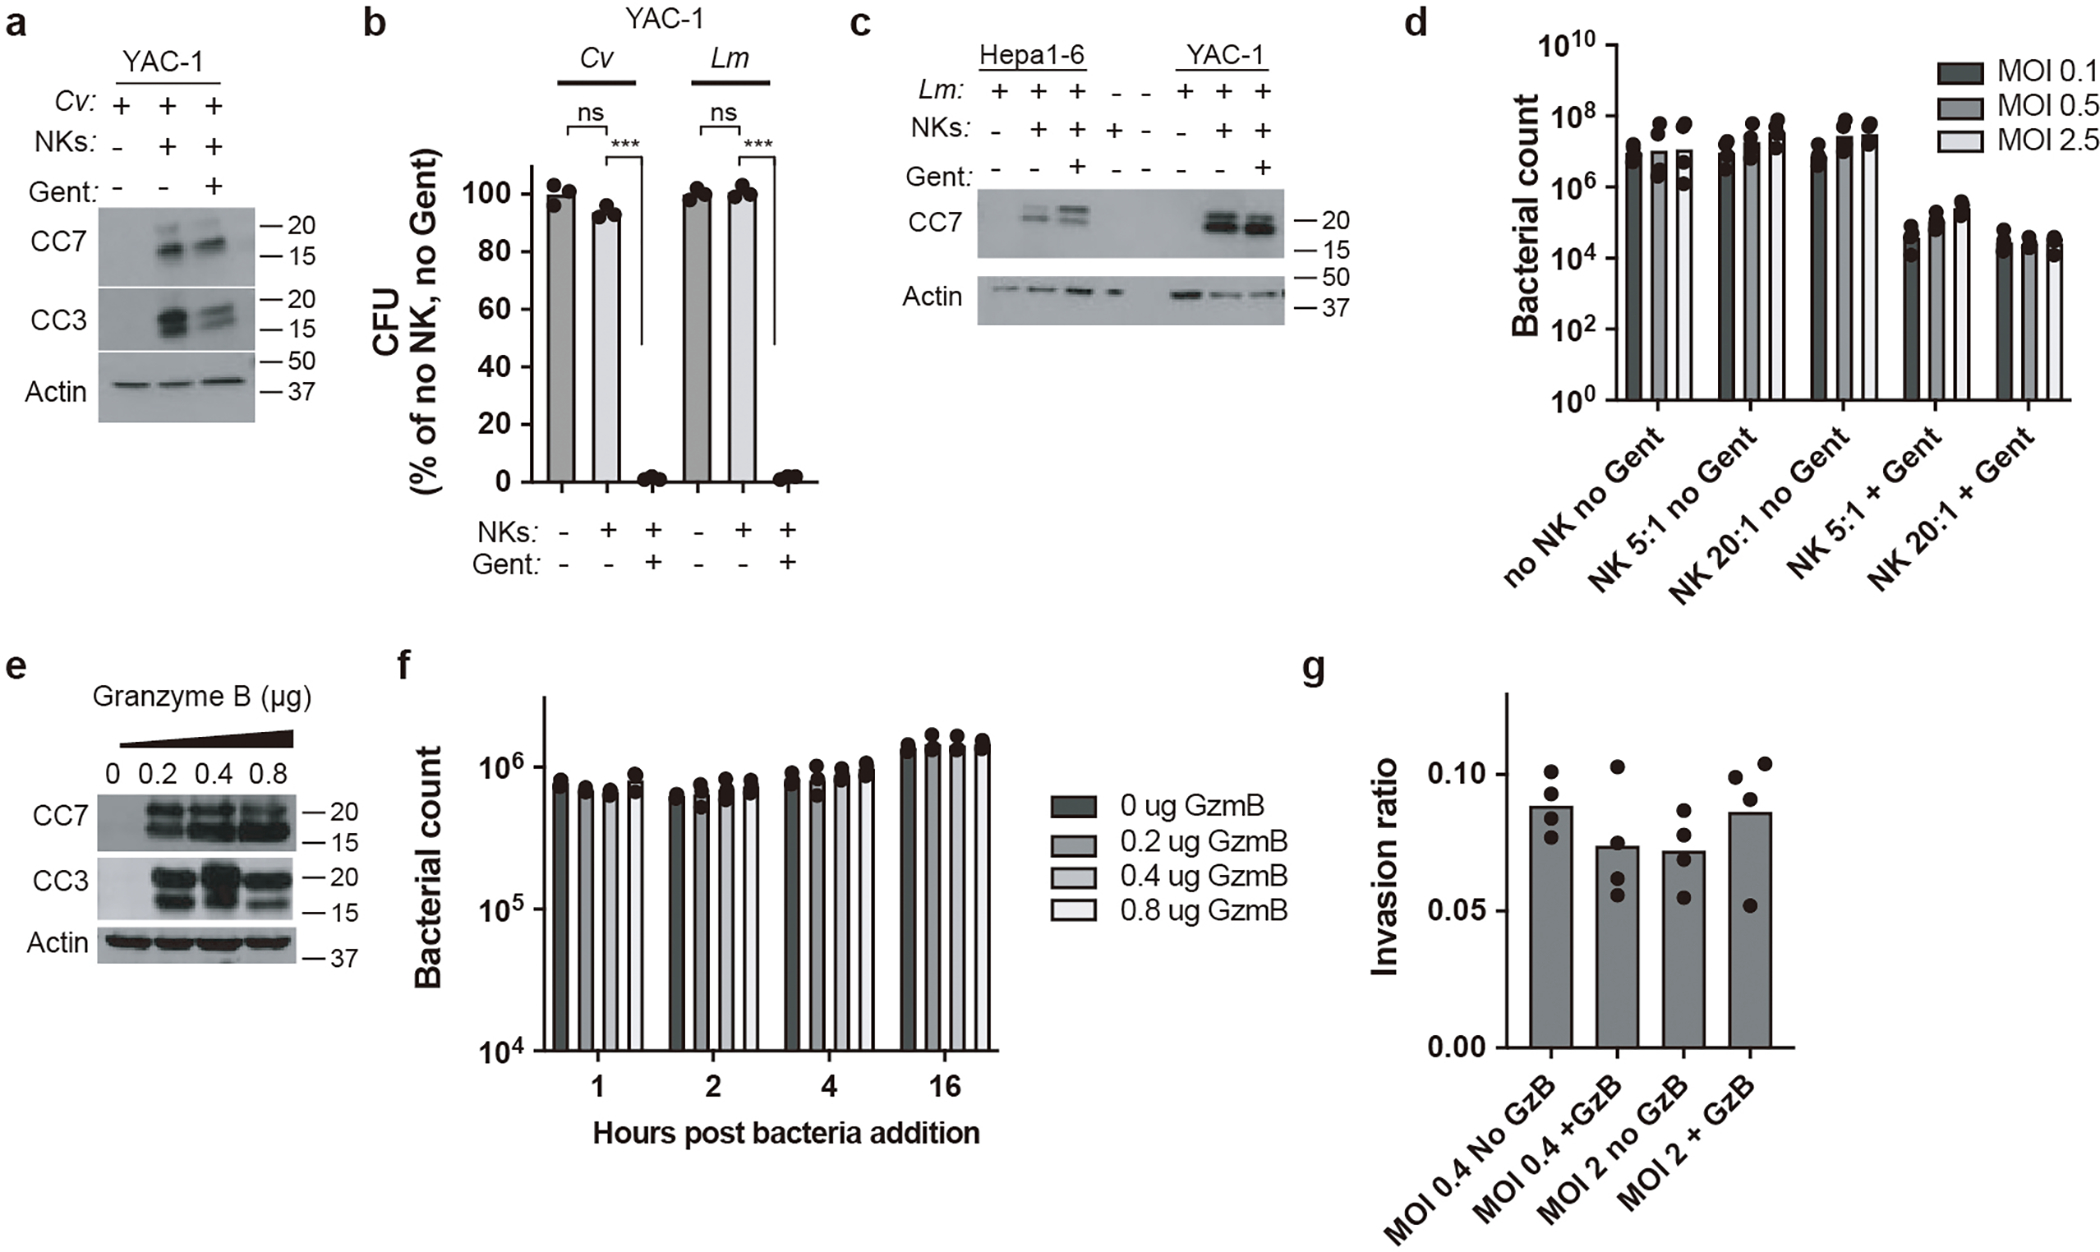
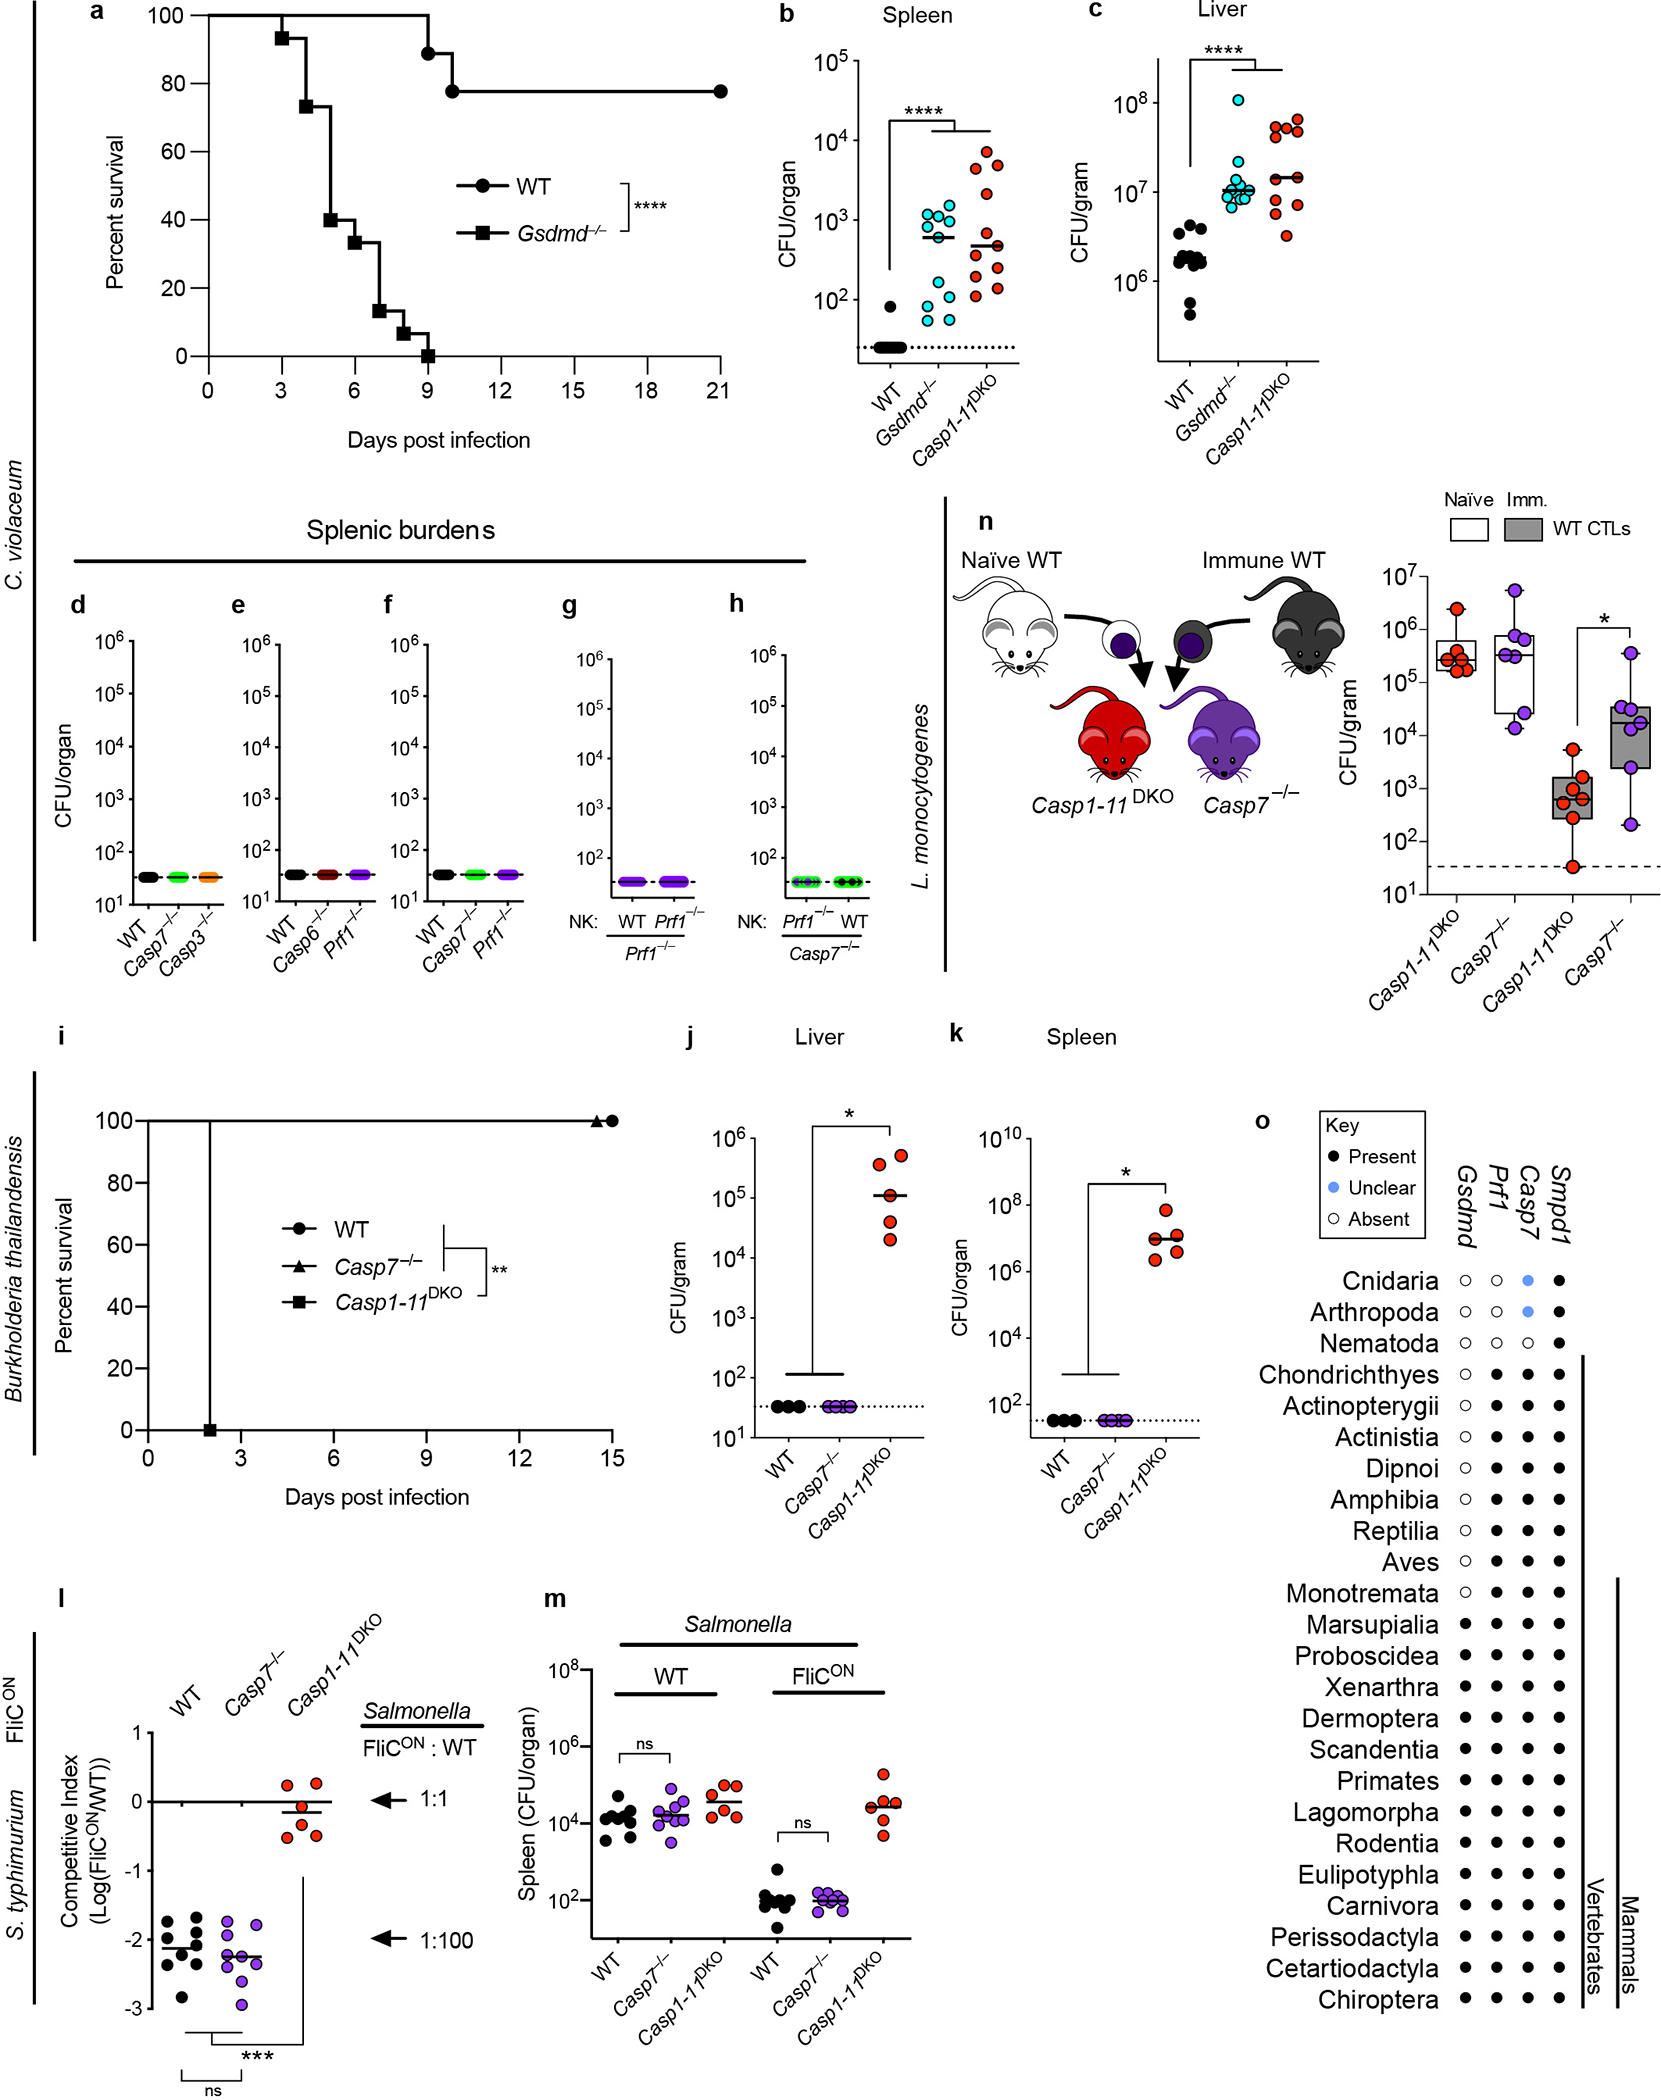
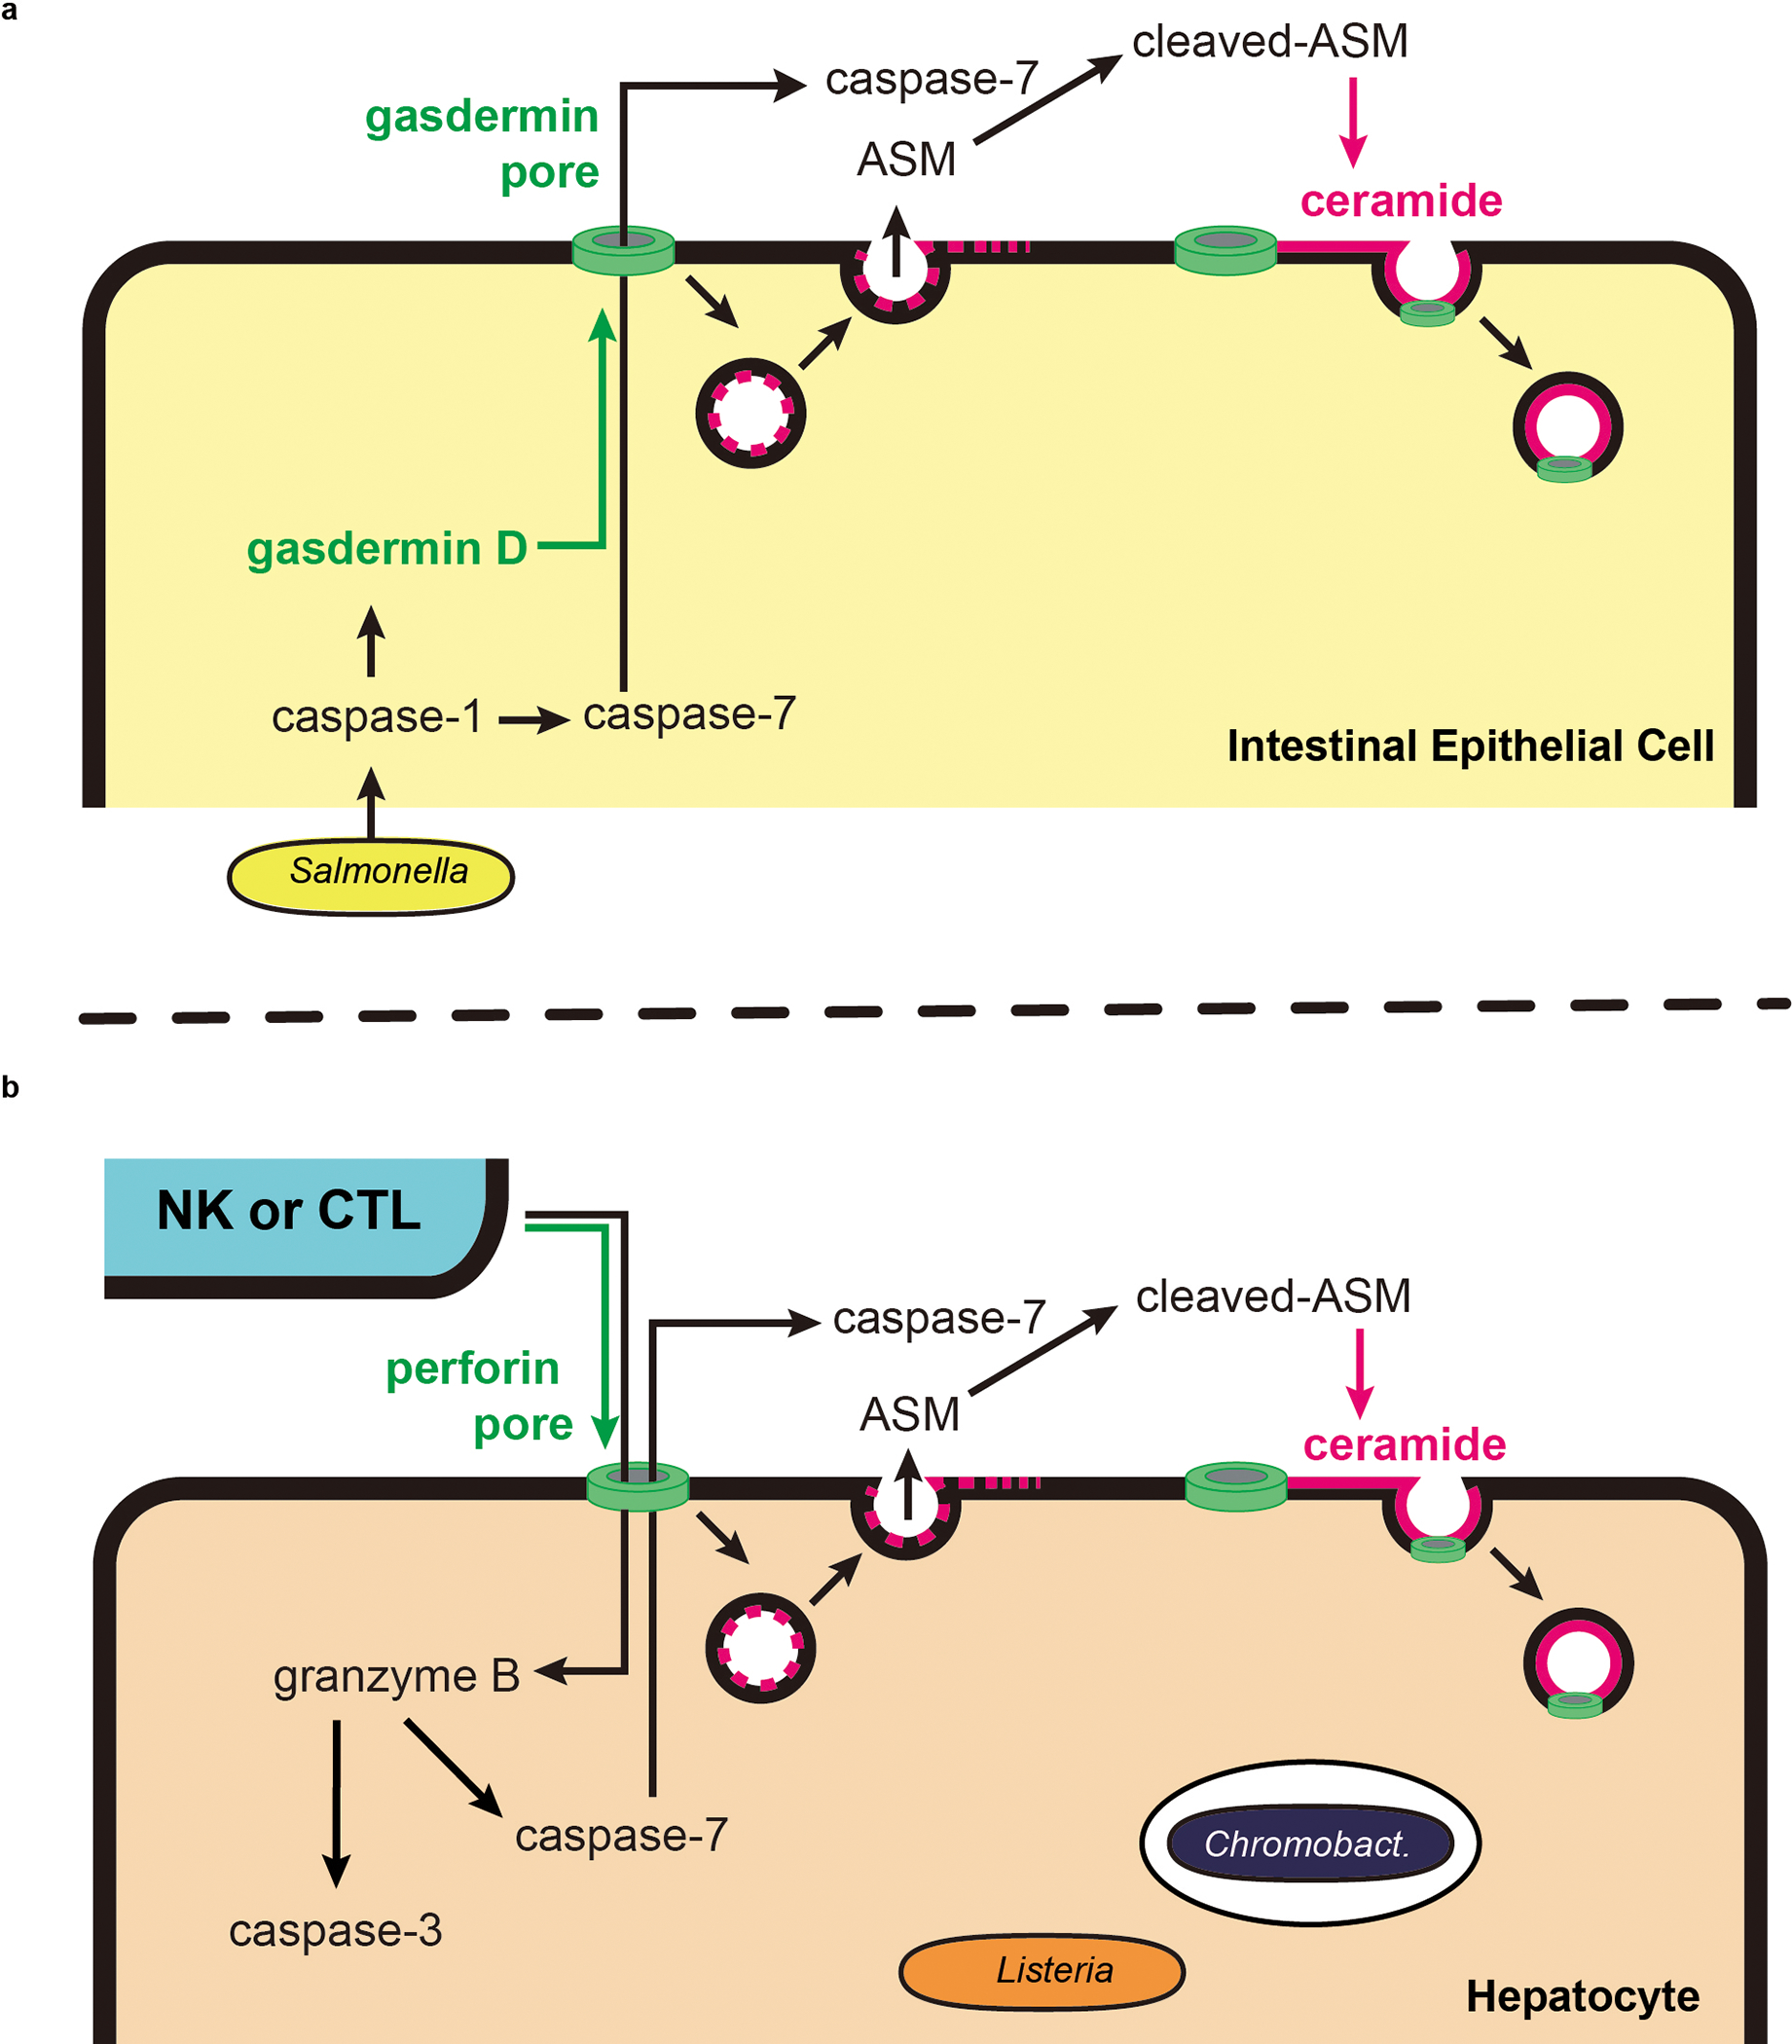
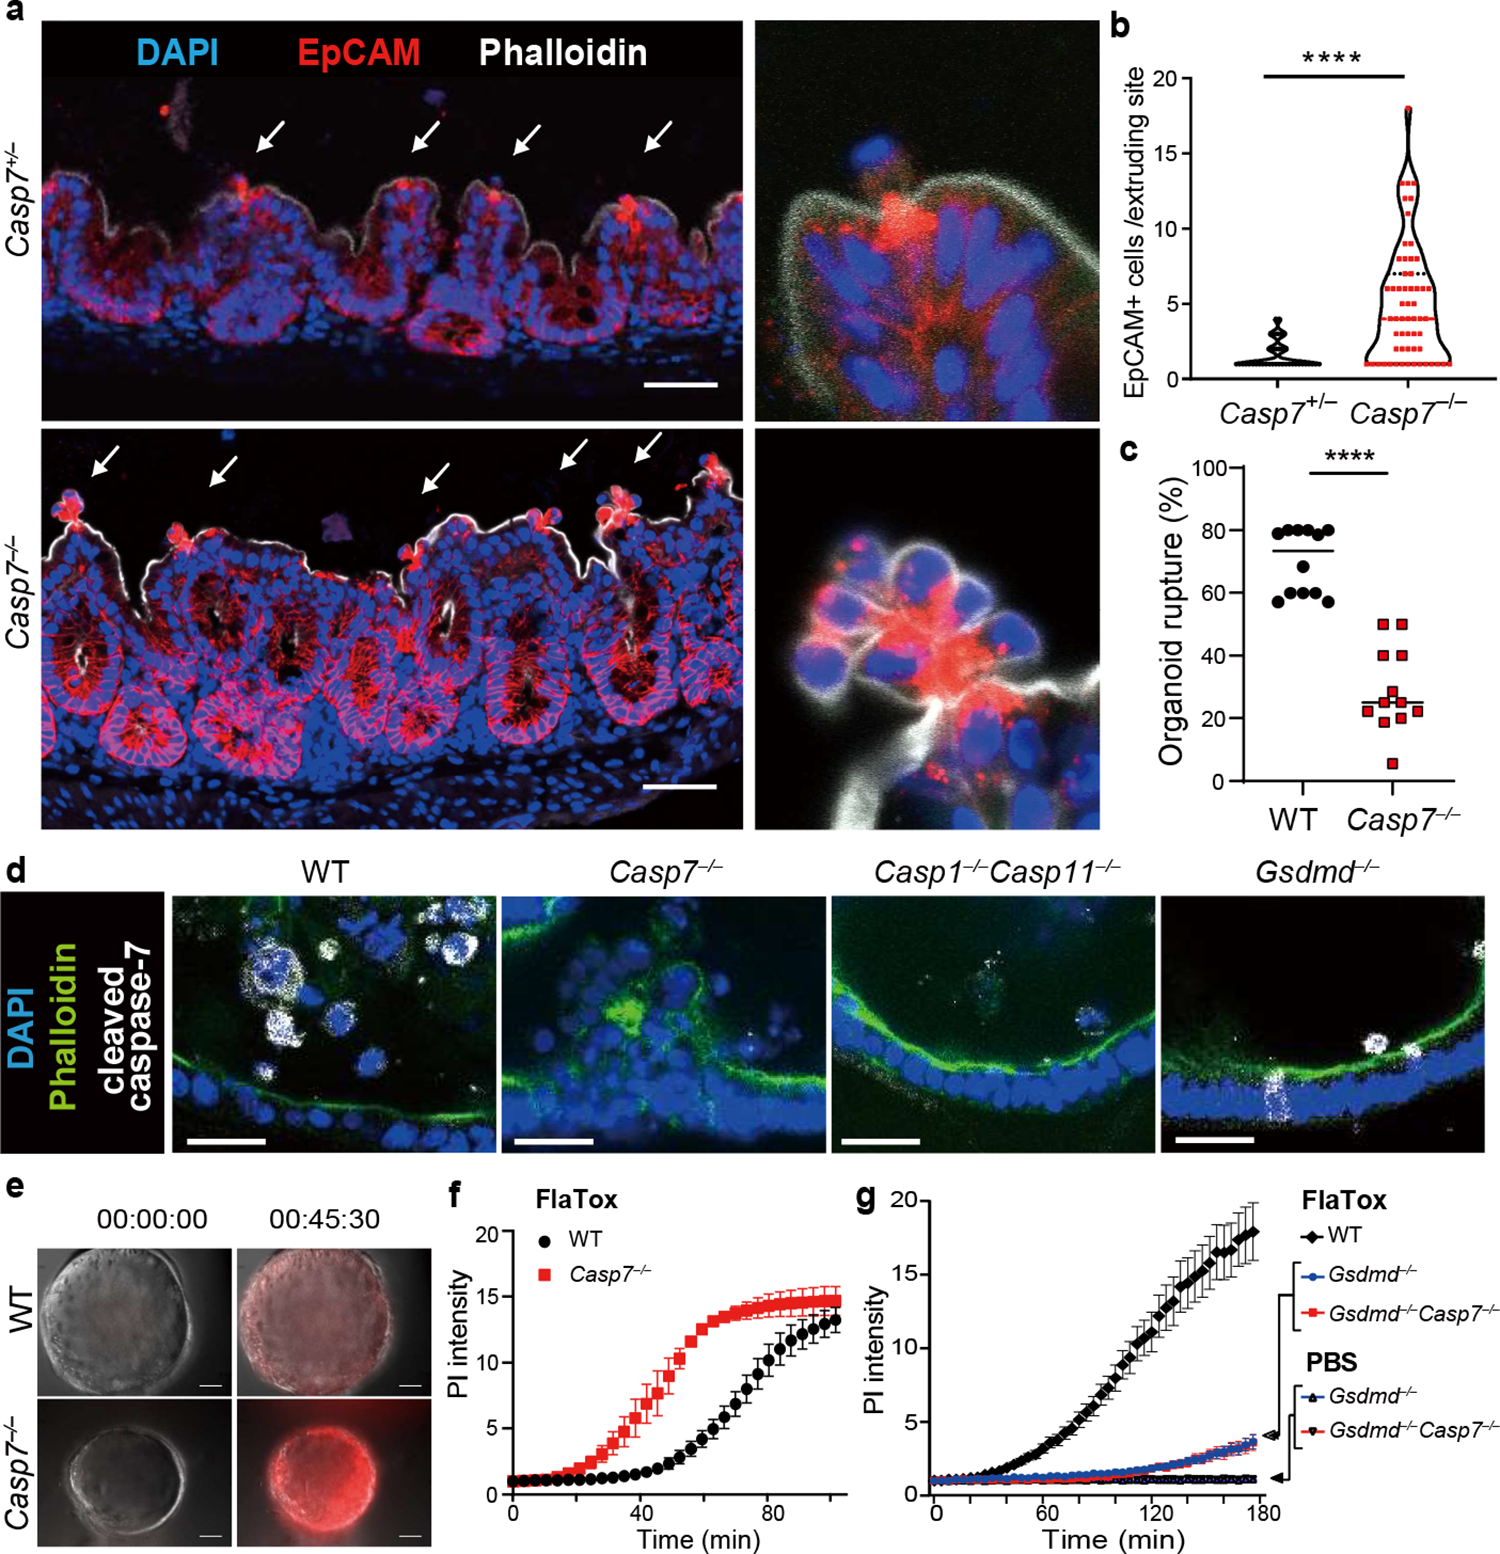
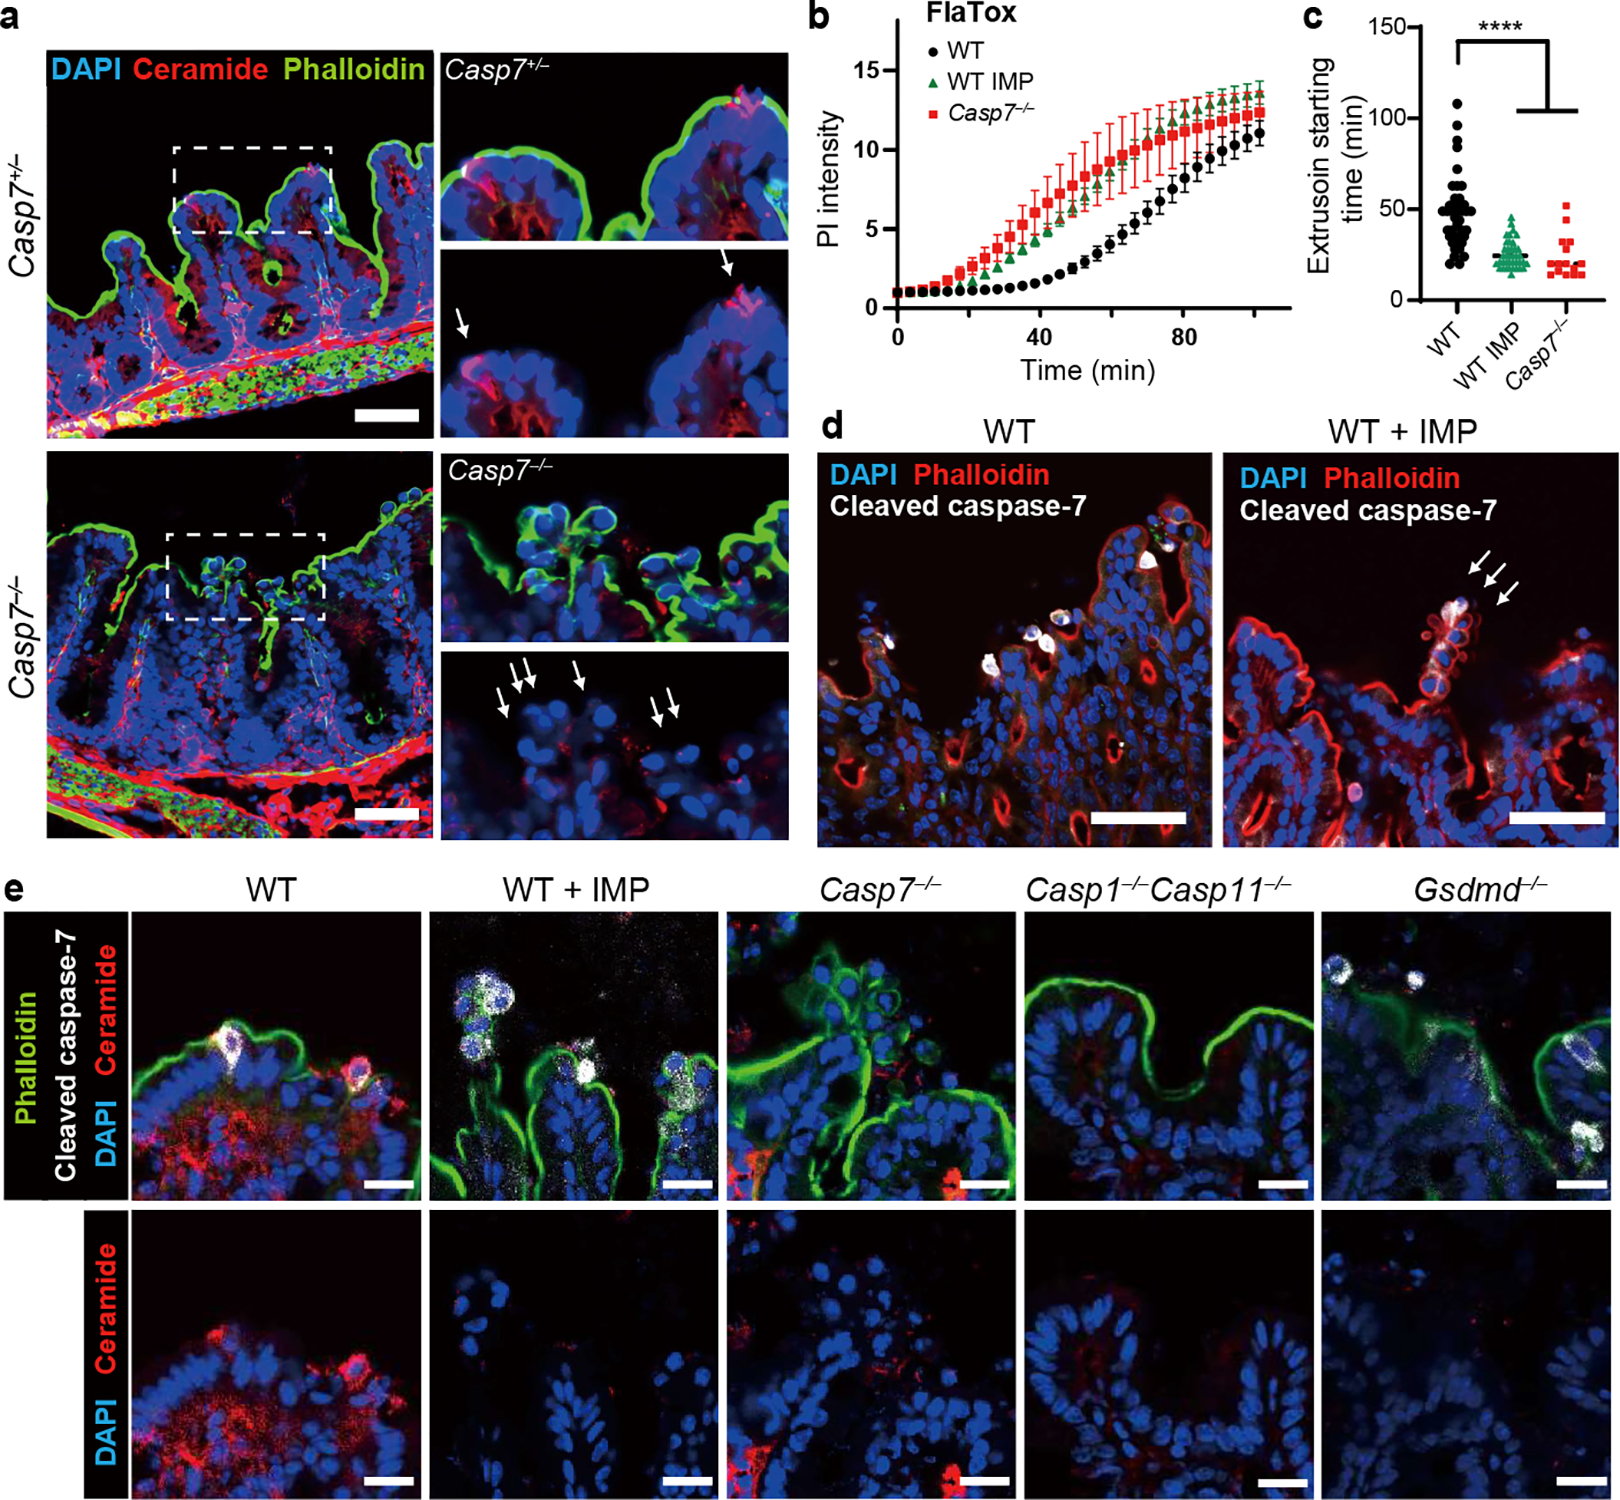
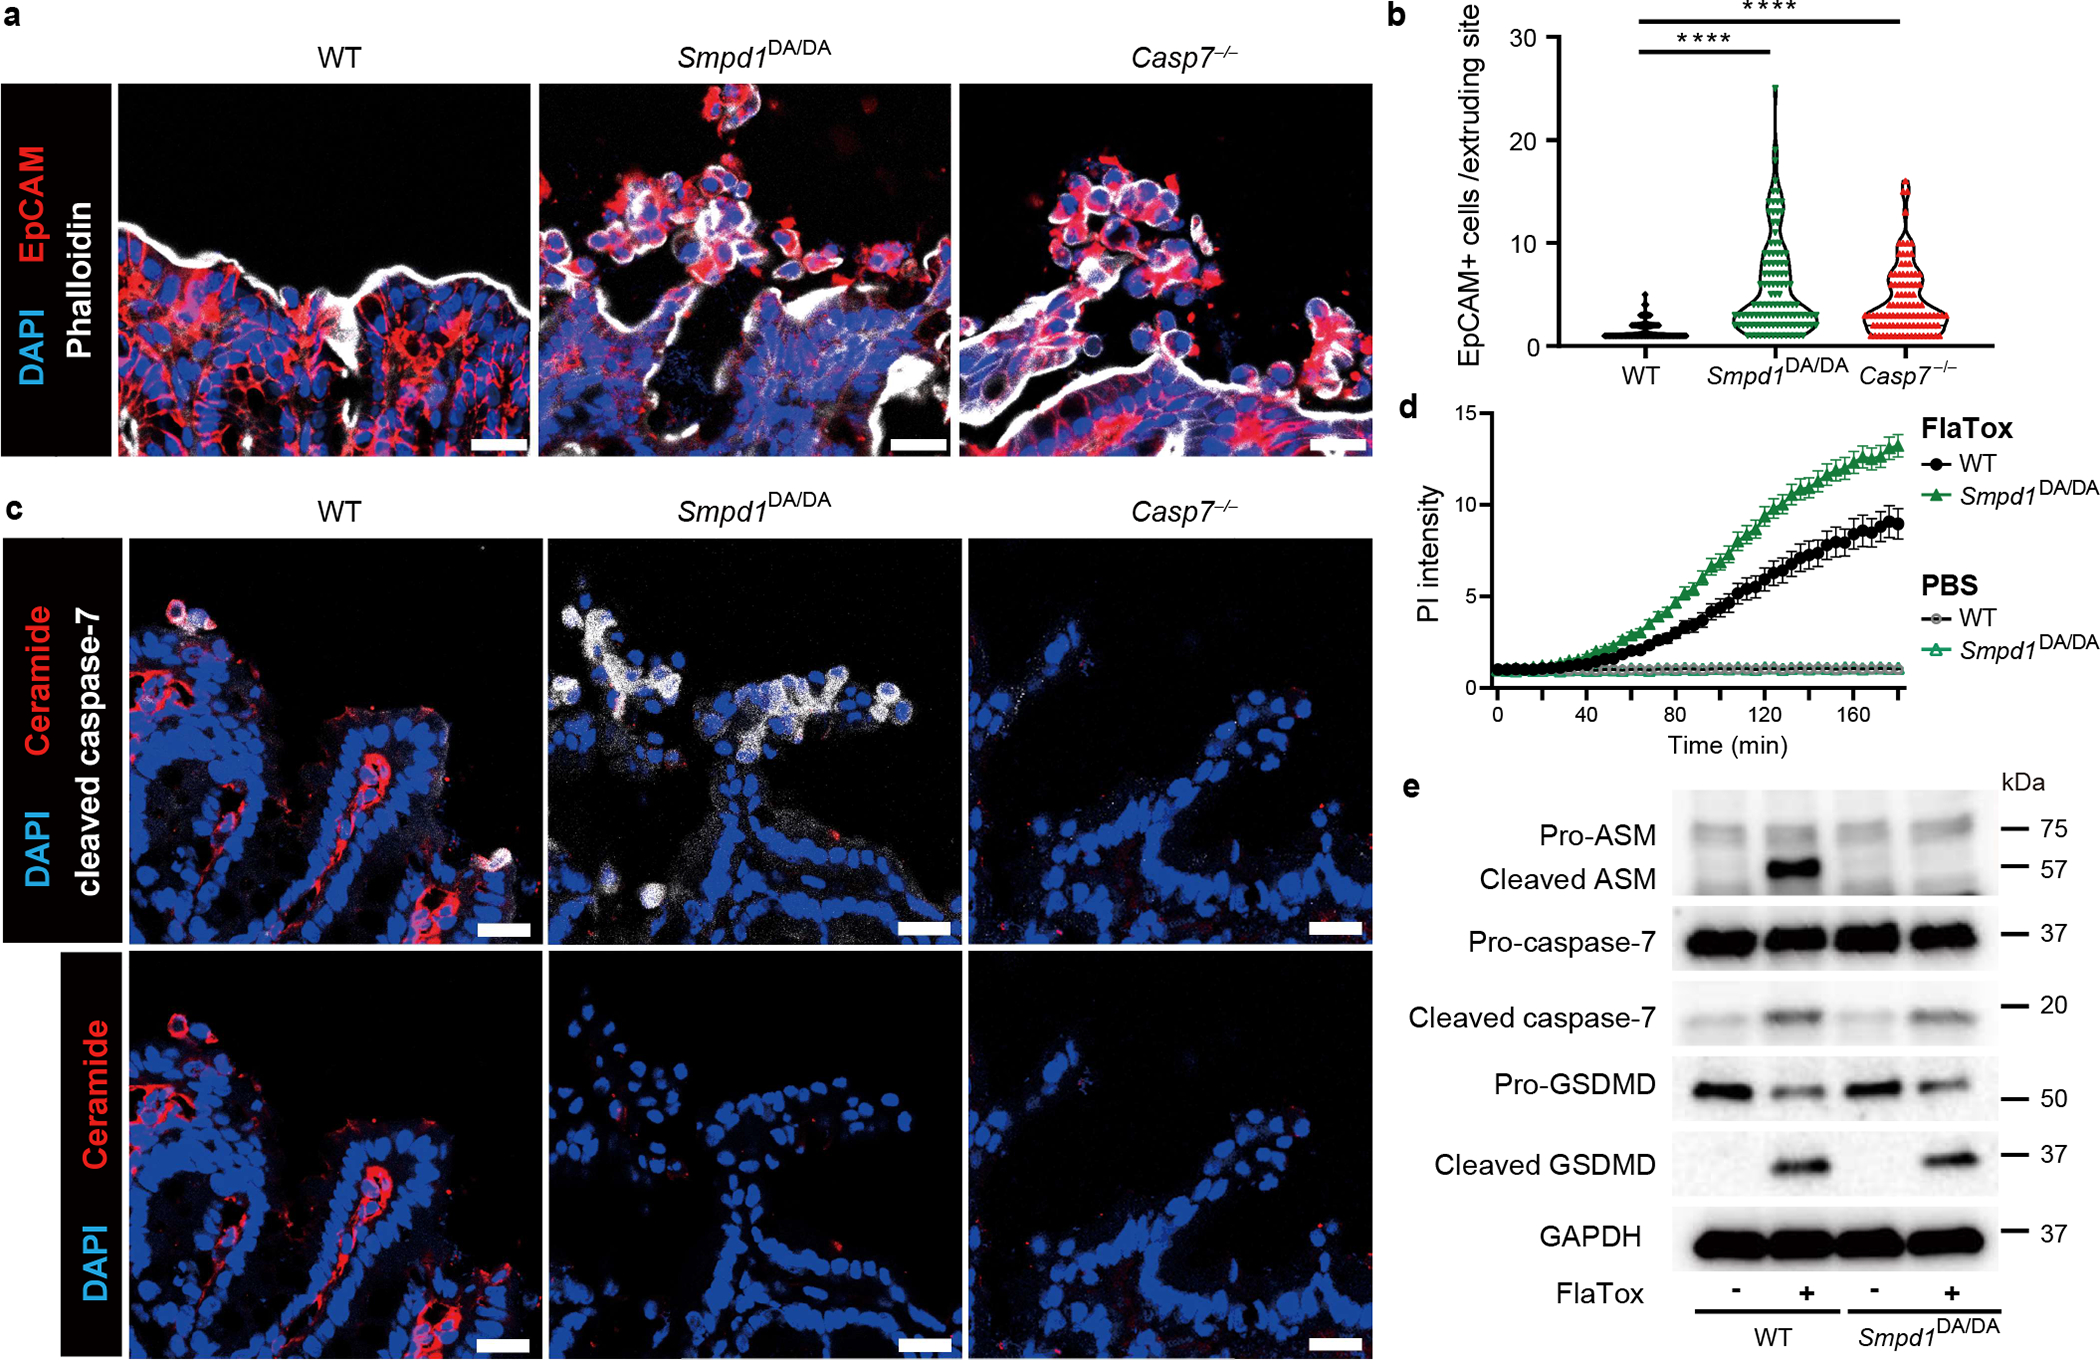
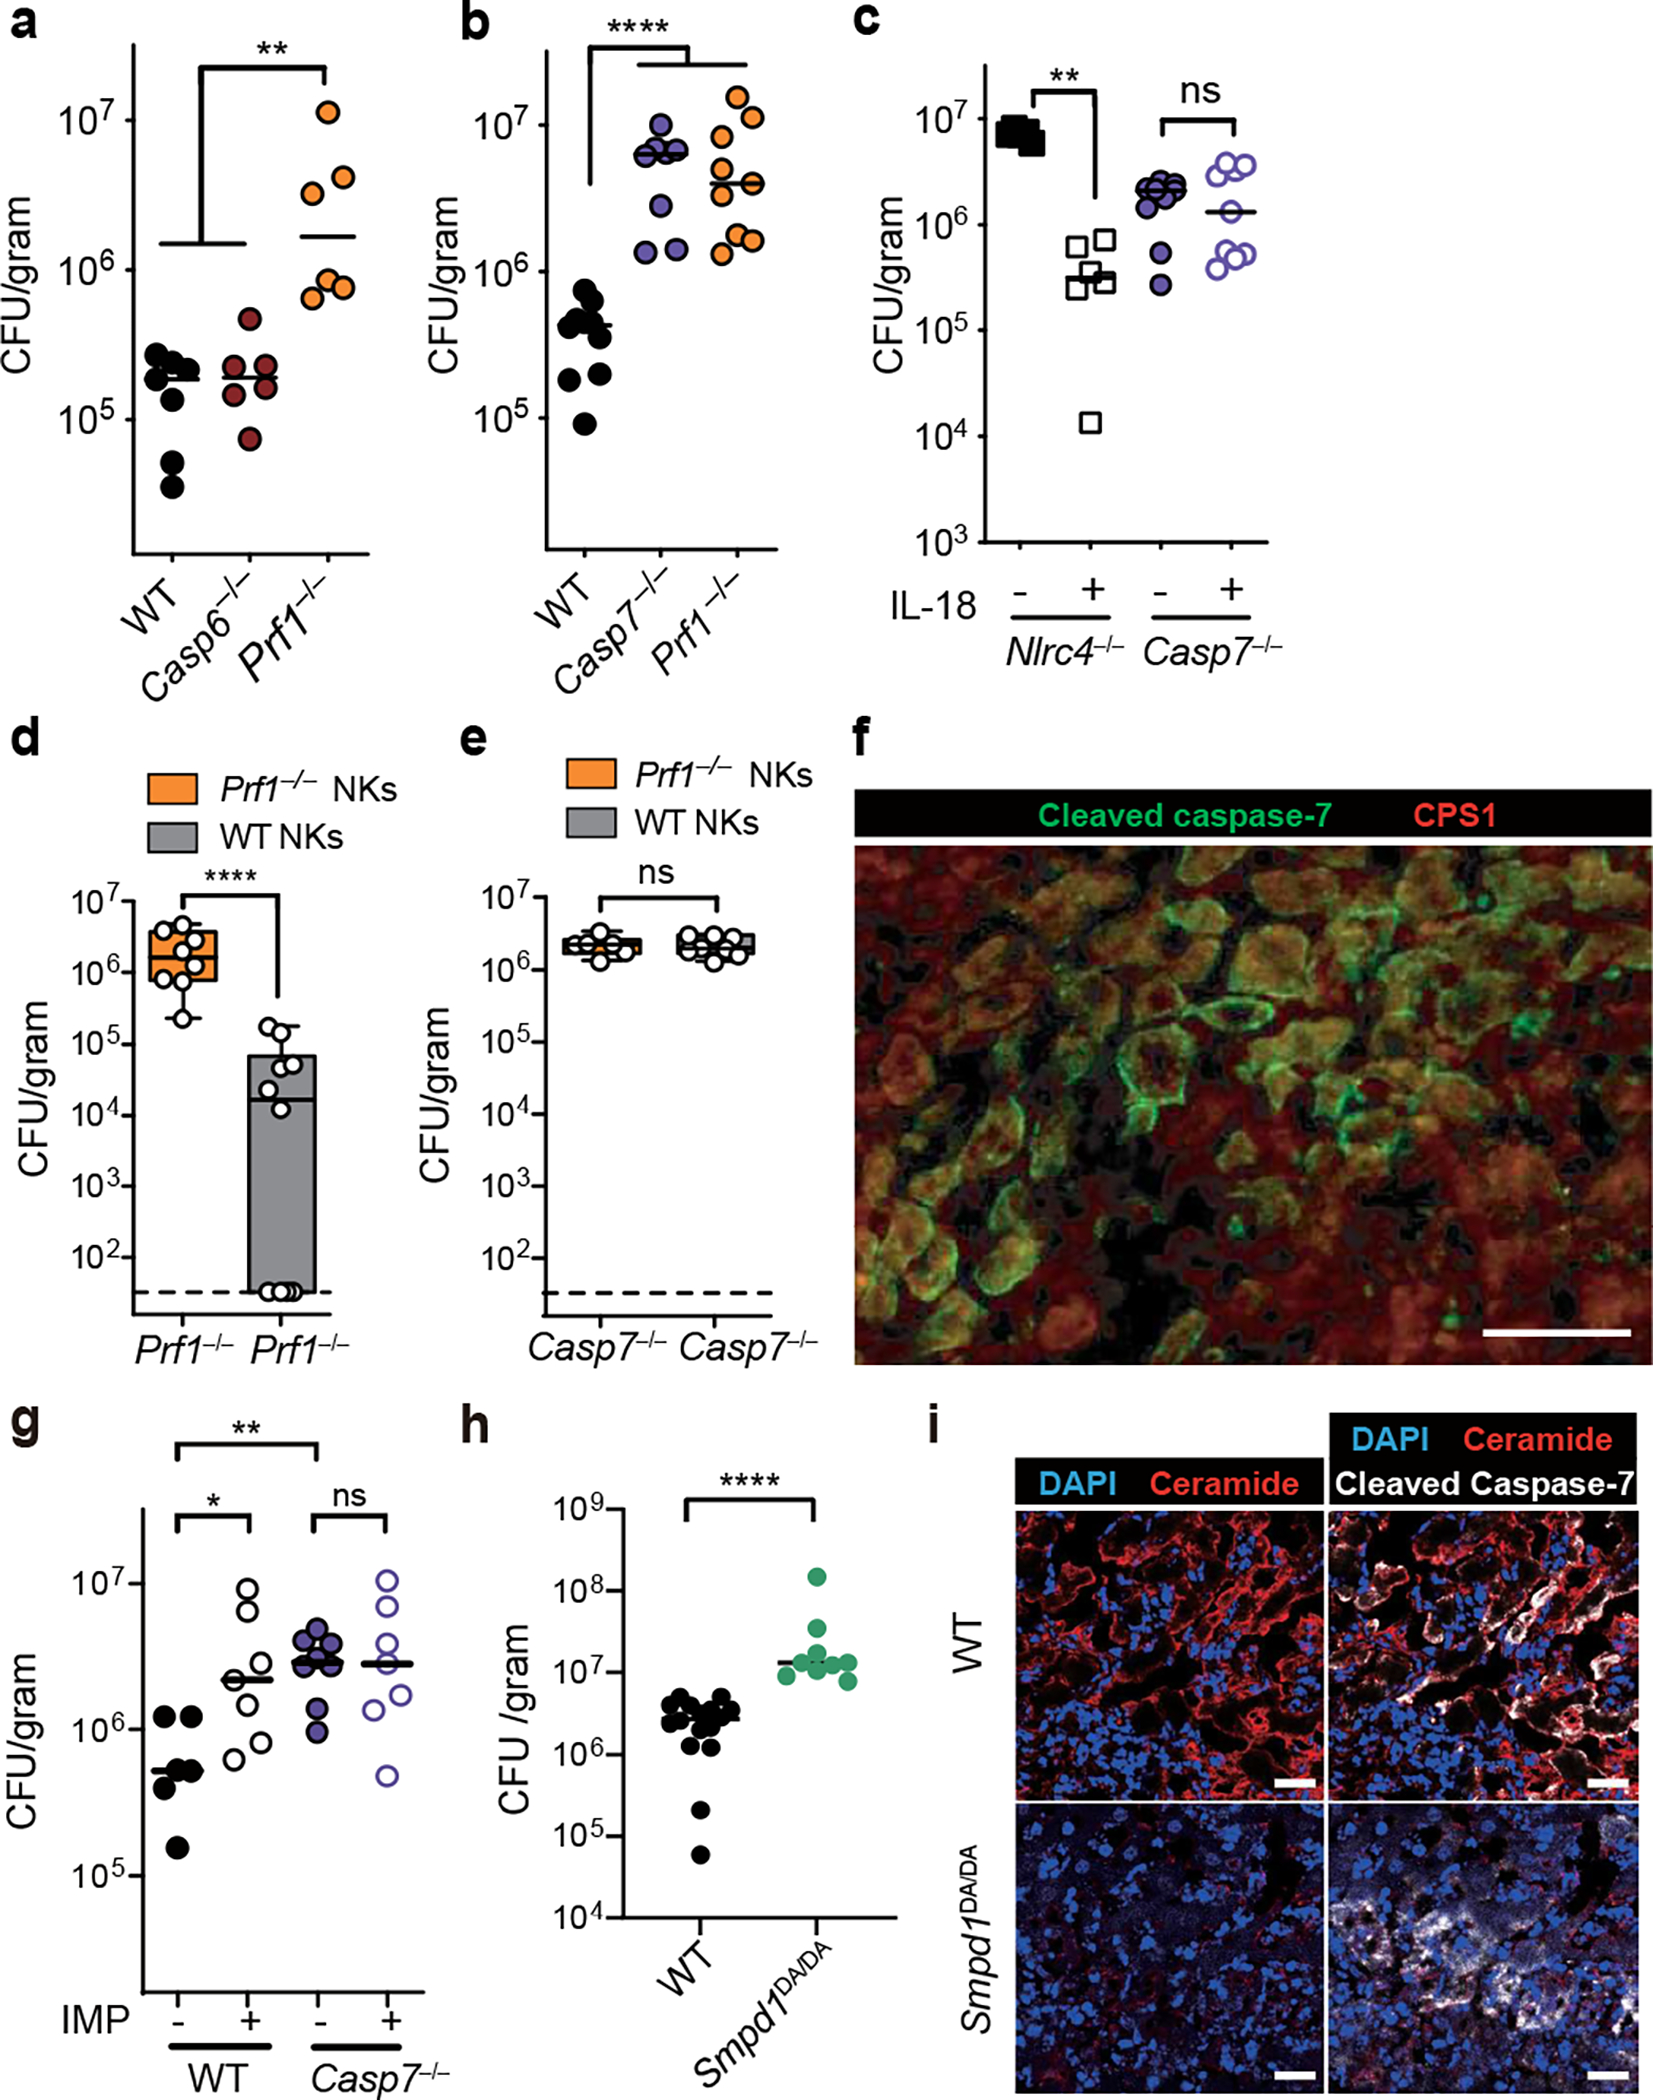
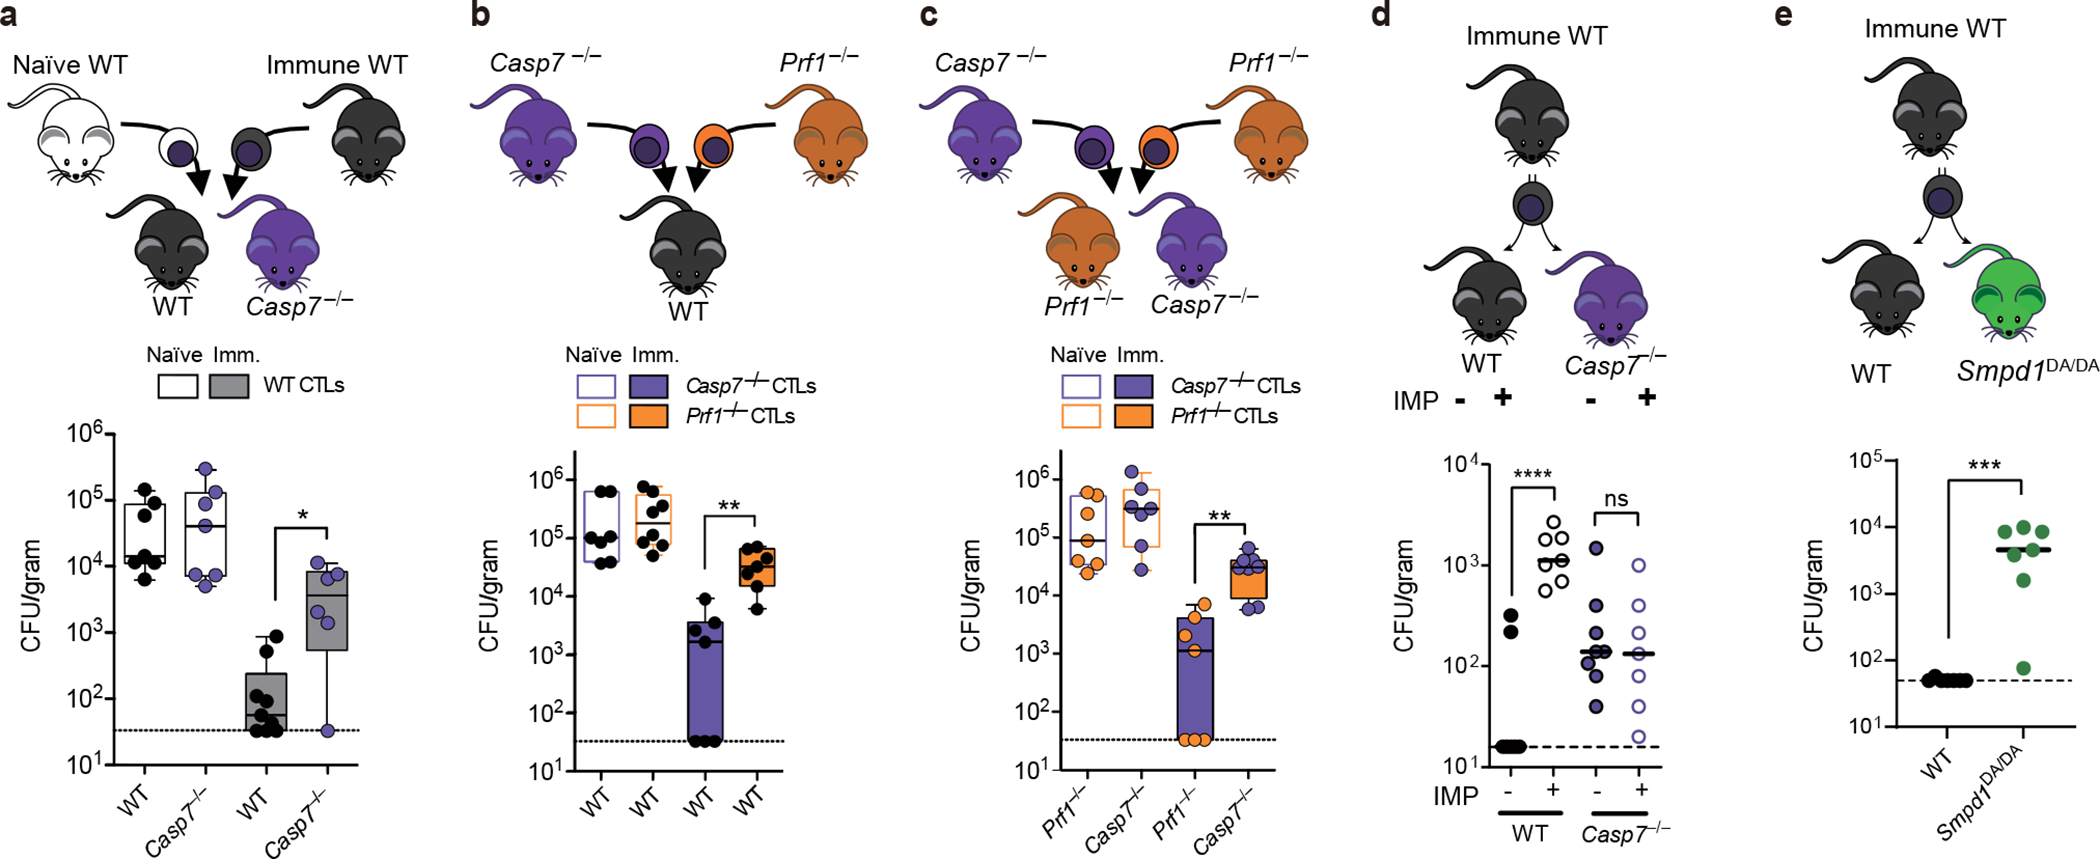
Among the caspases that cause regulated cell death, a unique function for caspase-7 has remained elusive. Caspase-3 performs apoptosis, whereas caspase-7 is typically considered an inefficient back-up. Caspase-1 activates gasdermin D pores to lyse the cell; however, caspase-1 also activates caspase-7 for unknown reasons1. Caspases can also trigger cell-type-specific death responses; for example, caspase-1 causes the extrusion of intestinal epithelial cell (IECs) in response to infection with Salmonella enterica subsp. enterica serovar Typhimurium (S. Typhimurium)2,3. Here we show in both organoids and mice that caspase-7-deficient IECs do not complete extrusion. Mechanistically, caspase-7 counteracts gasdermin D pores and preserves cell integrity by cleaving and activating acid sphingomyelinase (ASM), which thereby generates copious amounts of ceramide to enable enhanced membrane repair. This provides time to complete the process of IEC extrusion. In parallel, we also show that caspase-7 and ASM cleavage are required to clear Chromobacterium violaceum and Listeria monocytogenes after perforin-pore-mediated attack by natural killer cells or cytotoxic T lymphocytes, which normally causes apoptosis in infected hepatocytes. Therefore, caspase-7 is not a conventional executioner but instead is a death facilitator that delays pore-driven lysis so that more-specialized processes, such as extrusion or apoptosis, can be completed before cell death. Cells must put their affairs in order before they die.


Conflict of interest statement

Declaration of Interests

The authors declare no competing interests.

Figures

Extended Data Figure 1.
Extended Data Figure 1.. Caspase-7 is required for efficient IEC extrusion during S. Typhimurium infection.
a-b, Caspase-7 and caspase-3 mRNA levels in various tissues from n=2 samples were examined using BioGPS (biogps.org). c, Caspase-7, caspase-3, caspase-1 and caspase-11 expression levels in isolated IEC from n=6 samples were determined by from published transcriptome data. d-e, Representative image (d) of cleaved caspase-7 staining of cecum from WT mice 6 hours post infection (hpi) with 106 S. Typhimurium and its quantification with uninfected control (uninfected mice (n=6) and infected mice (n=6)) (e). f, Cleaved caspase-7 staining of cecum from WT mice 12 hpi with 106 GFP-S. Typhimurium. g-h, Representative image (g) of cleaved caspase-3 staining of cecum from WT mice 6 hpi with 106 S. Typhimurium and its quantification with uninfected control (uninfected mice (n=4) and infected mice (n=6)) (h). I, Quantitation in as in (d) for littermate controlled Casp3+/− (n=8) and Casp3−/− mice (n=6). j, EpCAM staining of cecum from Casp7−/−mice 24 hpi with 5×10⁶ S. Typhimurium (➝, extrusion site with 18 clustered cells was one of the largest observed, related to fig. 1a–b). k-l, quantitation of EpCAM+ cells per extruding site in cecum from littermate Casp7+/− and Casp7−/− mice 6 hpi (k) or 15 hpi (l) with 5×10⁶ S. Typhimurium; from the same experiment as the 24 hpi time point in Fig. 1b. Data are representative of 2 experiments (e, h, i), 3 experiments (d, f, g) or 1 experiment (a-c, k, l). Scar bar = 50 μm. *P < 0.05, **P < 0.01, ***P < 0.001, ****P < 0.0001 (Two-sided Mann-Whitney U test). Data are shown as median ± SEM. Exact p values in Source Data EDF1.
Extended Data Figure 2.
Extended Data Figure 2.. Caspase-7 facilitates IEC extrusion after FlaTox treatment.
a, Representative images of WT and Casp7−/− organoids after FlaTox treatment in 12 pooled experiments. b, Percentage of ruptured WT and Casp7−/− organoids after PBS treatment in pooled live imaging experiments. c-d, Percentage of ruptured WT and Casp3−/− organoids after FlaTox (c) or PBS (d) treatment in pooled experiments. e, Representative images of indicated organoids 30 min after FlaTox treatment, stained with phalloidin and for cleaved caspase-7 (Related to Fig. 1d). f, Immunoblot of IEC organoids treated with FlaTox probed for the indicated caspases. Data are representative of 3 experiments (e, f) or pooled from 12 (a), or 3 (b-d) experiments. Scar bar = 20 μm. *P < 0.05, **P < 0.01, ***P < 0.001, ****P < 0.0001 (Two-sided unpaired t test). Data are shown as mean ± SEM. Exact p values available in Source Data EDF2.
Extended Data Figure 3.
Extended Data Figure 3.. Caspase-7 prolongs membrane integrity against gasdermin D pores.
a, Gasdermin D (GSDMD) cleavage in organoids treated with FlaTox. b, Representative images in live cell imaging showing PI intensity of WT and Casp7−/− organoids treated with FlaTox. c-d, Quantitation of PI intensity in live cell imaging of WT and Casp7−/− organoids treated with PBS (c) or TNF + cycloheximide (CHX) or PBS control (d). e-f, Representative images (e) and quantitation (f) in live cell imaging of calcein intensity of WT and Casp7−/− organoids treated with FlaTox. g-h, Quantitation in live cell imaging of PI intensity of WT and Casp3−/− organoids treated with FlaTox (g) or PBS (h). Data are representative of 3 experiments. Scar bar = 50 μm. *P < 0.05, **P < 0.01, ***P < 0.001, ****P < 0.0001 (Two-way ANOVA with Sidak’s post-hoc test). Data shown as mean ± SEM. Exact p values in Source Data EDF3.
Extended Data Figure 4.
Extended Data Figure 4.. ASM cleavage by caspase-7 requires gasdermin D.
a, Validation of ASM antibody performed by immunoblot of Crispr/CAS9 targeted HeLa cells. b-d, ASM cleavage of organoids that were removed of dead cells and stimulated 20 min with FlaTox. (b) organoid cells were split into 3 tubes, one for T=0 without stimulation (left blots, shorter 30 sec exposure and longer 2 min exposure) and two for 20 min PBS or FlaTox treatment (right blot, shorter 30 sec exposure). (c) ASM cleavage from WT, Casp3−/−, or Nlrc4−/− organoids. (d) WT organoid lysates treated with FlaTox in (b) was mock or treated with PNGase F to remove glycosylation; a band shift excludes the possibility that the 57 kDa band represents a deglycosylation event of pro-ASM. Data are representative of 3 experiments.
Extended Data Figure 5.
Extended Data Figure 5.. Caspase-7 activates ASM to generate ceramide.
a, Established mechanism whereby sphingomyelin is cleaved by ASM to generate ceramide, a lipid that naturally invaginates membranes to drive membrane repair via endocytosis (adapted from (Andrews et al, 2014)). b-c, Ceramide specificity of anti-ceramide antibodies was validated by treating HeLa cells with exogenous C-16 ceramide for 2.5 hours followed by staining with the anti-ceramide antibodies 15B4 (b) or MAB_0014 (c). d, Ceramide staining of WT organoids at 20 mins post PBS or FlaTox. e, Ceramide staining of organoids at 20 min post FlaTox, with inset expanded images of the boxed areas. f, Ceramide and cleaved caspase-7 staining of indicated organoids at 20 min post FlaTox. g-i, Live imaging of indicated organoids after FlaTox treatment, quantitated for rupture percentage (g), calcein intensity (h), or extrusion starting time (i). j-l, Live imaging of indicated Casp7−/− + dimethylformamide (DMF) or vehicle or Casp7−/− + ceramide organoids after FlaTox treatment with quantitation of PI intensity (j), extrusion starting time (k), or rupture percentage (l). m, Cleaved caspase-7 staining of cecal tissues from IMP treated WT mice 24 hpi with 5×10⁶ S. Typhimurium, related to fig. 2d (➤ indicates cleaved caspase-7+ cells that appear stuck in the monolayer and lack normal extrusion morphology). n, Cleaved caspase-7 staining of WT and WT+IMP organoids at 30 min post FlaTox. Data are representative of 2 experiments (b, c) or 3 experiments (d-f, j, m-n), or are pooled from 3 experiments (h, l). For (g), live Imaging of WT (n=6 datasets), WT+IMP (n=5 datasets), and Casp7−/− (n=3 datasets) organoids pooled from 7 experiments were analyzed. For (i), WT (n=28) and Casp3−/− (n=27) organoids pooled from 3 experiments were analyzed. For (k), Casp7−/− + DMF (n=21) and Casp7−/− + ceramide (n=23) organoids pooled from 3 experiments were analyzed. Scar bar = 20 μm (b-d, f, n), 50 μm (e, m). *P < 0.05, **P < 0.01, ***P < 0.001, ****P < 0.0001 (Two-sided unpaired t test in (g, i, k, l), two-way ANOVA with Tukey’s post-hoc test in (h) or with Sidak’s post-hoc test in (j)). Data are shown as mean ± SEM. Exact p values in Source Data EDF5.
Extended Data Figure 6.
Extended Data Figure 6.. Ceramide production by caspase-7 requires gasdermin D pores.
a-c, Ceramide and EpCAM staining of cecum from WT (a), Gsdmd−/− (b), or WT+IMP (c) mice 24 hpi with 5×10⁶ S. Typhimurium (➝, extruding or extruded cells). Scar bar = 50 μm. Data are representative of 3 experiments.
Extended Data Figure 7.
Extended Data Figure 7.. ASM cleavage is requires for IEC extrusion.
a, Strategy to generate ASM D249A mutant mice by CRISPR-Cas9. Target sequence for guide RNA in exon 2 is shown in red. Repair oligo DNAs (200 nt) containing indicated mutation are also used for electroporation with Cas9. Successful mutation was confirmed by Sanger sequencing. b, Quantification of EpCAM+ cells per extruding site in non-infected WT, Smpd1DA/DA, and Casp7−/− ceca (n=4 in each group). c-f, Live imaging of indicated IEC organoids, which were quantified for rupture percentage after PBS (c) or FlaTox (d) treatment, extrusion starting time after FlaTox treatment (e), and PI Intensity after TNF+CHX or PBS treatment (f). Data are pooled from 2 (b) or 3 (c-d) experiments or are representative of 3 experiments (f). For (e), WT (n=27) and Smpd1DA/DA (n=41) organoids pooled from 3 experiments were analyzed. *P < 0.05, **P < 0.01, ***P < 0.001, ****P < 0.0001 (Two-sided unpaired t test in (d, e), two-way ANOVA with Sidak’s post-hoc test in (f)). Data are shown as mean ± SEM. Exact p values in Source Data EDF7.
Extended Data Figure 8.
Extended Data Figure 8.. Caspase-7 ameliorates tissue pathology during S. Typhimurium infection or DSS colitis.
a-c, The indicated mice were infected with 106 S. Typhimurium for 2 days, then cecum were harvested and stained with H&E. Shown are representative images (a) (Scar bar = 100 μm), pathological score (b) of WT (n=11), Casp7−/− (n=9), and Casp1−/−Casp11−/− (n=7) mice, and serum IFN-γ (c) of WT, Casp7−/−, and Casp1−/−Casp11−/− mice (n=6). d, EpCAM staining of ceca from littermate Casp7+/− and Casp7−/− mice 2 dpi with 5×10⁶ S. Typhimurium. Dotted lines indicate the space between the extruding IECs and epithelial layer. Scar bar = 50 μm. e-g, CFU of WT (n=31), Casp7−/− (n=27), and Casp1−/−Casp11−/− (n=18) mice 4 dpi with 106 S. Typhimurium in spleen (e), MLN (f), and gentamicin-treated cecum (g). h-j, CFU of WT (n=8) and Smpd1DA/DA (n=6) mice 4 dpi with 106 S. Typhimurium in (h) spleen, (i) MLN, and (j) gentamicin-treated cecum. k-l, Casp7+/− and Casp7−/− mice treated with the indicated time course of DSS. Mouse weight (k) and pathology score (l) at day 5. Data are representative of 2 experiments with (a, b, d, k, l), or are pooled from 2 experiments (c), 3 experiments (h-j), or 5 experiments (e-g). *P < 0.05, **P < 0.01, ***P < 0.001, ****P < 0.0001 (Two-sided Mann-Whitney U test in (b), two-sided unpaired t test in (c, h-j), one-way ANOVA with Dunnett’s post-hoc test in (e-g), two-way ANOVA with Sidak’s post-hoc test in (k)). Data are shown as mean ± SEM. Exact p values in Source Data EDF8.
Extended Data Figure 9.
Extended Data Figure 9.. Caspase-7 and perforin phenocopy defense against C. violaceum infection.
a-b, Mice were infected IP with 104 C. violaceum and bacterial burdens in the liver were determined 3 days post infection for separately bred mice (a) or littermate-controlled mice (b). c, Ly5A+ splenocytes were harvested from wildtype mice and expanded ex vivo in IL-2 for the NK adoptive transfer experiments in Fig. 4e–f. Shown is the percentage of transferred cells that were NK cells. d, NK cell adoptive transfer schematic for experiments in Fig. 4d–e. Data are pooled from 2 experiments in (a), representative of two experiments in (b), and representative of 3 experiments in (c). *P < 0.05, **P < 0.01, ***P < 0.001, ****P < 0.0001 (One way ANOVA (a) or two-sided Mann-Whitney U test (b)). Bars indicate mean with standard deviation (c). Exact p and n values in Source Data EDF9.
Extended Data Figure 10.
Extended Data Figure 10.. IL-18 primes NK cell cytotoxicity to activate caspase-7 in hepatocytes.
a-b, e-g, Casp1–11DKO mice were infected with 104 C. violaceum, treated with PBS or IL-18 (IP 0.2 μg recombinant mouse IL-18 (MBL) at day 0 and 1), and harvested 2 days post infection (dpi). Livers were stained for the indicated markers via immunofluorescence. Single channel zoom images are from inset box. Merged inset is shown in main Figure 4f. Scale bars, 50 μm. c, Quantification of cleaved caspase-7 signal within lesions, with each dot as the average per mouse. d, Percent of cleaved caspase-7 positive cells that co-stain with CPS1. g-j, Casp7−/− or WT mice were left uninfected or infected with 104 C. violaceum as indicated, and harvested 2 days post infection. Representative images of livers stained for nuclei (DAPI; blue), cleaved caspase-7 (g-h, j, green), cleaved caspase-3 (i, red), TUNEL (j, red). k-l, WT mice were infected with 104 C. violaceum and harvested 3 days post infection, then stained for cleaved caspase-7 (k, white), cleaved PARP (l, white). Scale bars, 50 μm. Data are pooled (c-d) or representative (a-b, e-l) of 2 experiments. *P < 0.05, **P < 0.01, ***P < 0.001, ****P < 0.0001 (Two-sided Mann-Whitney U test). Bars indicate median values. Exact p and n values in Source Data EDF10.
Extended Data Figure 11.
Extended Data Figure 11.. Caspase-7 enhances ceramide production via ASM after NK/CTL attack.
a-c, Mice were treated with imipramine or PBS, followed by intraperitoneal infection with 104 C. violaceum and harvested 3 dpi. Representative images of infected livers from WT (a), Casp7−/− (b), or WT+IMP (c) mice stained for nuclei (DAPI; blue), cleaved caspase-7 (white), and ceramide (red). Scale bars, 50 μm. Data are representative of 3 experiments.
Extended Data Fig. 12.
Extended Data Fig. 12.. CTL transfer model during L. monocytogenes infection.
a, Percentage of bacterial burden localized to hepatocytes 3 days post infection. Equal weight liver sections were removed and the hepatocyte fraction was graphed as a percentage of the total burden by weight. 3 mice per genotype. b-c, Mice were infected IV with 5×10³ L. monocytogenes and IP treated with combinations of isotype antibody or NK depleting antibody (100 μg anti-NK1.1 PK136), with IL-18 (0.2 μg recombinant mouse IL-18) or isotype control as indicated. Mouse numbers (b) n=5 each group; (c) WT PBS n=6, WT IL-18 n=6, Casp7−/− n=7 each. d, Timeline for adoptive transfers. Donor mice were PBS treated (naïve) or vaccinated with 1×10⁶ ΔactA L. monocytogenes (immune). e-f, Liver and splenic burdens 8 days post primary infection with 5×10³ L. monocytogenes. n=6 mice each. g, Flow gating strategy for flow experiments depicted in (h-i). h-i, Donor mice were NK depleted (> 99% eliminated) and their CTLs enriched by negative selection (> 72% purity). j, Mice were adoptively transferred with the indicated numbers of purified CTLs (naïve were given 1×10⁷ as the maximum transferred number), infected with 5×10⁴ L. monocytogenes and bacterial burdens were analyzed in the liver and spleen 3 days post infection. 2 naïve mice, 3 per immunized group. k, Bulk splenocyte transfer (5×10⁷, as previously described in ) with NK depletion was comparable to that of isolated CTLs. Naïve n=3, immunized n=4 mice. l, Mice were infected with 5×10⁴ of L. monocytogenes and adoptively transferred with immunized WT CTLs as in d. Liver bacterial burdens were determined 3 days post infection. Mouse numbers: Casp7+/− (n=2F), Casp7−/− (n=3M+2F), and Casp6−/− (n=5F+3M). Note full clearance in Casp7+/− mice may be due to gender disparities or simply to low numbers leading to stochasticity and poor sampling. m-n, Donor mice were PBS treated (naïve) or vaccinated with 1×10⁶ ΔactA L. monocytogenes (immune). (m) Adoptive transfer data from Figure 5b–c are shown on the same graph, since all the transfers were done in the same 2 pooled experiments. Numbers of mice (m) WT mice with Casp7−/− CTLs n=7 each, naïve Prf1−/− CTLs n=8, immune Prf1−/− CTLs n=7; naïve knockout recipients n=7 each, immune recipients Prf1−/− n=8, Casp7−/− n=7; (n) naïve WT n=8, immune WT n=10, Ifng−/− n=9 each. Data are representative of two experiments (a, e-f, h) or pooled from two experiments (b-c, j-n). *P < 0.05, **P < 0.01, ***P < 0.001, ****P < 0.0001 (Two-sided Mann-Whitney U test (a-c, k, l), or (j, m, n) one way ANOVA with Tukey’s multiple comparison test). Bars indicate mean with standard deviation (a). Box plots show median, 25th-75th percentile, whiskers are minimum and maximum. Exact p and n values in Source Data EDF12.
Extended Data Figure 13.
Extended Data Figure 13.. CTL transfer induces cleavage of caspase-7 during L. monocytogenes infection.
a, Timeline for adoptive transfers with recipients infected IV with 5×10⁴ L. monocytogenes in Figure 5. b-c, Flow cytometry of enriched hepatocytes for cleaved caspase-7 staining and gating scheme, with representative plot (b) and quantification of n=6 mice per group (c). d, Representative images of livers stained for nuclei (DAPI; blue), cleaved caspase-7 (green), and CPS1 (red). Scale bars, 50 μm. e-f, Immunofluorescence control staining. Casp7−/− mice were left uninfected (e) or CTL transferred and infected with 5×10⁴ L. monocytogenes (f), and harvested 3 days post infection. Representative images of livers stained for nuclei (DAPI; blue) and cleaved caspase-7 (green). Scale bars, 50 μm. g, Quantification of cleaved caspase-7 signal within lesions (dot = average per mouse; n=7 WT mice per group). h-i, Colocalization of cleaved caspase-7 signal and L. monocytogenes with representative image (h) and quantification (i) from n=6 naïve and n=5 immune WT mice. Scale bar, 50 μm. Graphed data are pooled from 2 experiments (c, g, i). Images representative of 2 experiments (d, h) or one experiment (e, f). * P < 0.05, **P < 0.01, ***P < 0.001, ****P < 0.0001 (Two-sided Mann-Whitney U test). Bars indicate median values. Exact p and n values in Source Data EDF13.
Extended Data Fig. 14.
Extended Data Fig. 14.. MCMV and LCMV are cleared independent of caspase-6 and caspase-7.
a-b, Mice were infected IP with 5×10⁴ pfu of MCMV. Viral titer in the liver was determined 4 days post infection from (a) n=6 WT, n=9 Casp7−/−, n=8 Prf1−/−; (b) n=10 WT, n=11 Casp6−/−, n=11 Prf1−/−. c-d, Mice were infected IP with 2×10⁵ pfu of LCMV. Viral titer in the liver was determined by plaque assay 8 days post infection from (c) n=5 WT, n=6 Casp7−/−, n=6 Prf1−/−; (d) n=8 WT, n=9 Casp6−/−, n=5 Prf1−/−. All data are pooled from 2 experiments. *P < 0.05, **P < 0.01, ***P < 0.001, ****P < 0.0001 (Two-sided Mann-Whitney U test). Bars indicate median values. Exact p and n values in Source Data EDF14.
Extended Data Fig. 15.
Extended Data Fig. 15.. Granzyme B, active caspase-3, and active caspase-7 are not sufficient to kill bacteria in vitro.
a-d, NK co-culture killing assays (see “In vitro coculture assays” in methods for detailed description) with C. violaceum-infected YAC-1 cells or L. monocytogenes-infected Hepa1–6 and YAC-1 cells as indicated. (a, c) Western blot analysis of cleaved caspase-3 (CC3) and/or cleaved caspase-7 (CC7). (b, d) Bacterial counts 5 hours post co-culture. e-f, Hepa1–6 cell lysates were spiked with granzyme B at the indicated amounts for 1 hour and 8×10⁶ L. monocytogenes was added. Western blot analysis of CC3 and CC7 (e) and time course of bacterial numbers (f). g, Invasion assay with L. monocytogenes incubated in Hepa1–6 cell lysates for 16 hours with granzyme B. All data are representative of 2 experiments. *P < 0.05, **P < 0.01, ***P < 0.001, ****P < 0.0001 (Two-sided Mann-Whitney U test). Bars indicates mean.
Extended Data Fig. 16.
Extended Data Fig. 16.. Pyroptotic activation of caspase-7 is not required for clearance of C. violaceum.
a-c, Mice were infected IP with 1×10⁴ C. violaceum and monitored for survival (a) or harvested for bacterial counts 2 days post infection (dpi) (b-c). d-h, Mice were infected with C. violaceum and spleen burdens determined 3dpi; spleen burdens shown are from the same mice whose liver burdens are shown in Extended Data Fig. 9a, Fig. 4a–b, and Fig. 4d–e. i-k, Mice were infected IP with B. thailandensis at 2×10⁷ (i) or 1×10⁴ CFUs (j-k) and mice were monitored for survival (i) or bacterial burdens were enumerated 3 dpi (j-k). l-m, Mice were infected IP with 1×10⁵ total S. typhimurium (5×10⁴ of WT plus 5×10⁴ of FliCON), with bacterial burdens determined 2 dpi and burdens graphed as competitive index (CI) of FliCON to WT bacteria (l) or graphed as total burdens (m). n, Liver bacterial burdens 3 dpi with 5×10⁴ L. monocytogenes, with adoptive transfer schematic. Donor mice were PBS treated (naïve) or vaccinated with 1×10⁶ ΔactA L. monocytogenes (immune). O, Presence or absence of Smpd1 (encoding ASM), Casp7, Prf1, and Gsdmd in the indicated taxonomic groups were determined by gene annotation and verified by reciprocal BLAST searches against the respective mouse gene product. Data are pooled from three experiments (a-c), pooled from two experiments (d-h, l-n) or representative of two experiments (i-k). Mouse numbers (a) n=9 WT, n=15 Gsdmd−/−; (b-c) n=12 WT, n=11 Casp1−/−Casp11−/−, n=11 Gsdmd−/−; (i) n=5 WT, n=3 Casp1−/−Casp11−/−, n=5 Casp7−/−; (j-k) n=3 WT, n=4 Casp7−/−, n=5 Casp1−/−Casp11−/−; (l-m) n=9 WT, n=9 Casp7−/−, n=6 Casp1−/−Casp11−/−; (n) n=6 naïve Casp1−/−Casp11−/−, n=7 immune Casp1−/−Casp11−/−, n=7 each Casp7−/−. *P < 0.05, **P < 0.01, ***P < 0.001, ****P < 0.0001 (Two-sided Mann-Whitney U test, or (a, i) log-rank Mantel-Cox test). Bars indicate median values. Box plots show median, 25th-75th percentile, whiskers are minimum and maximum. Exact p and n values in Source Data EDF16.
Extended Data Figure 17.
Extended Data Figure 17.. Model for membrane repair driven by caspase-7.
a, IECs detect the activity of the Salmonella T3SS via NLRC4 and activate caspase-1 in response. Caspase-1 then activates both the gasdermin D pore as well as caspase-7. We propose a model where caspase-7 diffuses through the gasdermin D pore, thereby entering the extracellular space. Simultaneously, the gasdermin D pore triggers lysosomal exocytosis, thus delivering acid sphingomyelinase (ASM) to the extracellular space. In this model, caspase-7 and ASM meet in the extracellular space. Note that additional studies will be needed to validate the location of the caspase-7 and ASM interaction. Caspase-7 cleaves ASM, increasing its enzymatic activity and generating more ceramide. This ceramide can then be used for continuous endocytic repair of gasdermin D pores to facilitate IEC extrusion. b, NK cells or CTLs attack by degranulating perforin and granzyme B. Perforin pores allow granzyme B to enter the target cell, where it activates caspase-3 (not shown) and caspase-7. Activated caspase-7 can exit the cell to encounter ASM, which generates ceramide that should allow endocytosis of perforin pores. We propose that this maintains cell integrity long enough for the cell to complete caspase-3-driven apoptosis.
Figure 1.
Figure 1.. Caspase-7 facilitates IEC extrusion during S. Typhimurium infection and ameliorates gasdermin D pores.
a-b, Indicated mice were infected with 5×10⁶ S. Typhimurium and ceca harvested 24 hours later. Representative images (a) and quantitation (b) of epithelial marker EpCAM+ cell counts per extrusion site (➝, extrusion sites). c, Percentage of ruptured IEC organoids after FlaTox treatment in pooled live imaging experiments (Related to Extended Data Fig. 2a). d, Representative images of organoids 30 min after FlaTox treatment, stained with phalloidin and for cleaved caspase-7. e-f, Representative images (e, full series are in Extended Data Fig. 4b) and quantitation (f) in live cell imaging of PI intensity of WT and Casp7−/− organoids treated with FlaTox. g, PI Intensity of WT, Gsdmd−/−, and Gsdmd−/−Casp7−/− organoids treated with FlaTox or control PBS. Data are representative of 3 experiments (a-b, d-f) or are pooled from 12 (c) or 3 (g) experiments. Scar bar = 50 μm (a), 20 μm (d). *P<0.05, **P<0.01, ***P<0.001, ****P<0.0001 (Two-sided Mann-Whitney U test in (b), two-sided unpaired t test in (c), two-way analysis of variance (ANOVA) with Sidak’s post-hoc test in (f) or with Turkey’s post-hoc test in (g)). Data shown as median ± SEM (b), mean ± SEM (c, f-g). Exact p values in Source Data F1.
Figure 2.
Figure 2.. Caspase-7 activation drives ASM to repair gasdermin D pores and facilitate IEC extrusion.
a, Indicated mice were infected with 5×10⁶ S. Typhimurium and ceca harvested 24 hours later. (a) Ceramide staining; dotted rectangles shown at higher magnification at right (➝ indicates individual extruding cells). b-c, Indicated organoids treated with FlaTox were live-imaged, and PI intensity (b) or (c) extrusion starting time were quantitated. d-e, Indicated mice were infected with 5×10⁶ S. Typhimurium and ceca harvested 24 hours later. (d) Cleaved caspase-7 staining (➝ indicates extruding cell clusters). (e) Ceramide and cleaved caspase-7 staining. Scar bar = 50 μm (a, d) or 20 μm (e). Data are representative of 3 experiments (a, d, e) or are pooled from 3 experiments (b-c). For (c), WT (n=41), WT+IMP (n=39), and Casp7−/− (n=15) organoids pooled from 3 experiments were analyzed. *P<0.05, **P<0.01, ***P<0.001, ****P<0.0001 (Two-way ANOVA with Tukey’s post-hoc test in (b), one-way ANOVA with Tukey’s post-hoc test in (c)). Data are shown as mean ± SEM. Exact p values in Source Data F2.
Figure 3.
Figure 3.. ASM cleavage-resistant mutation impairs membrane repair and IEC extrusion.
a-c, Indicated mice were infected with 5×10⁶ S. Typhimurium and ceca harvested 24 hours later. Representative images (a) and quantitation (b) of EpCAM+ cell counts per extruding site. (c) Ceramide and cleaved caspase-7 staining. d, Indicated organoids treated with FlaTox or PBS control were live-imaged, and PI intensity was quantified. e, indicated organoids were removed of dead cells and then stimulated 20 min with PBS or FlaTox and ASM, caspase-7, and GSDMD cleavage assessed. Data are representative of 3 experiments (a-c, e) or are pooled from 3 experiments (d). Scar bar = 20 μm. *P<0.05, **P<0.01, ***P<0.001, ****P<0.0001 (Two-sided Mann-Whitney U test in (b), two-way ANOVA with Sidak’s post-hoc test in (d)). Data are shown as median ± SEM (b), mean ± SEM (d). Exact p values in Source Data F3.
Figure 4.
Figure 4.. NK cell perforin attack cleaves caspase-7 and ASM to clear C. violaceum.
a-i, Indicated mice were infected with 102 (c) or 104 (a-b, d-i) C. violaceum. Enumeration of liver burdens 3 days post infection (dpi) (a-e, g-h). (c, f) Mice were treated with recombinant IL-18 or PBS control (day 0 and 1). (d-e) Mice were adoptively transferred with NK cells from the indicated sources 24 hours before infection. (f) Livers were stained for the indicated markers via immunofluorescence 2 dpi. Scale bars, 50 μm. Larger image area and single channels shown in Extended Data Fig. 8b. (g) Mice were treated with imipramine or PBS. (i) Representative images of infected livers 3 dpi stained for indicated markers. Scale bars, 20 μm. (a-e) Data are pooled from 2 experiments, or from (g-h) 3 experiments. (f, i) Data are representative of 2 experiments. Mouse numbers (a) WT n=7, Casp6−/− n=6, Prf1−/− n=6; (b) WT n=10, Casp7−/− n=7, Prf1−/− n=8; (c) PBS n=6 and IL-18 n=6 treated Nlrc4−/−, Casp7−/− n=9 each; (d) Prf1−/− n=9, Casp7−/− n=7; (g) WT n=6, WT IMP n=7, Casp7−/− control n=8, Casp7−/− IMP n=7; (h) WT n=16, Smpd1DA/DA n=9. *P<0.05, **P<0.01, ***P<0.001, ****P<0.0001 (Two-sided Mann-Whitney U test (a-e, h) or one-way ANOVA (g)). Bars indicate median values. Box plots show median, 25th-75th percentile, whiskers are minimum and maximum. Exact p values in Source Data F4.
Figure 5.
Figure 5.. CTL perforin attack clearance of L. monocytogenes requires caspase-7 and ASM cleavage.
a-e, CTL donor mice were PBS treated (naïve) or vaccinated with ΔactA L. monocytogenes (immune). Recipient mice were infected with L. monocytogenes, transferred with CTLs 2 days post infection (dpi), and liver burdens determined 3 dpi. Timeline for AT experiments in EDF13a. d, Recipient mice were injected IP with imipramine or PBS (day −1 to infection, then daily). All data are pooled from two experiments. Mouse numbers in (a) naïve WT n=7, immune WT n=9, naïve Casp7−/− n=7, immune Casp7−/− n=6; (b) WT mice with Casp7−/− CTLs n=7 each, naïve Prf1−/− CTLs n=8, immune Prf1−/− CTLs n=7; (c) naïve recipients n=7 each, immune recipient Prf1−/− n=8, Casp7−/− n=7; (d) WT n=7, WT IMP n=7, Casp7−/−n=8, Casp7−/− IMP n=7; (e) WT n=7, Smpd1DA/DA n=7. *P<0.05, **P<0.01, ***P<0.001, ****P<0.0001 (Two-sided Mann-Whitney U test (a, e) or one-way ANOVA (b-d)). Bars indicate median values. Box plots show median, 25th-75th percentile, whiskers are minimum and maximum. Exact p values in Source Data F5.

Comment in

References

    1. Lamkanfi M et al. Targeted peptidecentric proteomics reveals caspase-7 as a substrate of the caspase-1 inflammasomes. Mol Cell Proteomics 7, 2350–2363, doi:10.1074/mcp.M800132-MCP200 (2008). - DOI - PMC - PubMed
    1. Sellin ME et al. Epithelium-intrinsic NAIP/NLRC4 inflammasome drives infected enterocyte expulsion to restrict Salmonella replication in the intestinal mucosa. Cell Host Microbe 16, 237–248, doi:10.1016/j.chom.2014.07.001 (2014). - DOI - PubMed
    1. Rauch I et al. NAIP-NLRC4 Inflammasomes Coordinate Intestinal Epithelial Cell Expulsion with Eicosanoid and IL-18 Release via Activation of Caspase-1 and -8. Immunity 46, 649–659, doi:10.1016/j.immuni.2017.03.016 (2017). - DOI - PMC - PubMed
    1. Kuida K et al. Decreased apoptosis in the brain and premature lethality in CPP32-deficient mice. Nature 384, 368–372, doi:10.1038/384368a0 (1996). - DOI - PubMed
    1. Lakhani SA et al. Caspases 3 and 7: key mediators of mitochondrial events of apoptosis. Science 311, 847–851, doi:10.1126/science.1115035 (2006). - DOI - PMC - PubMed

METHODS REFERENCES

    1. Mariathasan S et al. Differential activation of the inflammasome by caspase-1 adaptors ASC and Ipaf. Nature 430, 213–218, doi:10.1038/nature02664 (2004). - DOI - PubMed
    1. Kuida K et al. Altered cytokine export and apoptosis in mice deficient in interleukin-1 beta converting enzyme. Science 267, 2000–2003 (1995). - PubMed
    1. Zheng TS, Hunot S, Kuida K & Flavell RA Caspase knockouts: matters of life and death. Cell Death Differ 6, 1043–1053, doi:10.1038/sj.cdd.4400593 (1999). - DOI - PubMed
    1. Miao EA et al. Caspase-1-induced pyroptosis is an innate immune effector mechanism against intracellular bacteria. Nat Immunol 11, 1136–1142, doi:10.1038/ni.1960 (2010). - DOI - PMC - PubMed
    1. Wheat RL, Clark PY & Brown MG Quantitative measurement of infectious murine cytomegalovirus genomes in real-time PCR. J Virol Methods 112, 107–113, doi:10.1016/s0166-0934(03)00197-6 (2003). - DOI - PubMed

Supplementary concepts