. 2022 Jun;606(7915):797-803.
doi: 10.1038/s41586-022-04833-8. Epub 2022 Jun 15.

Androgen receptor blockade promotes response to BRAF/MEK-targeted therapy

Christopher P Vellano #  1 Michael G White #  2 Miles C Andrews #  2   3 Manoj Chelvanambi #  2 Russell G Witt #  2 Joseph R Daniele  1 Mark Titus  4 Jennifer L McQuade  5 Fabio Conforti  6 Elizabeth M Burton  2 Matthew J Lastrapes  2 Gabriel Ologun  2   7 Alexandria P Cogdill  2   8 Golnaz Morad  2 Peter Prieto  2   9 Alexander J Lazar  10   11   12 Yanshuo Chu  11 Guangchun Han  11 M A Wadud Khan  2 Beth Helmink  2   13 Michael A Davies  5 Rodabe N Amaria  5 Jeffrey J Kovacs  1 Scott E Woodman  11 Sapna Patel  5 Patrick Hwu  5   14 Michael Peoples  1 Jeffrey E Lee  2 Zachary A Cooper  2   15 Haifeng Zhu  11 Guang Gao  1 Hiya Banerjee  16 Mike Lau  17 Jeffrey E Gershenwald  2 Anthony Lucci  2 Emily Z Keung  2 Merrick I Ross  2 Laura Pala  6 Eleonora Pagan  18 Rossana Lazcano Segura  12 Qian Liu  19 Mikayla S Borthwick  20 Eric Lau  19 Melinda S Yates  20 Shannon N Westin  20 Khalida Wani  12 Michael T Tetzlaff  10   21 Lauren E Haydu  2 Mikhila Mahendra  1 XiaoYan Ma  1 Christopher Logothetis  4 Zachary Kulstad  2 Sarah Johnson  2 Courtney W Hudgens  12 Ningping Feng  1 Lorenzo Federico  1 Georgina V Long  22 P Andrew Futreal  11 Swathi Arur  23 Hussein A Tawbi  5 Amy E Moran  24 Linghua Wang  11 Timothy P Heffernan  25 Joseph R Marszalek  26 Jennifer A Wargo  27   28
Affiliations

Androgen receptor blockade promotes response to BRAF/MEK-targeted therapy

Christopher P Vellano et al. Nature. 2022 Jun.

Erratum in

  • Author Correction: Androgen receptor blockade promotes response to BRAF/MEK-targeted therapy.
    Vellano CP, White MG, Andrews MC, Chelvanambi M, Witt RG, Daniele JR, Titus M, McQuade JL, Conforti F, Burton EM, Lastrapes MJ, Ologun G, Cogdill AP, Morad G, Prieto P, Lazar AJ, Chu Y, Han G, Khan MAW, Helmink B, Davies MA, Amaria RN, Kovacs JJ, Woodman SE, Patel S, Hwu P, Peoples M, Lee JE, Cooper ZA, Zhu H, Gao G, Banerjee H, Lau M, Gershenwald JE, Lucci A, Keung EZ, Ross MI, Pala L, Pagan E, Segura RL, Liu Q, Borthwick MS, Lau E, Yates MS, Westin SN, Wani K, Tetzlaff MT, Haydu LE, Mahendra M, Ma X, Logothetis C, Kulstad Z, Johnson S, Hudgens CW, Feng N, Federico L, Long GV, Futreal PA, Arur S, Tawbi HA, Moran AE, Wang L, Heffernan TP, Marszalek JR, Wargo JA. Vellano CP, et al. Nature. 2023 Jan;613(7945):E3. doi: 10.1038/s41586-022-05632-x. Nature. 2023. PMID: 36627494 No abstract available.

Abstract

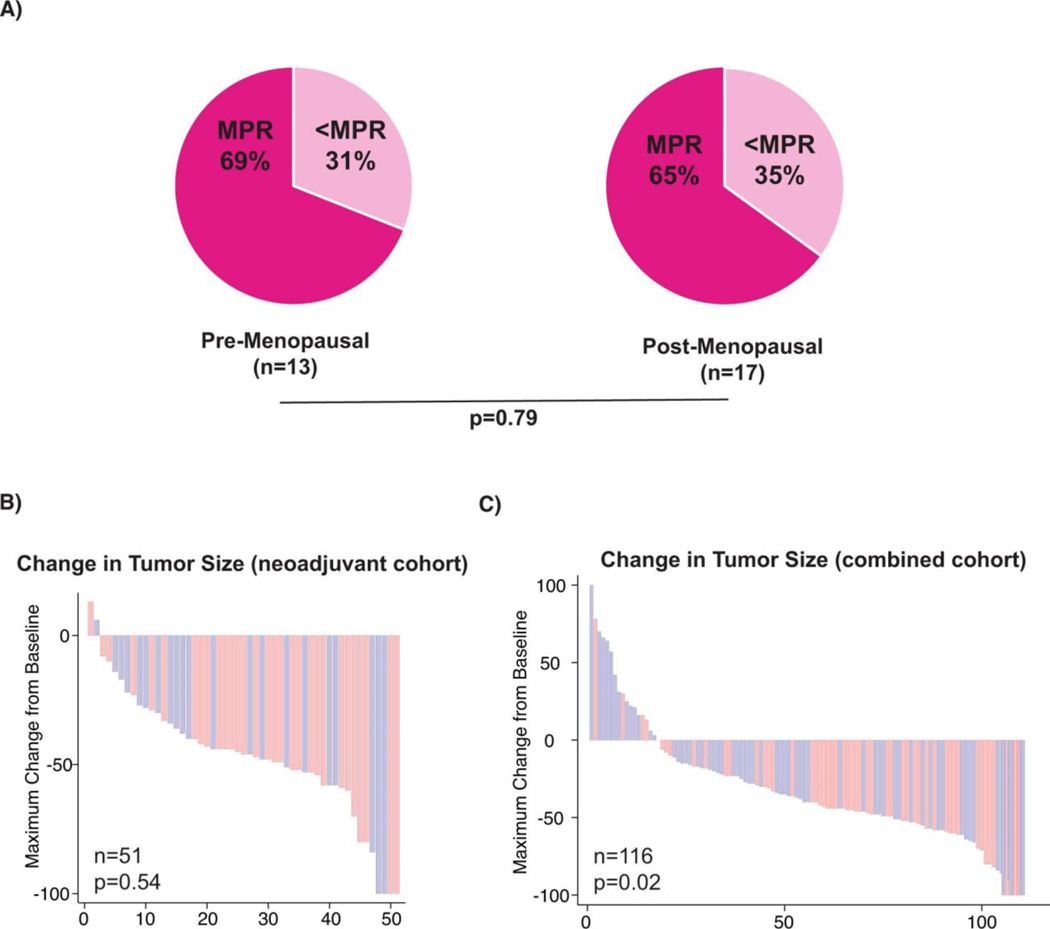
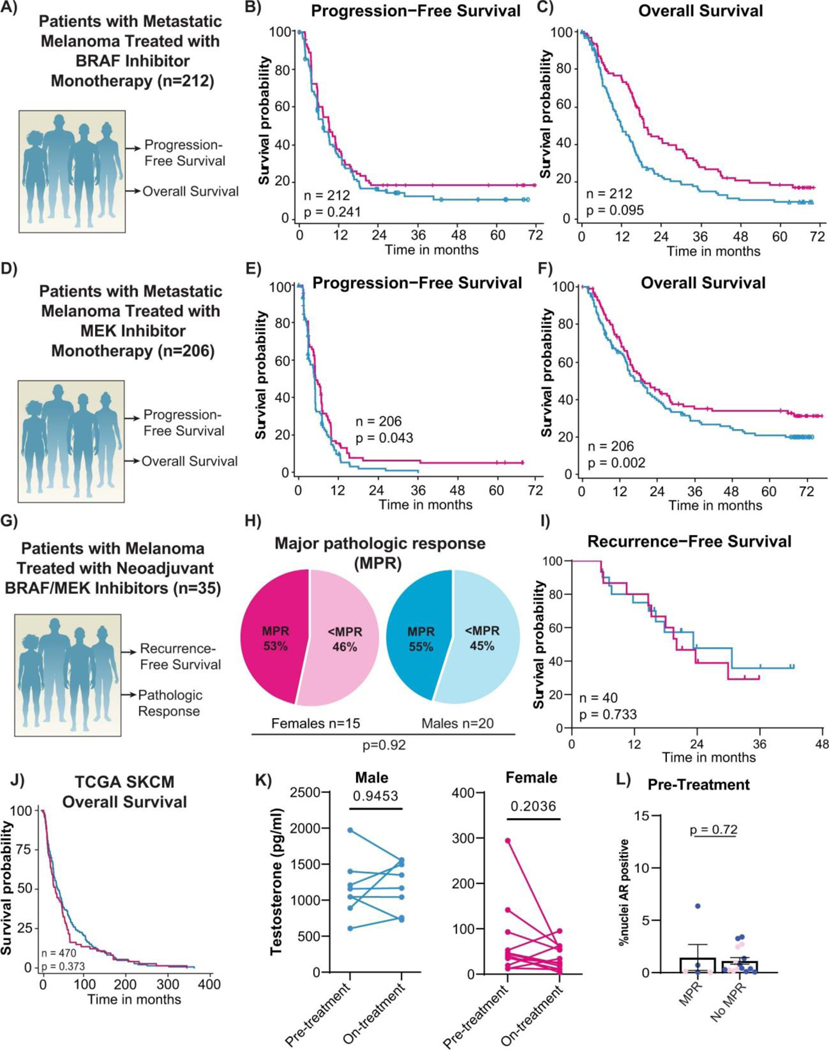
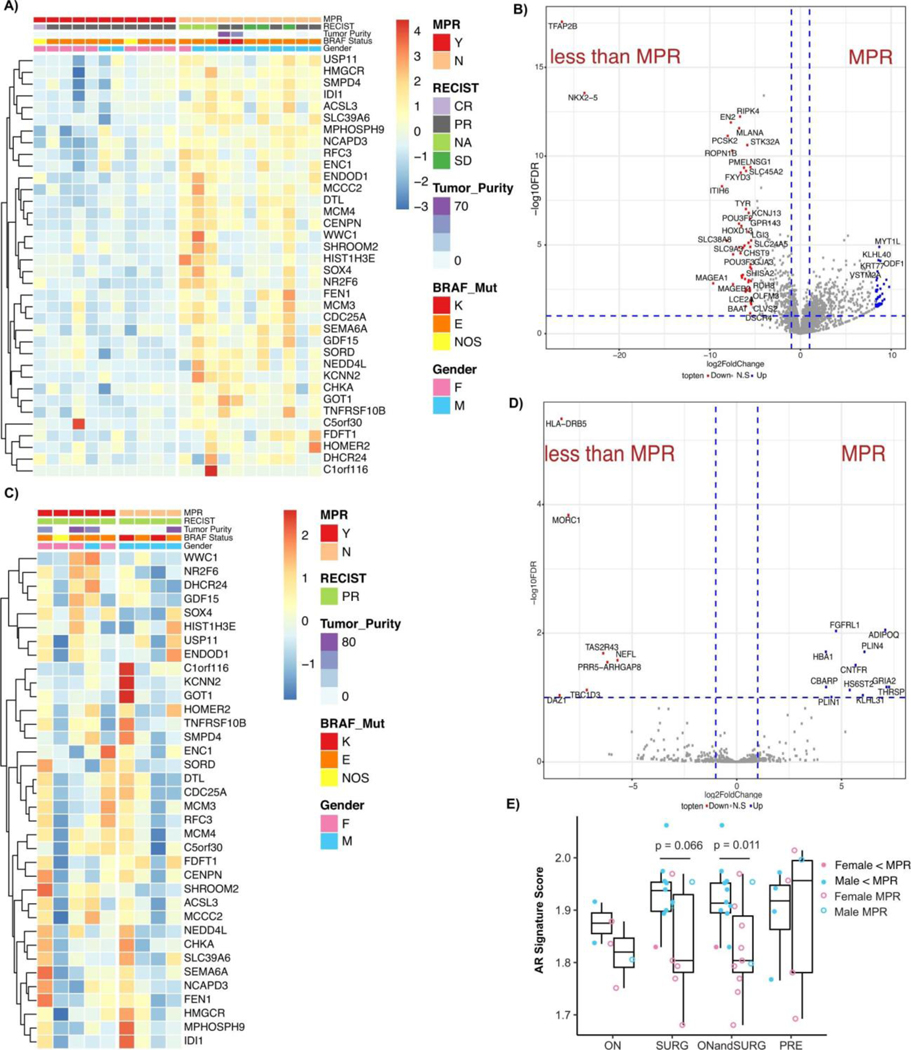
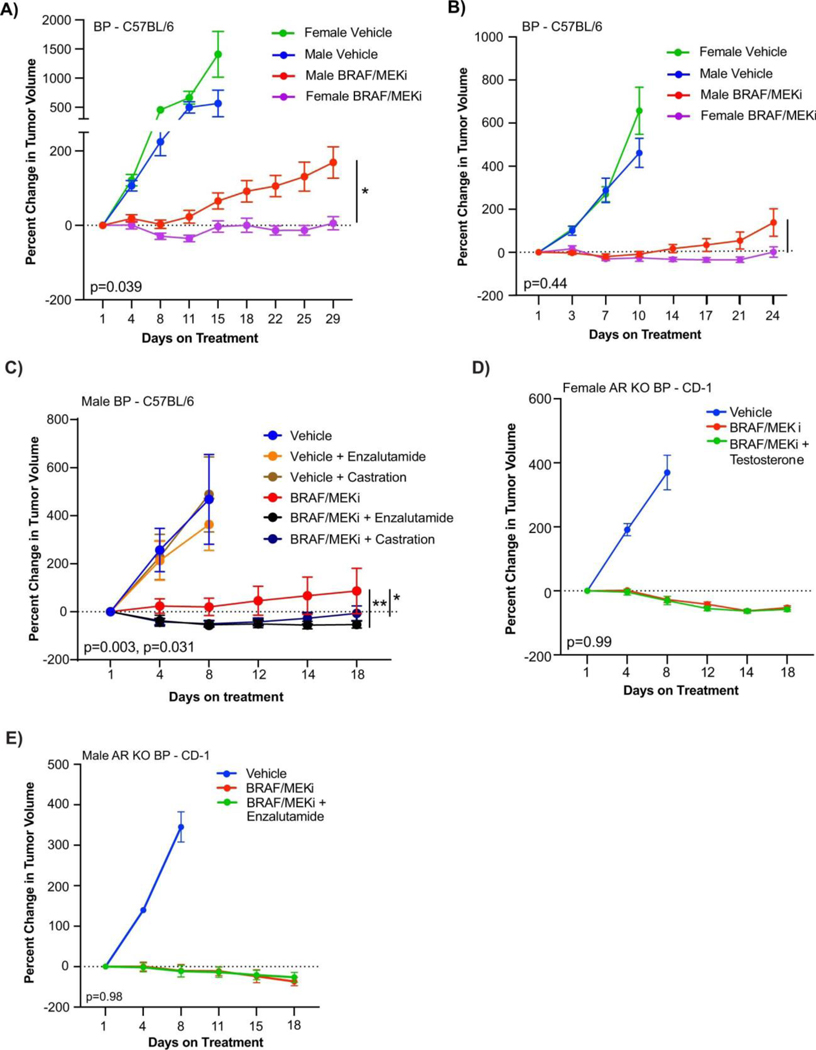
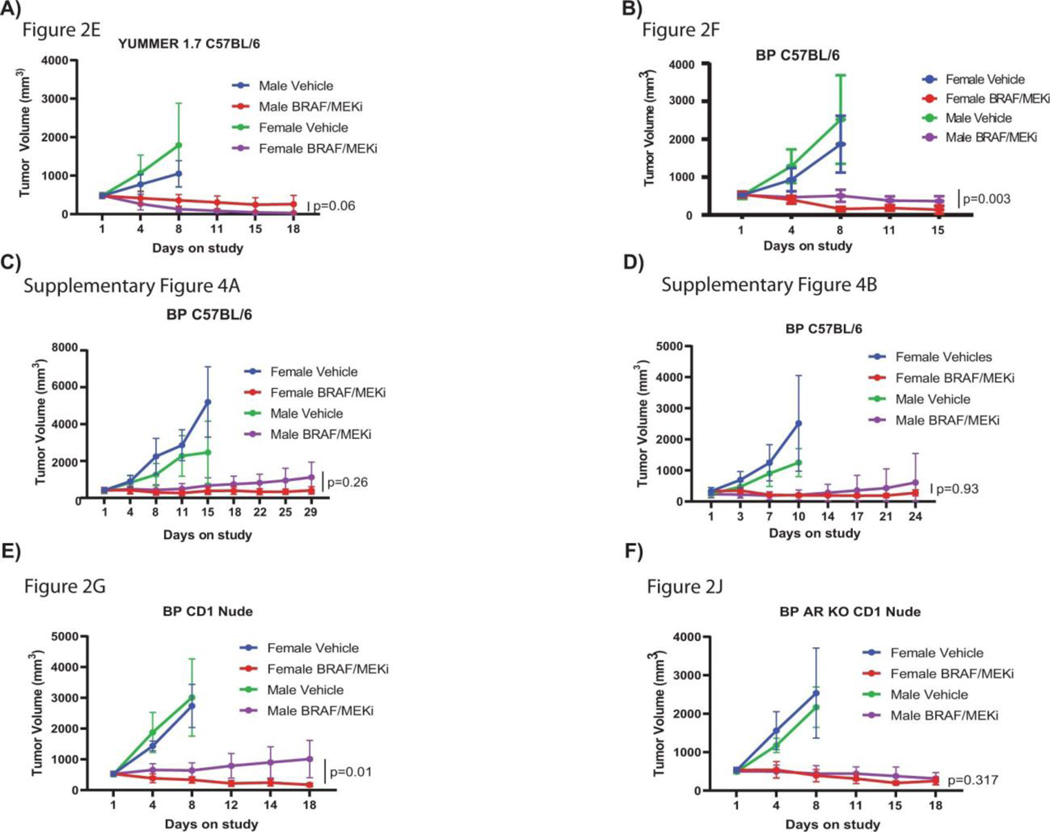
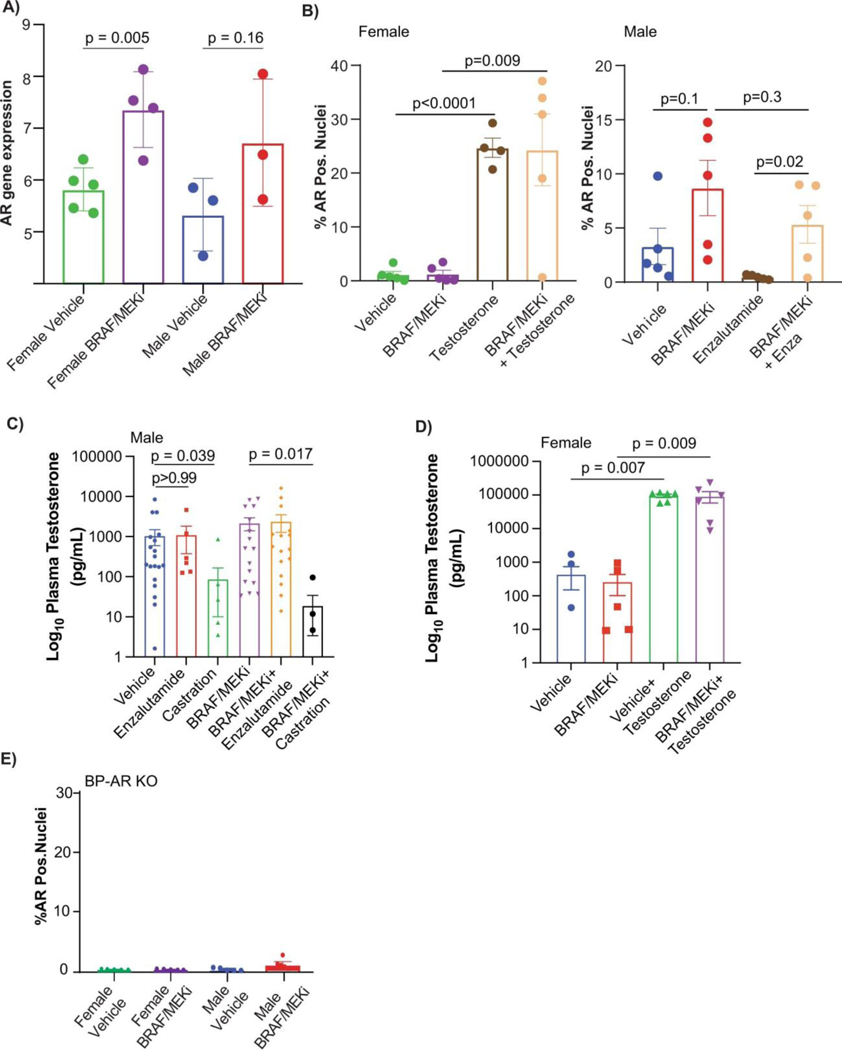
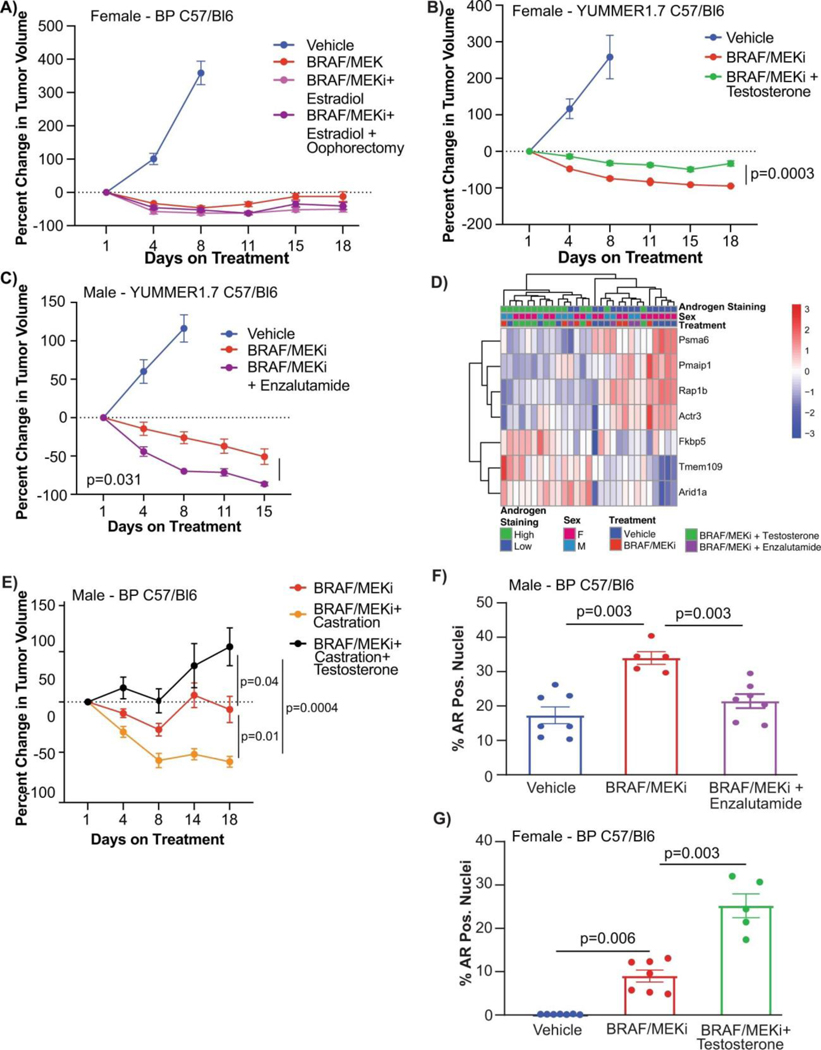
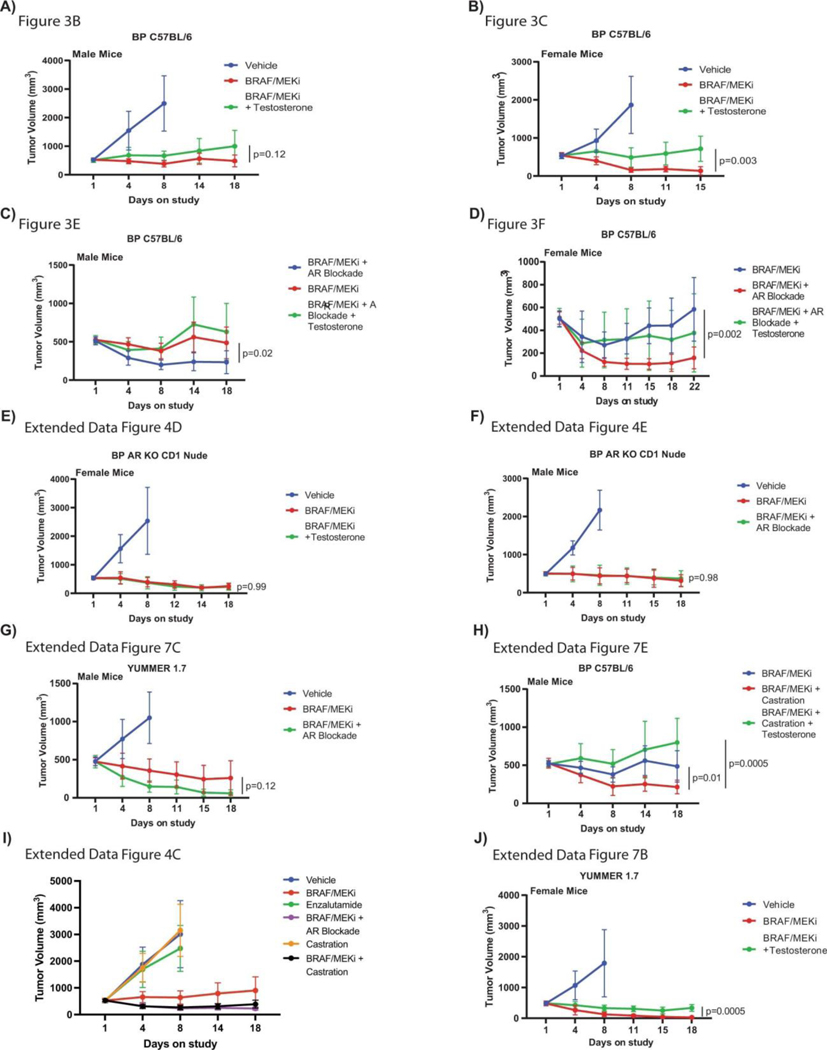
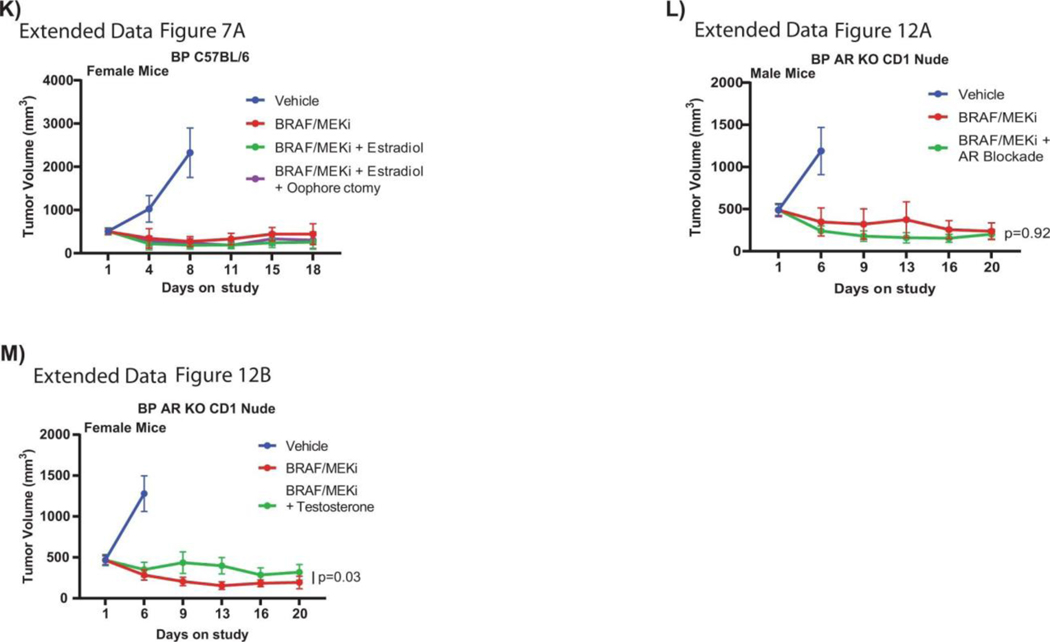
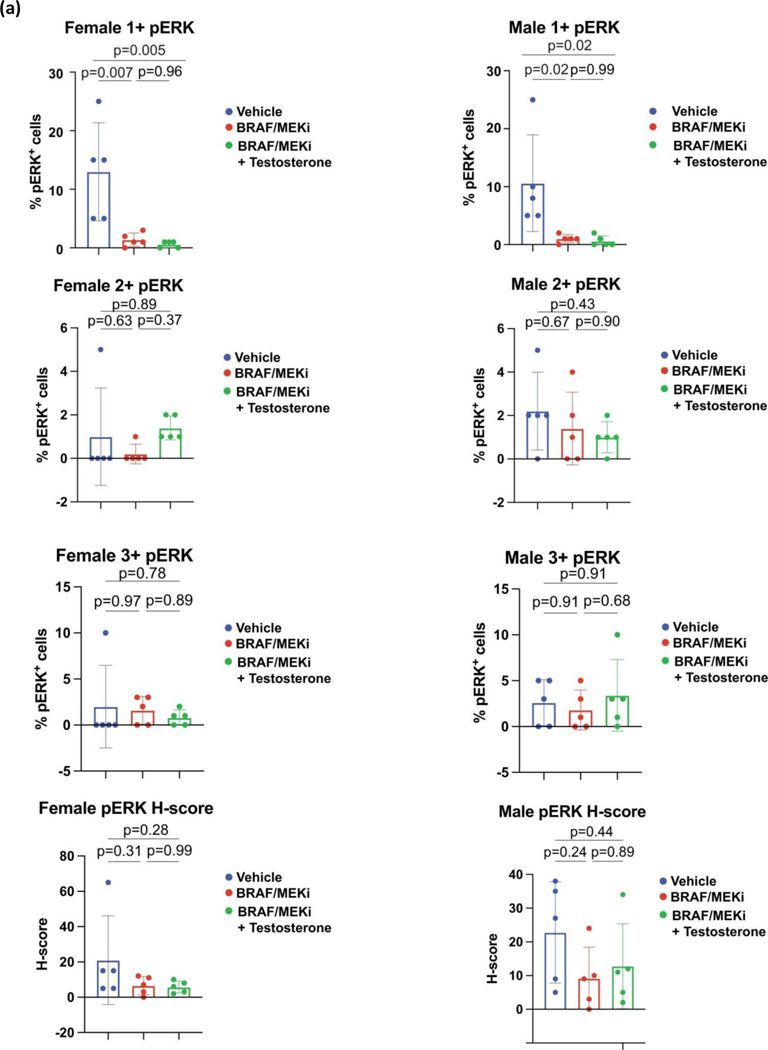
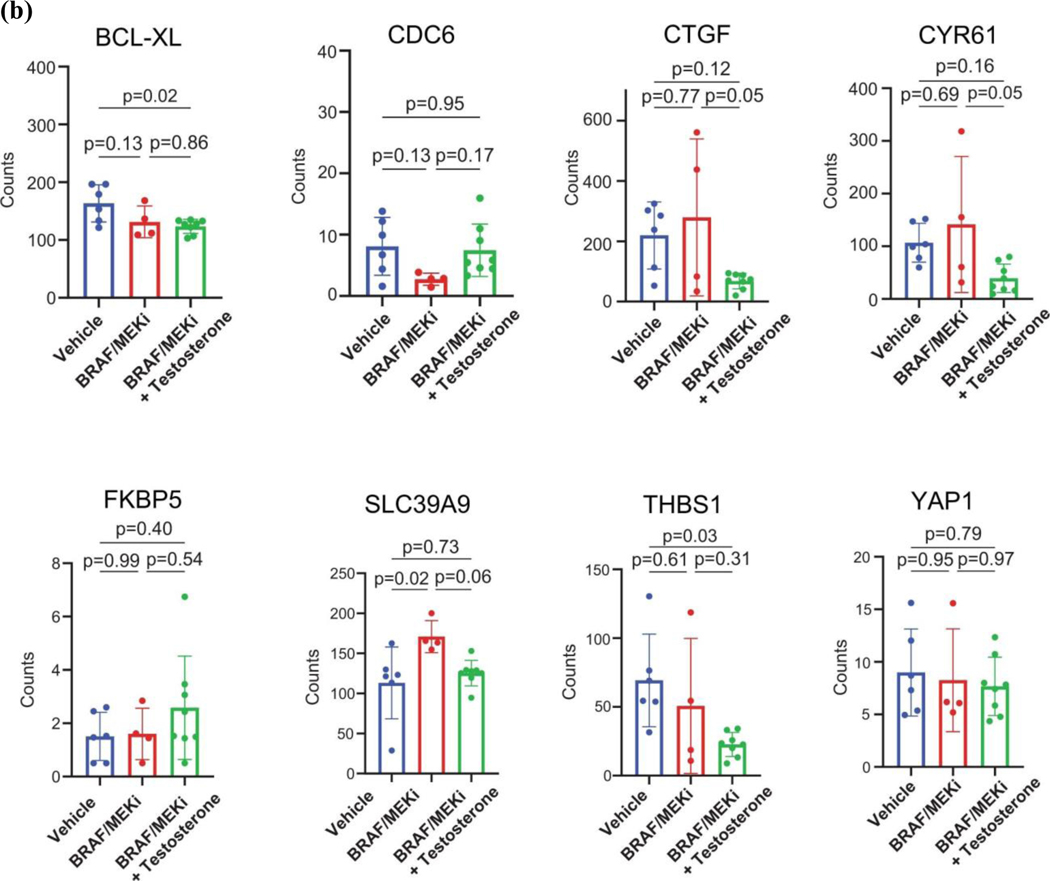
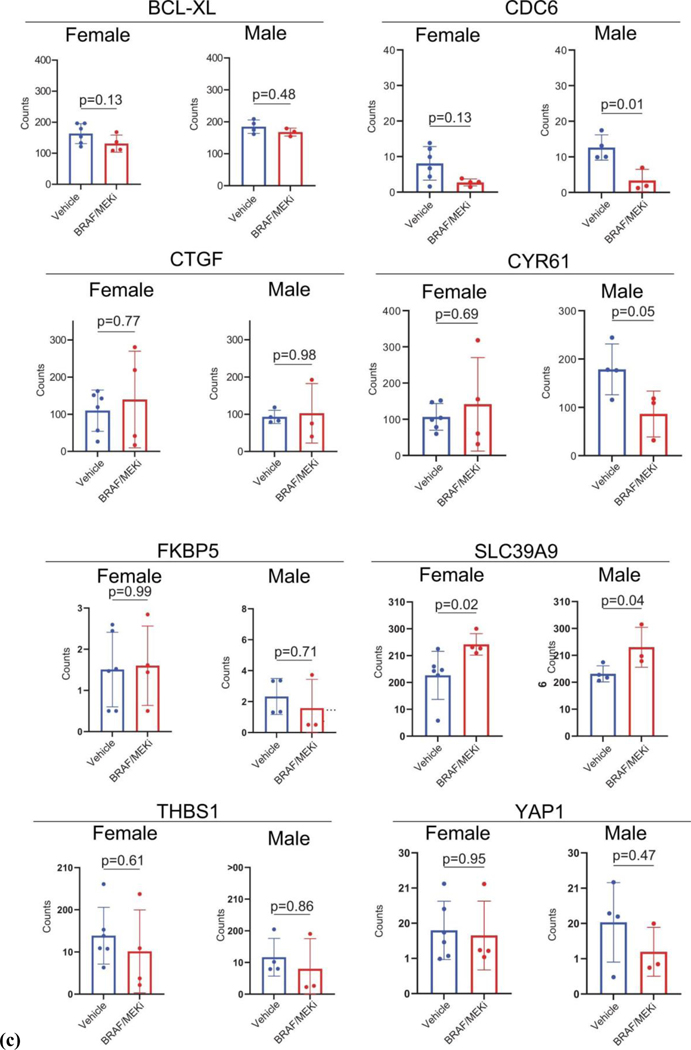
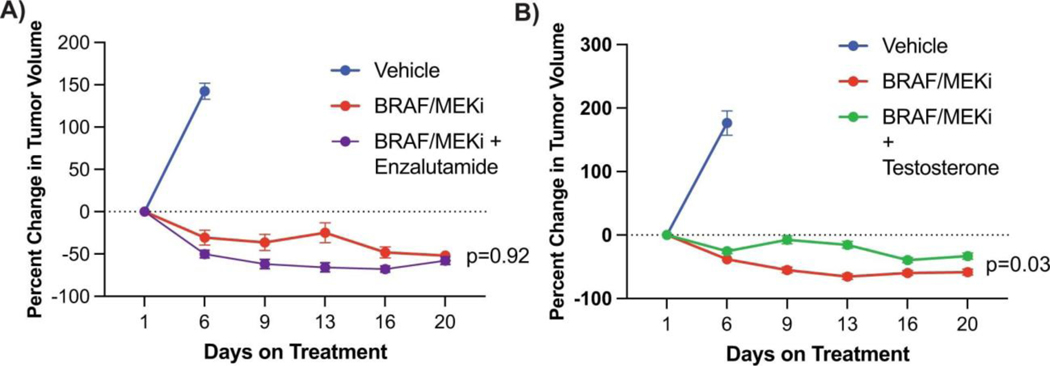
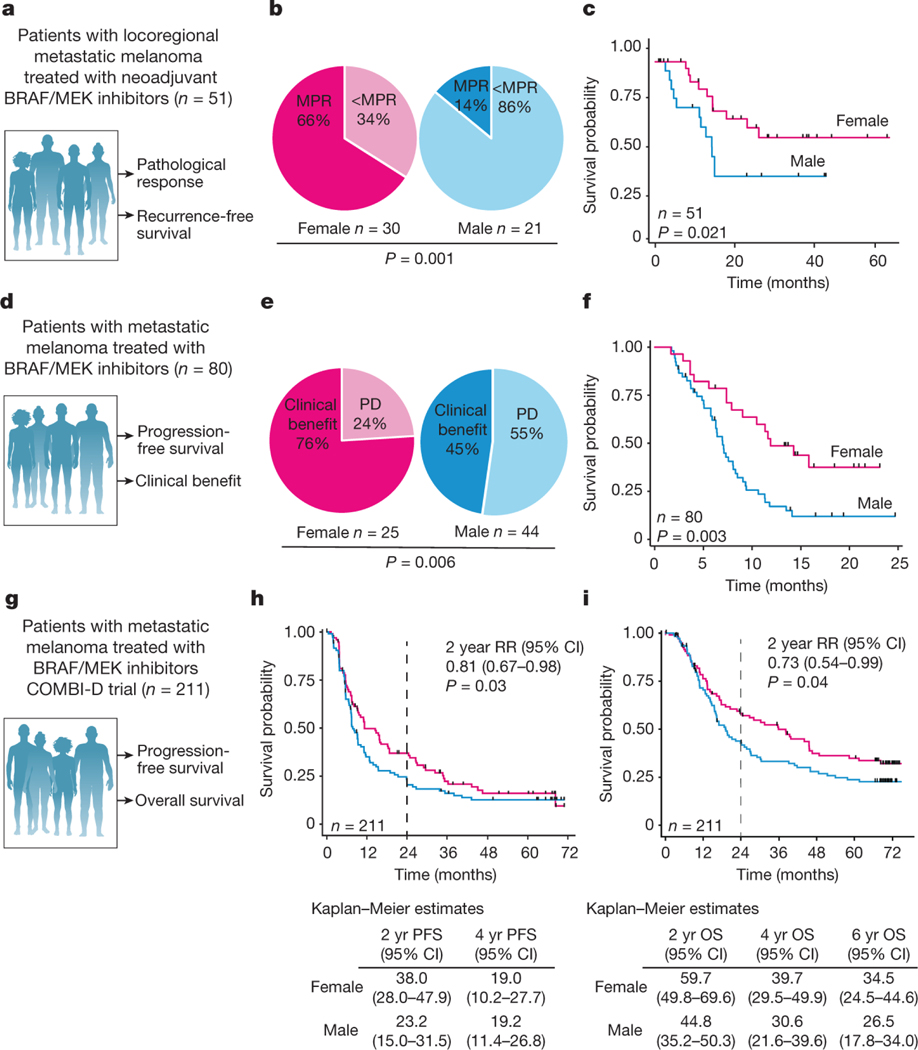
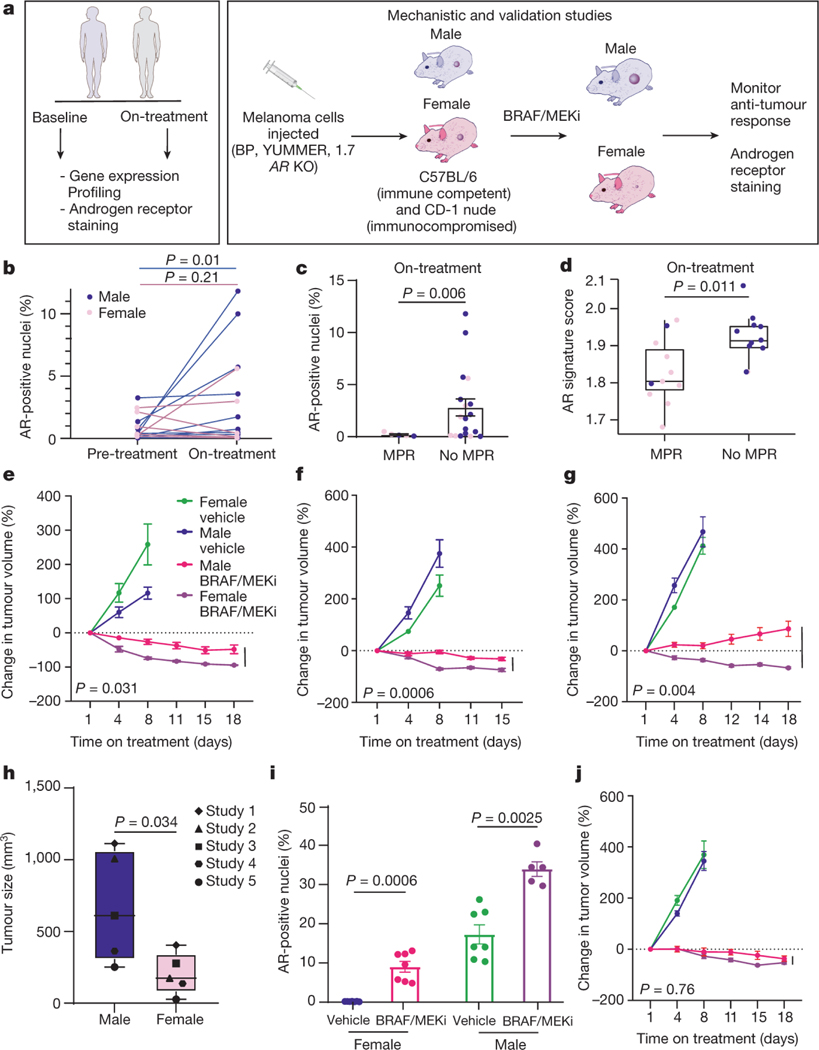
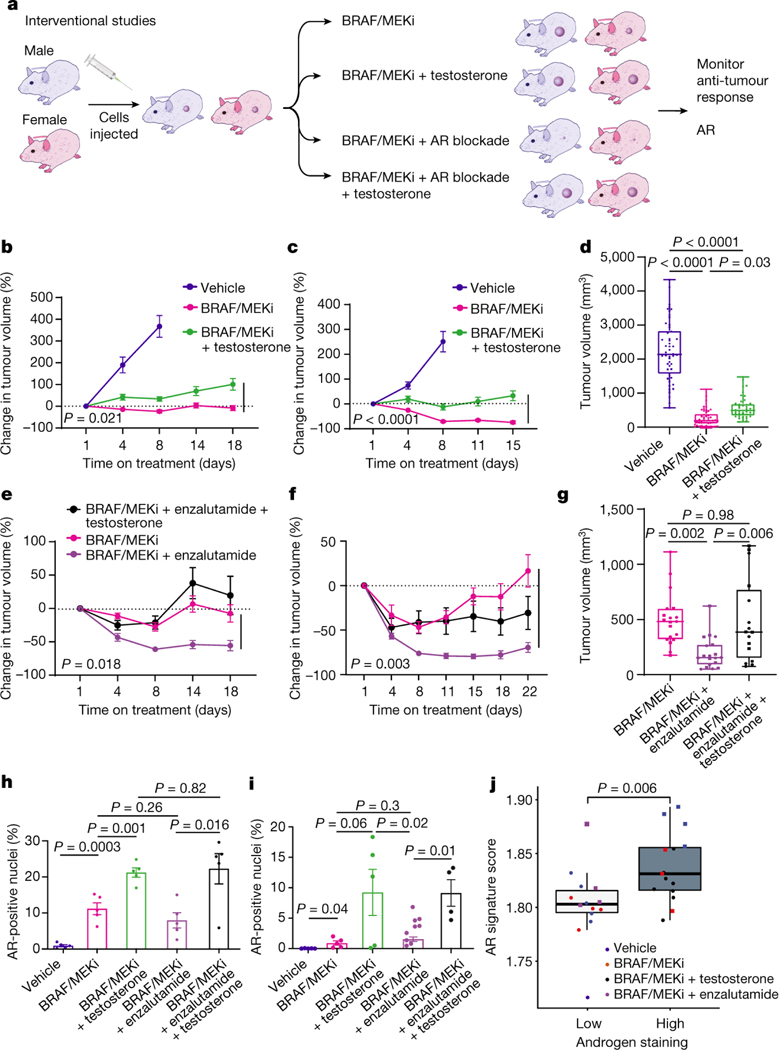
Treatment with therapy targeting BRAF and MEK (BRAF/MEK) has revolutionized care in melanoma and other cancers; however, therapeutic resistance is common and innovative treatment strategies are needed1,2. Here we studied a group of patients with melanoma who were treated with neoadjuvant BRAF/MEK-targeted therapy ( NCT02231775 , n = 51) and observed significantly higher rates of major pathological response (MPR; ≤10% viable tumour at resection) and improved recurrence-free survival (RFS) in female versus male patients (MPR, 66% versus 14%, P = 0.001; RFS, 64% versus 32% at 2 years, P = 0.021). The findings were validated in several additional cohorts2-4 of patients with unresectable metastatic melanoma who were treated with BRAF- and/or MEK-targeted therapy (n = 664 patients in total), demonstrating improved progression-free survival and overall survival in female versus male patients in several of these studies. Studies in preclinical models demonstrated significantly impaired anti-tumour activity in male versus female mice after BRAF/MEK-targeted therapy (P = 0.006), with significantly higher expression of the androgen receptor in tumours of male and female BRAF/MEK-treated mice versus the control (P = 0.0006 and P = 0.0025). Pharmacological inhibition of androgen receptor signalling improved responses to BRAF/MEK-targeted therapy in male and female mice (P = 0.018 and P = 0.003), whereas induction of androgen receptor signalling (through testosterone administration) was associated with a significantly impaired response to BRAF/MEK-targeted therapy in male and female patients (P = 0.021 and P < 0.0001). Together, these results have important implications for therapy.


Figures

Extended Data Fig. 1:
Extended Data Fig. 1:. Expanded analysis of clinical cohorts.
A) Rates of major pathologic response (MPR) based on menopausal status of female patients within the neoadjuvant cohort (p = 0.79) by logistic regression. B) Waterfall plot of percent change in tumour size by cross-sectional imaging in the neoadjuvant cohort (p = 0.54). C) Waterfall plot of percent change in tumour size by cross-sectional imaging of the pooled neoadjuvant and metastatic cohorts (p = 0.02).
Extended Data Fig. 2:
Extended Data Fig. 2:. Analysis of published cohorts of BRAF/MEK inhibited patients.
A) Schema of metastatic BRAF inhibitor monotherapy clinical cohort of patients treated with targeted therapy and their clinical outcomes studied. B) Progression free survival by sex in the metastatic BRAF inhibitor monotherapy clinical cohort (n = 212, hazard ratio 1.2 CI [0.88–1.6] p = 0.241, by Kaplan-Meier method). C) Overall survival by sex in the metastatic BRAF inhibitor monotherapy clinical cohort (n = 212, hazard ratio 1.32 CI [0.95–1.82] p = 0.095, by Kaplan-Meier method). D) Schema of metastatic MEK inhibitor monotherapy clinical cohort of patients treated with targeted therapy and their clinical outcomes studied. E) Progression free survival by sex in the metastatic MEK inhibitor monotherapy clinical cohort (n = 206, hazard ratio 1.35 CI [1.01–1.81] p = 0.043, by Kaplan-Meier method). F) Overall survival by sex in the metastatic MEK inhibitor monotherapy clinical cohort (n = 206, hazard ratio 1.61 CI [1.19–2.18] p = 0.002, by Kaplan-Meier method). G) Schema of second neoadjuvant clinical cohort of patients treated with targeted therapy and their clinical outcomes studied. H) Major pathologic response defined as ≤ 10% viable tumour in females versus males (p = 0.92, by Chi-squared). I) Recurrence free survival by sex in the second neoadjuvant cohort (n = 40, hazard ratio 1.16, 95% CI [0.36–2.07], p = 0.733, by Kaplan-Meier method). J) Kaplan Meier survival curves of overall survival by sex of melanoma patients abstracted with The Cancer Genome Atlas (p = 0.373 by univariate analysis, p = 0.369 controlling for age at diagnosis and stage). K) Paired clinical samples of circulating testosterone prior to initiation and after treatment with BRAF/MEK targeted therapy (p = 0.9453 and 0.2036 respectively by two-sided Student’s t-test). L) AR staining pre-treatment in males (blue) and females (pink) by MPR (p = 0.72, by two-sided unpaired t-test).
Extended Data Fig. 3:
Extended Data Fig. 3:. Transcriptomic analysis of clinical specimens.
A) Heatmap of AR signature genes of on-treatment specimens demonstrating upregulation of AR signature pathways. B) Volcano plot of differentially expressed genes after whole transcriptomic analysis of on-treatment with BRAF/MEK inhibition clinical specimens. Vertical dotted blue lines represent log foldchange greater than 2. Horizontal dotted blue line represents q < 0.05. Genes with log fold change greater than 5 and q < 0.05 are labelled. C) Heatmap of AR signature genes of pre-treatment specimens of AR signature pathways. D) Volcano plot of differentially expressed genes after whole transcriptomic analysis of pre-treatment with BRAF/MEK inhibition clinical specimens. E) Androgen signalling score comparing clinical samples achieving an MPR and those not achieving an MPR for those on treatment (ON, <MPR n = 2, MPR n = 4), at the time of resection (SURG, <MPR n = 9, MPR = 7; p = 0.066), aggregate of those on treatment and surgically resected (ONandSURG, <MPR = 11, MPR = 11; p = 0.011), and samples collected prior to treatment (PRE, <MPR n = 4, MPR n = 5; p = 0.95); groups were compared using a two-sided Student’s t test. Box plot represents the median bar with the box bounding interquartile range (IQR) and whiskers to the most extreme point within 1.5 x IQR.
Extended Data Fig. 4:
Extended Data Fig. 4:. Murine model of melanoma validates a sexually dimorphic response and suggests AR activity as a mechanism of resistance.
A-B) Percent change in tumour volume for male and female C57BL/6 mice implanted subcutaneously with BP cells that were treated with Vehicle or BRAF/MEKi (n = 10 mice per group; A – mice aged 9 weeks, B - mice aged 12 weeks). Results from the second and third repeats of this experiment are shown in A and B, respectively (p = 0.039 and p = 0.45). C) Percent change in tumour volume in BP injected C57BL/6 male mice treated with vehicle in the presence or absence of BRAF/MEKi with endocrine modulation through androgen blockade with enzalutamide or castration (mice aged 14 weeks). All tumour growth curves were compared by ANOVA with multiple comparisons (n = 10/group except BRAF/MEKi + castration where n = 9; p = 0.003 BRAF/MEKi vs BRAF/MEKi + Enzalutamide; p = 0.031 BRAF/MEKi vs BRAF/MEKi + Castration). D-E) Percent change in tumour volume for AR-KO BP tumours in female (D) (p = 0.99) and male (E) (p = 0.98) CD-1 mice treated with vehicle or BRAF/MEKi in combination with either testosterone or enzalutamide, respectively (n = 10 mice/group; aged 11 weeks). All tumour growth represented as mean + SEM and p-values were calculated using ANOVA with multiple comparisons.
Extended Data Fig. 5:
Extended Data Fig. 5:. Mechanistic and Validations Murine Studies Tumour Volume Curves.
A) Tumour volumes for male and female C57BL/6 mice implanted subcutaneously with YUMMER 1.7 cells treated with Vehicle or BRAF/MEK inhibition (p = 0.06 between male and female BRAF/MEKi; 30 mpk dabrafenib and 1 mpk trametinib, PO, QD). n = 10 mice per group, aged 12–13 weeks. B-D) Percent change in tumour volume for male and female C57BL/6 mice implanted subcutaneously with BP (BRAFV600E, PTEN−/−) cells (p = 0.003, 0.26, and 0.93) between male and female BRAF/MEKi. Mice were treated as in A. n = 10 mice per group; aged 12–13 weeks. The experiment was performed in triplicate with each experiment represented above. E) Tumour volumes for male and female CD-1 nude mice implanted and treated as in A (p = 0.01 between male and female BRAF/MEKi). n = 10 mice per group; aged 11 weeks. F) Tumour volumes of male and female CD-1 mice with AR-KO BP tumours treated with vehicle or BRAF/MEKi (p = 0.317 between male and female BRAF/MEKi); n = 10/group; aged 11 weeks. All tumour growth represented as mean + SEM and p-values were calculated using ANOVA with multiple comparisons.
Extended Data Fig. 6:
Extended Data Fig. 6:. AR gene and protein expression analysis of preclinical models and serum testosterone measurements of clinical specimens.
A) AR gene expression of murine BP tumours from male and female mice treated with either Vehicle or BRAFi/MEKi (female Vehicle vs Female BRAF/MEKi treated, p = 0.005, male Vehicle vs male BRAF/MEKi treated, p = 0.16) p-values were calculated using two-sided Student’s t-test B) AR immunofluorescence staining of samples from female and male mice treated with Vehicle, BRAF/MEKi, BRAF/MEKI + Testosterone (females, vehicle vs BRAF/MEKi, p = 0.005) and BRAF/MEKi + enzalutamide (males, vehicle vs BRAF/MEKi, p = 0.16). p-values were calculated by two-sided Student’s t-test. C) Plasma testosterone levels for male mice across treatment groups. Decreased plasma testosterone was noted in both the castration group as compared to Vehicle (p = 0.039) as well as the BRAF/MEKi + castration group as compared to the BRAF/MEKi group (p = 0.017). p-values were calculated using a Kruskal Wallis test. D) Plasma testosterone levels for female mice across treatment groups. Increased plasma testosterone was noted in the Vehicle + testosterone group as compared to the BRAF/MEKi group (p = 0.007) and vehicle group (p = 0.007). Similarly increased testosterone was noted in the BRAF/MEKi + testosterone group as compared to the vehicle group (p = 0.009) and BRAF/MEKi group (p = 0.009). No other associations were significant p < 0.05 by Kruskal Wallis test. E) AR immunofluorescence staining of AR-KO BP tumour samples from female and male mice treated with either Vehicle or BRAFi/MEKi. p-values were calculated by Student’s t-test. Histograms in A and B represent mean + SD whereas C and D represent mean + SEM.
Extended Data Fig. 7:
Extended Data Fig. 7:. Modulation of AR activity is associated with differential response to BRAF/MEK inhibition.
A) Percent change in tumour volume in BP injected C57BL/6 female mice treated with vehicle in the presence or absence of BRAF/MEKi with endocrine modulation with either estradiol or estradiol and oophorectomy (n = 10/group; mice aged 14 weeks). No significant effects exist within either cohort as calculated by ANOVA. B) Percent change in tumour volume for female C57BL/6 mice implanted subcutaneously with YUMMER 1.7 cells treated with BRAF/MEKi or BRAF/MEKi + testosterone (n = 10/group; aged 13 weeks, p = 0.0003 between BRAF/MEKi and BRAF/MEKi + testosterone). C) Percent change in tumour volume in YUMMER1.7 injected into C57BL/6 male mice treated with vehicle in the presence or absence of BRAF/MEKi with endocrine modulation with enzalutamide (n = 10/group; mice aged 14 weeks, p = 0.031). D) Heatmap of differentially expressed androgen responsive genes between high versus low testosterone groups q < 0.05. Groups by androgen staining levels, sex, and treatment. E) Percent change in BP tumour volume in male C57BL/6 mice treated with vehicle in the presence or absence of BRAF/MEKi with physical castration or BRAF/MEKi with castration and exogenous testosterone (n = 10/group; aged 14 weeks, p = 0.01 for BRAF/MEKi + castration versus BRAF/MEKi, p = 0.04 for BRAF/MEKi versus BRAF/MEKi + castration + testosterone, and p = 0.0004 for BRAF/MEKi + castration vs BRAF/MEKi + castration + testosterone). F) Quantification of the percent of AR+ nuclei by immunofluorescence in BP tumours from male mice treated with vehicle (n = 7), BRAF/MEKi (n = 5), or BRAF/MEKi + enzalutamide (n = 7) (p = 0.003 between BRAF/MEKi and BRAF/MEKi + enzalutamide). p-values were calculated using two-sided Student’s t-test. G) Quantification of the percent of AR+ nuclei by immunofluorescence in BP tumours from female mice treated with vehicle (n = 7), BRAF/MEKi (n = 7), BRAF/MEKi + testosterone (n = 5) (p = 0.006 between vehicle and BRAF/MEKi and p = 0.003 between BRAF/MEKi and BRAF/MEKi + testosterone in female mice). p-values were calculated using two-sided Student’s t-test. Tumour growth curves in panels A-C and E represent mean + SEM. Histograms in panels F and G represent mean + SEM. All tumour growth curves were compared by ANOVA with multiple comparisons.
Extended Data Fig. 8:
Extended Data Fig. 8:. Interventional Murine Studies Tumour Volumes.
A) Tumour volumes curves of BP tumour growth in male mice treated with vehicle (n = 10), BRAF/MEKi alone (n = 9) or BRAF/MEKi in combination with testosterone (n = 9) (p = 0.12). B) Tumour volumes curves of BP tumour growth in female mice treated with vehicle, BRAF/MEKi alone or BRAF/MEKi in combination with testosterone (p = 0.003). (n = 10 mice/group). C) Tumour volume curves of BP tumour growth in male mice treated with BRAF/MEKi alone or BRAF/MEKi in combination with AR blockade (p = 0.02) or AR blockade with testosterone (p = 0.07) (n = 10 mice/group). D) Tumour volume curves of BP tumour growth in female mice treated with BRAF/MEKi alone or BRAF/MEKi in combination with AR blockade (p = 0.002) or AR blockade with testosterone (p = 0.34) (n = 10 mice/group). E) Tumour volume curves of BP AR KO tumour growth in CD-1 nude female mice treated with vehicle in the presence or absence of BRAF/MEKi with endocrine modulation (mice aged 14 weeks). BRAF/MEKi vs BRAF/MEKi + testosterone, p = 0.99; (n = 10 mice/group). F) Tumour volume curves of AR KO BP injected CD-1 nude male mice treated with vehicle in the presence or absence of BRAF/MEKi or BRAF/MEKi + enzalutamide (p = 0.98) (n = 10 mice/group). G) Tumour volume curves of YUMMER 1.7 tumour growth in male mice treated with vehicle, BRAF/MEKi or BRAF/MEKi + AR blockade (p = 0.12) (n = 10 mice/group) H) Tumour volume curves of BP tumour growth in C57BL/6 male mice treated with BRAF/MEKi, BRAF/MEKi + castration (p = 0.01) or BRAF/MEKi + castration + testosterone (p = 0.0005) (n = 10 mice/group). I) Change in tumour volume in BP injected C57BL/6 male mice treated with vehicle in the presence or absence of BRAF/MEKi with endocrine modulation through either androgen blockade, androgen blockade with testosterone, estradiol, or castration (mice aged 14 weeks) (n = 10 mice/group). J) Tumour volume curves of YUMMER 1.7 tumour growth in female mice treated with vehicle, BRAF/MEKi or BRAF/MEKi + testosterone (p = 0.0005) (n = 10 mice/group). K) Change in tumour volume in BP injected C57BL/6 female mice treated with vehicle in the presence or absence of BRAF/MEKi with endocrine modulation with either estradiol or estradiol and oophorectomy (n = 10 mice/group; mice aged 14 weeks). L) Change in tumour volume of BP tumours injected into CD-1 nude male mice and treated with vehicle, BRAF/MEKi, or BRAF/MEKi in combination with AR blockade (n = 10 mice/group, mice aged 11 weeks, BRAF/MEKi vs BRAF/MEKi + AR blockade p = 0.92). M) Change in tumour volume of BP tumours injected into CD-1 nude female mice and treated with vehicle, BRAF/MEKi, or BRAF/MEKi in combination with testosterone (n = 10 mice/group, mice aged 11 weeks, BRAF/MEKi vs BRAF/MEKi + testosterone p = 0.03). All tumour growth curves represent mean + SEM and were compared by ANOVA with multiple comparisons.
Extended Data Fig. 9:
Extended Data Fig. 9:. Effect of BRAF/MEKi on pERK, ZIP9/YAP1 associated transcripts and YAP1 associated transcripts in BP tumours.
A) Staining and quantification of phosphor-ERK in BP tumours of female and male mice on treated with vehicles, BRAF/MEK inhibition, or BRAF/MEK inhibition + testosterone. Histogram represent mean + SD. Differences were calculated using one-way ANOVA (n = 5/group). B) Staining and quantification of ZIP9/YAP1 associated transcripts in BP tumours of female and male mice on treatment with vehicles (n = 6), BRAF/MEK inhibition (n = 4), or BRAF/MEK inhibition + testosterone (n = 8). Histogram represent mean + SD. Differences were calculated using one-way ANOVA. C) Staining and quantification of YAP1 associated transcripts in BP tumours of female and male mice on treatment with vehicles (n = 6 females, 4 males) or BRAF/MEK inhibition (n = 4 females, 3 males. Histogram represent mean + SD. Differences were calculated using one-way ANOVA.
Extended Data Fig. 10:
Extended Data Fig. 10:. Non-targeting control line in BRAF/PTEN mice.
A) Volume of BP tumours established from the BP cell line engineered to express a non-targeting CRISPR control for male CD-1 nude mice treated with vehicle, BRAF/MEKi, or BRAF/MEKi in combination with AR blockade (n = 10 mice/group) B) Volume of BP tumours established from the BP cell line engineered to express a non-targeting CRISPR control for female CD-1 nude mice treated with vehicle, BRAF/MEKi, or BRAF/MEKi in combination with testosterone (n = 10 mice/group, p = 0.01).). All tumour growth curves represent mean + SEM and were compared by ANOVA with multiple comparisons.
Figure 1.
Figure 1.. Female patients with melanoma have an improved response to BRAF/MEK inhibition compared with male patients.
a, Schematic of the neoadjuvant clinical cohort of patients treated with BRAF/MEK inhibition and their clinical outcomes studied. b, MPR (defined as ≤10% viable tumour) in female versus male patients (P = 0.001, χ 2 test). c, Recurrence-free survival by sex in the neoadjuvant patient cohort (n = 51, P = 0.021, log-normal Kaplan–Meier method). d, Schematic of the metastatic clinical cohort of patients treated with targeted therapy and their clinical outcomes studied. e, The clinical benefit of BRAF/MEK inhibition in the metastatic cohort (n = 69 evaluable) with clinical benefit defined as a complete response, partial response or stable disease on the basis of RECIST1.1 (P = 0.022, χ 2 test). f, PFS by sex in the metastatic cohort (n = 80, hazard ratio = 0.39, 95% CI = 0.24–0.62, P = 0.003, Kaplan–Meier method). g, Schematic of the COMBI-D trial clinical cohort of patients treated with BRAF/MEK inhibition and their clinical outcomes studied. h, PFS by sex in the COMBI-D cohort (2 year relative risk (RR) = 0.81, 95% CI = 0.67–0.98, P = 0.03, Kaplan–Meier method). i, Overall survival (OS) by sex in the COMBI-D cohort (2 year relative risk = 0.73, 95% CI = 0.54–0.99, P = 0.04, Kaplan–Meier method).
Figure 2:
Figure 2:. Treatment with BRAF/MEK inhibition is associated with increased AR expression and phenotype is recapitulated in preclinical models.
b, AR staining in paired pre- and post-treatment male (blue) and female (pink) patient samples show increased AR expression in male samples (P = 0.01) but not in female patient samples (P = 0.21, two-sided t-test). c, AR staining post-treatment in male (n = 14, blue) and female (n = 9, pink) patients by MPR (P = 0.006, two-sided t-test). d, Androgen signalling score in patients achieving MPR (n = 11) versus <MPR (n = 11, P = 0.011, two-sided t-test). e, The percentage change in tumour volume in C57BL/6 mice that were implanted with YUMMER1.7 cells treated with vehicle or BRAF/MEK inhibition (BRAF/MEKi) (P = 0.031 male versus female BRAF/MEKi). n = 10 mice per group, aged 12–13 weeks. f, The percentage change in tumour volume in C57BL/6 mice implanted with Braf V600E Pten −/− mouse melanoma (BP) cells (P = 0.0006; male versus female BRAF/MEKi). Mice were treated as described in a. n = 10 mice per group, aged 12–13 weeks. The experiment was performed three times (Extended Data Fig. 3a,b). g, The percentage change in tumour volume in CD-1 nude mice that were implanted and treated as described in a (P = 0.004; male versus female BRAF/MEKi). n = 10 mice per group, aged 11 weeks. h, Aggregate end-point tumour volumes (n = 10 mice per study from five independent studies, P = 0.034, two-sided t-test). Individual points represent different studies. i, The percentage of cells with AR+ nuclei in YUMMER1.7 tumours in C57BL/6 mice that were treated with vehicle (n = 7 male and n = 7 female) or BRAF/MEKi (n = 7 female (P = 0.0006), n = 5 male (P = 0.0025), two-sided t-test) for 3 days. j, The percentage change in AR-KO BP tumour growth in CD-1 mice that were treated with vehicle or BRAF/MEKi (P = 0.76, male versus female BRAF/MEKi). n = 10 per group, aged 11 weeks. The tumour growth curves shown in e, f, g and j show mean ± s.e.m. and P values were computed using analysis of variance (ANOVA) with correction for multiple comparisons. The box plots in d and h show the median (centre line), interquartile range (IQR) (box limits) and the most extreme point within 1.5 × IQR (whiskers).
Fig. 3:
Fig. 3:. Modulation of AR activity is associated with differential response to BRAF/MEK-targeted therapy.
a, Schematic of mouse studies. b,c, The percentage change in BP tumour growth in male (b) or female (c) C57BL/6 mice treated with vehicle (n = 10 male and n = 10 female mice), BRAF/MEKi alone (n = 9 male and n = 10 female mice) or BRAF/MEKi + testosterone (n = 9 male and n = 10 female mice) (P = 0.021 (male) and P < 0.0001 (female)). d, Aggregate end-point tumour volumes showing larger volumes in mice treated with BRAF/MEKi + testosterone (n = 41) versus BRAF/MEKi (n = 49) (P = 0.031). n = 50 for vehicle. The squares represent male mice, and the dots represent female mice. e,f, The percentage change in BP tumour growth in male (n = 10 per group) (e) or female (n = 10 per group) (f) C57BL/6 mice treated with BRAF/MEKi alone or BRAF/MEKi + enzalutamide (P = 0.018 (male) and P < 0.003 (female)) or enzalutamide + testosterone (P < 0.0001 (male) and P < 0.0001 (female)). g, Aggregate end-point tumour volumes showing smaller volumes in mice treated with BRAF/MEKi + enzalutamide versus BRAF/MEKi (P = 0.002) and larger tumour volumes with the addition of testosterone (P = 0.005). The squares represent male mice and the dots represent female mice. Data from b and c are from the same experiment, and data from e and f are from separate experiments. h,i, Quantification of the percentage of AR+ nuclei by immunofluorescence analysis of BP tumour samples collected from male mice treated as indicated for 18 days (n = 5 per group; vehicle versus BRAF/MEKi (P = 0.0003), BRAF/MEKi versus BRAF/MEKi + testosterone (P = 0.001)) (h) or female mice treated for 15 days (i) (vehicle (n = 5) versus BRAF/MEKi (n = 5) (P = 0.04), BRAF/MEKi + testosterone (n = 5) versus BRAF/MEKi + enzalutamide (n = 9) (P = 0.02), BRAF/MEKi + enzalutamide versus BRAF/MEKi + enzalutamide + testosterone (n = 4) (P = 0.01)). P values were calculated using two-sided t-tests. Data are mean ± s.e.m. j, Androgen signalling score comparing mouse tumours with low (n = 14; female, vehicle; female, BRAF/MEKi; and male, BRAF/MEKi + enzalutamide) versus high (n = 15; male, vehicle; male, BRAF/MEKi; and female, BRAF/MEKi + testosterone) androgen staining (P = 0.0059). The squares represent male mice and the dots represent female mice. The box plots in d, g and j show the median (centre line), interquartile range (IQR) (box limits) and the most extreme point within 1.5 × IQR (whiskers). The tumour growth curves in b, c, e and f show mean ± s.e.m.

Comment in

References

    1. Long GV et al. Factors predictive of response, disease progression, and overall survival after dabrafenib and trametinib combination treatment: a pooled analysis of individual patient data from randomised trials. Lancet Oncol 17, 1743–1754, doi: 10.1016/S1470-2045(16)30578-2 (2016). - DOI - PubMed
    1. Robert C. et al. Five-Year Outcomes with Dabrafenib plus Trametinib in Metastatic Melanoma. The New England journal of medicine 381, 626–636, doi: 10.1056/NEJMoa1904059 (2019). - DOI - PubMed
    1. Flaherty KT et al. Improved survival with MEK inhibition in BRAF-mutated melanoma. N Engl J Med 367, 107–114, doi: 10.1056/NEJMoa1203421 (2012). - DOI - PubMed
    1. Long GV et al. Neoadjuvant dabrafenib combined with trametinib for resectable, stage IIIB-C, BRAF(V600) mutation-positive melanoma (NeoCombi): a single-arm, open-label, single-centre, phase 2 trial. Lancet Oncol 20, 961–971, doi: 10.1016/S1470-2045(19)30331-6 (2019). - DOI - PubMed
    1. Leung JK & Sadar MD Non-Genomic Actions of the Androgen Receptor in Prostate Cancer. Front Endocrinol (Lausanne) 8, 2, doi: 10.3389/fendo.2017.00002 (2017). - DOI - PMC - PubMed

MeSH terms

Substances