. 2023 Jan;252(1):208-219.
doi: 10.1002/dvdy.507. Epub 2022 Jul 8.

A method to investigate muscle target-specific transcriptional signatures of single motor neurons

Affiliations

A method to investigate muscle target-specific transcriptional signatures of single motor neurons

Bianka Berki et al. Dev Dyn. 2023 Jan.

Abstract

Background: Motor neurons in the vertebrate spinal cord have long served as a paradigm to study the transcriptional logic of cell type specification and differentiation. At limb levels, pool-specific transcriptional signatures first restrict innervation to only one particular muscle in the periphery, and get refined, once muscle connection has been established. Accordingly, to study the transcriptional dynamics and specificity of the system, a method for establishing muscle target-specific motor neuron transcriptomes would be required.

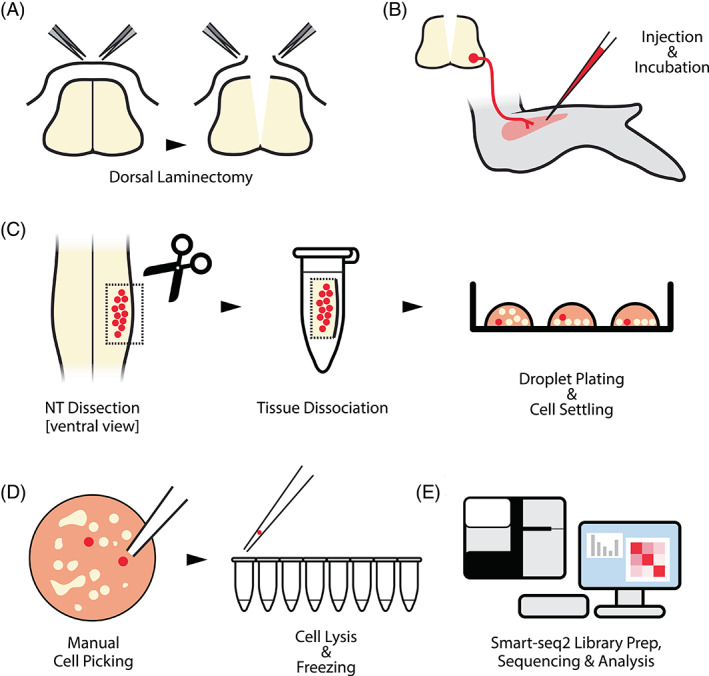
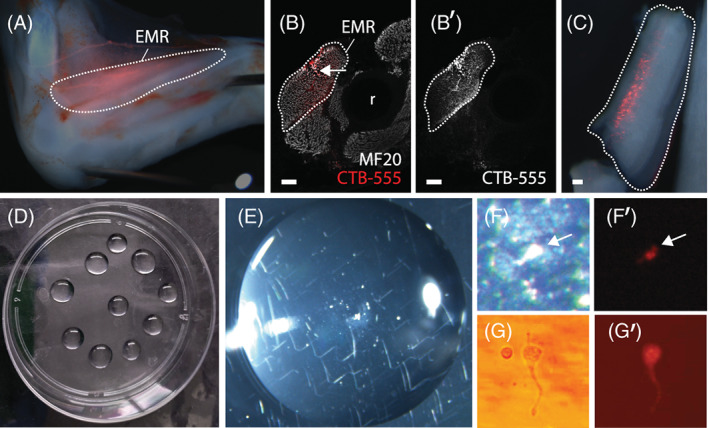
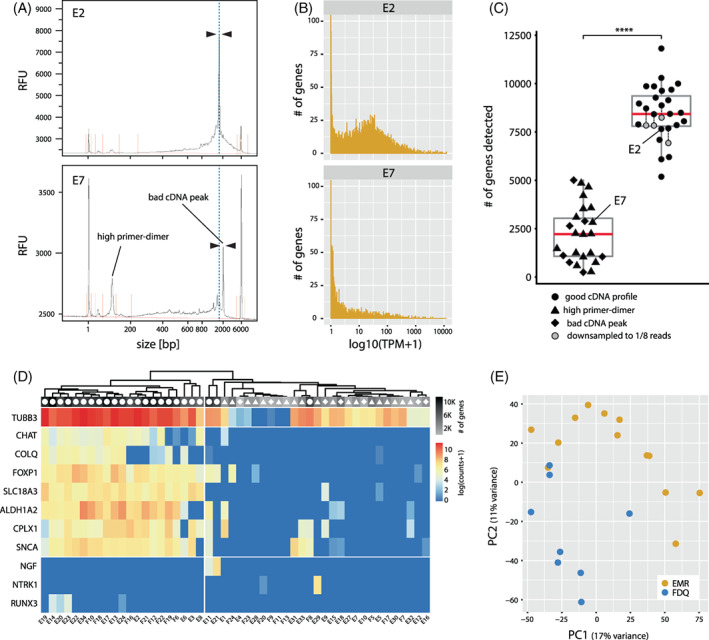
Results: To investigate target-specific transcriptional signatures of single motor neurons, here we combine ex-ovo retrograde axonal labeling in mid-gestation chicken embryos with manual isolation of individual fluorescent cells and Smart-seq2 single-cell RNA-sequencing. We validate our method by injecting the dorsal extensor metacarpi radialis and ventral flexor digiti quarti wing muscles and harvesting a total of 50 fluorescently labeled cells, in which we detect up to 12,000 transcribed genes. Additionally, we present visual cues and cDNA metrics predictive of sequencing success.

Conclusions: Our method provides a unique approach to study muscle target-specific motor neuron transcriptomes at a single-cell resolution. We anticipate that our method will provide key insights into the transcriptional logic underlying motor neuron pool specialization and proper neuromuscular circuit assembly and refinement.

Keywords: Smart-seq2; axonal backfill; limb motor neuron-muscle connection; manual cell picking; neural tube dissociation; single motor neuron sequencing.


Figures

FIGURE 1
FIGURE 1
Complete workflow of the method. (A) Schematic representing the dorsal laminectomy to ensure good oxygenation of the spinal neurons. The dorsal part of the vertebra is removed, together with the opening of the roof plate. (B) A fluorescent tracer (eg, CTB‐555) is injected into the target muscle and embryos are incubated for 5 hours in ex‐ovo culture, allowing the fluorescent tracer to be transported to the soma of spiral motor neurons. (C) After backfill culturing, the neural tube is dissected. The success of retrograde tracing is assessed under stereomicroscope and fluorescent neural tissue is isolated. Following papain dissociation, the cells are resuspended and plated in Neurobasal plating media for subsequent manual purification. (D) Healthy‐looking fluorescent cells are separated from debris and nonfluorescent cells by aspiration. Once the cells are washed in PBS, they are transferred into lysis buffer in a single tube of a PCR strip on ice. Lysed cells can be kept at –80°C until further processing. (E) Smart‐seq2 libraries are prepared and sequenced, and the obtained cell transcriptomes are checked for overall quality and analyzed to detect the expression of specific marker genes
FIGURE 2
FIGURE 2
Inventory of tools and equipment required. (A) (1) PCR tubes, if possible, with individual lids (Eppendorf), (2) two black SYLGARD coated Petri dishes (10 cm and 15 cm), (3) mouth pipette with a syringe filter and valve to control the flow rate, (4) dissection forceps (FST size 55), (5) sterile micropipettes (ORIGIO MBB‐FP‐M‐0), and (6) clear 6 cm Petri dishes for PBS washes. (B) (1) Heating lamp to maintain culture temperature, (2) thermometer, and (3) sandstone connected via a plastic tube and valve regulator to a pressurized oxygen bottle. (C) Image of embryos in culture during retrograde labeling experiment. The sandstone provides oxygenation, and the temperature is monitored during the entire incubation time. (D) Fluorescent stereomicroscope (Leica MZ10 F, with 1.6× ApoPlan lens, connected to a Leica EL6000 fluorescent light source) used for cell picking
FIGURE 3
FIGURE 3
Retrograde labeling and EMR muscle injection quality check. (A) CTB‐555 injection site in the EMR muscle. The white dotted line shows the extent of the muscle. (B) Transversal cross‐section of an injected limb with muscles in gray (MF20). The white dotted line shows the EMR muscle and the white arrow points to deformities at the injection site, r for radius. (B′) Fluorescent image of the CTB‐555 injection site in the EMR muscle with no signal in adjacent muscles. (C) Fluorescent signal in the ventral neural tube after retrograde labeling. The white dotted line shows the dissected portion of the neural tube. (D) The post‐dissociation cell suspension is plated in drops. (E) Close‐up image of a drop of cell suspension. Note that most of the cells are grouped in the middle of the drops. (F and F′) Bright field and fluorescent image of a red fluorescent plated cell. Note the concentration of cells and debris at this first stage of cell picking. The white arrow is showing a single labeled cell. (G and G′) Bright field and fluorescent image of a single isolated red fluorescent cell after several rounds of PBS washes. We can even observe the axon projection of the neuron
FIGURE 4
FIGURE 4
Representative results of individual neuron sequencing. (A) Fragment Analyzer cDNA profiles of two individual cells (E2 and E7). The top panel shows the profile of a high‐quality cell, with a main peak around 1650 to 1700 bp (black arrowheads, approximately 8000 RFUs).The bottom panel shows the profile of a low‐quality cell with the main peak fainter shifted toward 2000 bp (black arrowheads, 3000 RFUs) and the relative primer‐dimer concentration is higher. (B) TPM (transcript per million) distribution in a high‐quality cell (E2) and low‐quality cell (E7). (C) Box plot representing the number of genes detected per sample. Different quality assessments of cDNA profiles are represented by different geometric shapes (circles, triangles, and diamonds). Samples with a good cDNA profile show a significantly higher number of genes detected (Wilcoxon rank sum test, P < .0001). (D) Heat map of selected marker transcript numbers. Cells are grouped by unsupervised hierarchical clustering (muscle connectivity labeled by E: EMR and F: FDQ). The overall number of genes detected per cell is indicated by grayscale, and the quality of their cDNA profiles by different geometric shapes (see legend of panel C). (E) Principal component analysis (PCA) of gene expression levels of motor neurons innervating EMR and FDQ, based on the top 500 most variably expressed genes

Similar articles

Cited by

References

    1. Sagner A, Briscoe J. Establishing neuronal diversity in the spinal cord: a time and a place. Development. 2019;146(22):dev182154. doi:10.1242/dev.182154 - DOI - PubMed
    1. Arber S, Ladle DR, Lin JH, Frank E, Jessell TM. ETS gene Er81 controls the formation of functional connections between group Ia sensory afferents and motor neurons. Cell. 2000;101(5):485‐498. doi:10.1016/S0092-8674(00)80859-4 - DOI - PubMed
    1. Dasen JS, Tice BC, Brenner‐Morton S, Jessell TM. A Hox regulatory network establishes motor neuron pool identity and target‐muscle connectivity. Cell. 2005;123(3):477‐491. doi:10.1016/j.cell.2005.09.009 - DOI - PubMed
    1. Price SR, De Marco Garcia NV, Ranscht B, Jessell TM. Regulation of motor neuron pool sorting by differential expression of type II cadherins. Cell. 2002;109(2):205‐216. doi:10.1016/S0092-8674(02)00695-5 - DOI - PubMed
    1. Price SR, Briscoe J. The generation and diversification of spinal motor neurons: signals and responses. Mech Dev. 2004;121(9):1103‐1115. doi:10.1016/j.mod.2004.04.019 - DOI - PubMed

Publication types