Elucidating gene expression patterns across multiple biological contexts through a large-scale investigation of transcriptomic datasets
- PMID: 35705903
- PMCID: PMC9202106
- DOI: 10.1186/s12859-022-04765-0
Elucidating gene expression patterns across multiple biological contexts through a large-scale investigation of transcriptomic datasets
Abstract
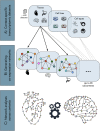
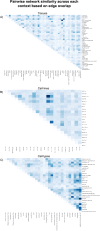
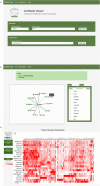
Distinct gene expression patterns within cells are foundational for the diversity of functions and unique characteristics observed in specific contexts, such as human tissues and cell types. Though some biological processes commonly occur across contexts, by harnessing the vast amounts of available gene expression data, we can decipher the processes that are unique to a specific context. Therefore, with the goal of developing a portrait of context-specific patterns to better elucidate how they govern distinct biological processes, this work presents a large-scale exploration of transcriptomic signatures across three different contexts (i.e., tissues, cell types, and cell lines) by leveraging over 600 gene expression datasets categorized into 98 subcontexts. The strongest pairwise correlations between genes from these subcontexts are used for the construction of co-expression networks. Using a network-based approach, we then pinpoint patterns that are unique and common across these subcontexts. First, we focused on patterns at the level of individual nodes and evaluated their functional roles using a human protein-protein interactome as a referential network. Next, within each context, we systematically overlaid the co-expression networks to identify specific and shared correlations as well as relations already described in scientific literature. Additionally, in a pathway-level analysis, we overlaid node and edge sets from co-expression networks against pathway knowledge to identify biological processes that are related to specific subcontexts or groups of them. Finally, we have released our data and scripts at https://zenodo.org/record/5831786 and https://github.com/ContNeXt/ , respectively and developed ContNeXt ( https://contnext.scai.fraunhofer.de/ ), a web application to explore the networks generated in this work.
Keywords: Biological context; Co-expression networks; Gene expression; Network biology; Transcriptomic.
© 2022. The Author(s).
Conflict of interest statement
DDF received salary from Enveda Biosciences. Other authors do not declare any competing interests.
Figures


Similar articles
-
Towards a global investigation of transcriptomic signatures through co-expression networks and pathway knowledge for the identification of disease mechanisms.Nucleic Acids Res. 2021 Aug 20;49(14):7939-7953. doi: 10.1093/nar/gkab556. Nucleic Acids Res. 2021. PMID: 34197603 Free PMC article.
-
SOPHIE: Generative Neural Networks Separate Common and Specific Transcriptional Responses.Genomics Proteomics Bioinformatics. 2022 Oct;20(5):912-927. doi: 10.1016/j.gpb.2022.09.011. Epub 2022 Oct 7. Genomics Proteomics Bioinformatics. 2022. PMID: 36216026 Free PMC article.
-
SuperSpot: coarse graining spatial transcriptomics data into metaspots.Bioinformatics. 2024 Dec 26;41(1):btae734. doi: 10.1093/bioinformatics/btae734. Bioinformatics. 2024. PMID: 39657949 Free PMC article.
-
Co-expression networks for plant biology: why and how.Acta Biochim Biophys Sin (Shanghai). 2019 Sep 6;51(10):981-988. doi: 10.1093/abbs/gmz080. Acta Biochim Biophys Sin (Shanghai). 2019. PMID: 31436787 Review.
-
Retrospective analysis: reproducibility of interblastomere differences of mRNA expression in 2-cell stage mouse embryos is remarkably poor due to combinatorial mechanisms of blastomere diversification.Mol Hum Reprod. 2018 Jul 1;24(7):388-400. doi: 10.1093/molehr/gay021. Mol Hum Reprod. 2018. PMID: 29746690
Cited by
-
On the correspondence between the transcriptomic response of a compound and its effects on its targets.BMC Bioinformatics. 2023 May 19;24(1):207. doi: 10.1186/s12859-023-05337-6. BMC Bioinformatics. 2023. PMID: 37208587 Free PMC article.
-
The Evolution and Role of Molecular Tools in Measuring Diversity and Genomic Selection in Livestock Populations (Traditional and Up-to-Date Insights): A Comprehensive Exploration.Vet Sci. 2024 Dec 6;11(12):627. doi: 10.3390/vetsci11120627. Vet Sci. 2024. PMID: 39728967 Free PMC article. Review.
-
GeneCOCOA: Detecting context-specific functions of individual genes using co-expression data.PLoS Comput Biol. 2025 Mar 31;21(3):e1012278. doi: 10.1371/journal.pcbi.1012278. eCollection 2025. PLoS Comput Biol. 2025. PMID: 40163580 Free PMC article.
-
The uncertainties and certainties of gene transcription in a human tumor cell.Heliyon. 2024 Jul 31;10(15):e35529. doi: 10.1016/j.heliyon.2024.e35529. eCollection 2024 Aug 15. Heliyon. 2024. PMID: 39166023 Free PMC article.
-
Multi-omics data integration identifies novel biomarkers and patient subgroups in inflammatory bowel disease.J Crohns Colitis. 2025 Jan 11;19(1):jjae197. doi: 10.1093/ecco-jcc/jjae197. J Crohns Colitis. 2025. PMID: 39756419 Free PMC article.
References
MeSH terms
Grants and funding
LinkOut - more resources
Full Text Sources

