. 2022 Jun 15;22(1):1191.
doi: 10.1186/s12889-022-13572-4.

Neighborhood social cohesion and serious psychological distress among Asian, Black, Hispanic/Latinx, and White adults in the United States: a cross-sectional study

Affiliations

Neighborhood social cohesion and serious psychological distress among Asian, Black, Hispanic/Latinx, and White adults in the United States: a cross-sectional study

Lauren R Gullett et al. BMC Public Health. .

Abstract

Background: Serious psychological distress (SPD) is common and more prevalent in women, older adults, and individuals with a low-income. Prior studies have highlighted the role of low neighborhood social cohesion (nSC) in potentially contributing to SPD; however, few have investigated this association in a large, nationally representative sample of the United States. Therefore, our objective was to investigate the overall and racial/ethnic-, sex/gender-, self-rated health status-, age-, and household income-specific relationships between nSC and SPD.

Methods: We used data from survey years 2013 to 2018 of the National Health Interview Survey to investigate nSC and SPD among Asian, Non-Hispanic (NH)-Black, Hispanic/Latinx, and NH-White men as well as women in the United States (N = 168,573) and to determine modification by race/ethnicity, sex/gender, self-rated health status, age, and annual household income. nSC was measured by asking participants four questions related to the trustworthiness and dependability of their neighbors. nSC scores were trichotomized into low (< 12), medium (12-14), and high (15-16). SPD was measured using the Kessler 6 psychological distress scale with scores ≥ 13 indicating SPD. After adjusting for sociodemographic, health behavior, and clinical confounders, we used Poisson regression with robust variance to estimate prevalence ratios (PRs) and 95% confidence intervals (CIs).

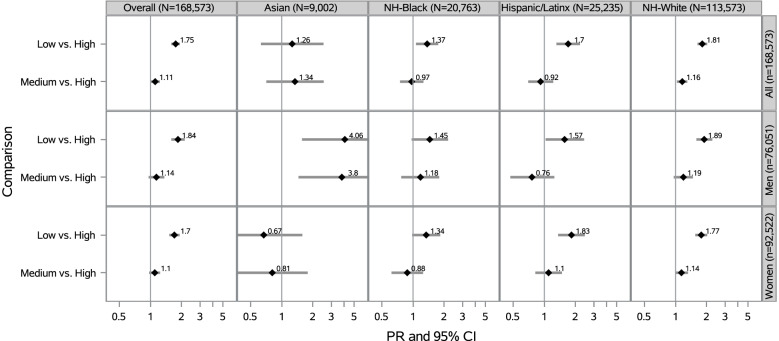
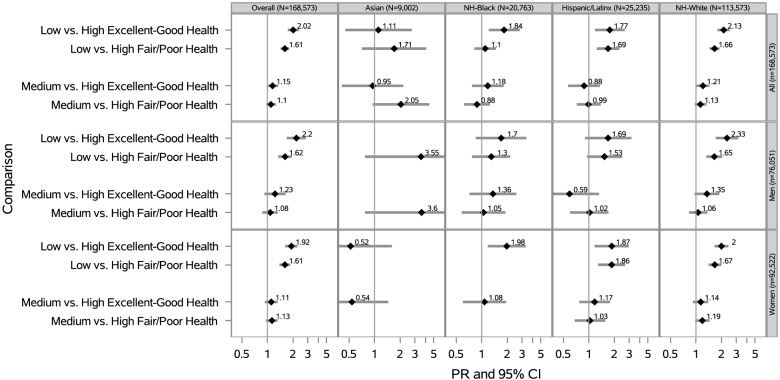
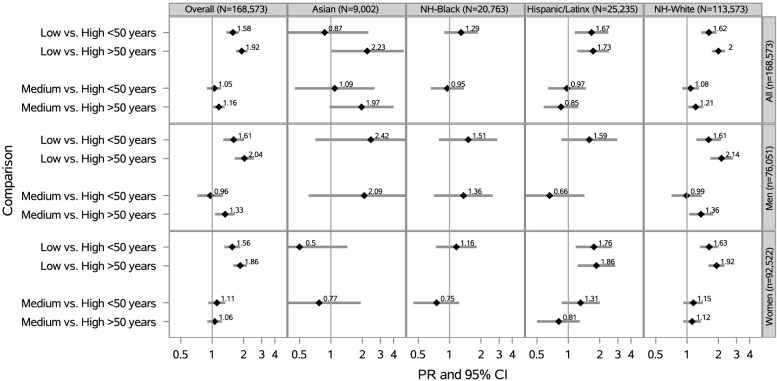
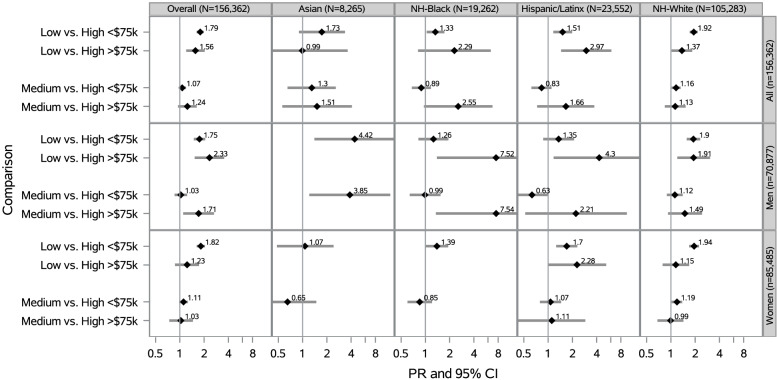
Results: Among 168,573 participants, most were Non-Hispanic (NH)-White (69%), and mean age was 47 ± 0.01 years. After adjustment, low vs. high nSC was associated with a 75% higher prevalence of SPD overall (PR = 1.75 [1.59-1.92]), 4 times the prevalence of SPD among Asian men (PR = 4.06 [1.57-10.50]), 2 times the prevalence of SPD among participants in at least good health (PR = 2.02 [95% CI: 1.74-2.35]), 92% higher prevalence of SPD among participants ≥ 50 years old (PR = 1.92 [1.70-2.18]), and approximately 3 times the prevalence of SPD among Hispanic/Latinx participants with household incomes ≥ $75,000 (PR = 2.97 [1.45-6.08]).

Conclusions: Low nSC was associated with higher SPD in the overall population and the magnitude of the association was higher in Asian men, participants who reported good health, older participants, and Hispanic/Latinx adults with higher household incomes. Future research should continue to examine how neighborhood contexts can affect health across various sociodemographic groups, especially among groups with multiple marginalized social identities.

Keywords: Community support; Economic status; Mental health; Psychological distress; Race factors; Residence characteristics.


Conflict of interest statement

The authors declare that they have no competing interests.

Figures

Fig. 1
Fig. 1
Prevalence of Serious Psychological Distress among the Overall Population and by Race/Ethnicity (N = 168,573). Percentage of participants overall and within racial/ethnic groups who have serious psychological distress. Serious psychological distress measured as score ≥ 13 based on the Kessler-6 scale
Fig. 2
Fig. 2
Prevalence of SPD by nSC Level, Overall and by Race/Ethnicity (N = 168,573). Percentage of participants (overall and by race/ethnicity) living in low, medium, and high levels of neighborhood social cohesion who are seriously psychologically distressed and not seriously psychologically distressed. Serious psychological distress measured as score ≥ 13 based on the Kessler-6 scale
Fig. 3
Fig. 3
Prevalence Ratios of SPD by nSC, Overall and Stratified by Race/Ethnicity and Sex/Gender (N = 168,573). PR = Prevalence Ratio; CI = Confidence Interval; Adjusted for age (18–30, 31–49, ≥ 50 years), educational attainment (< high school, high school graduate, some college, ≥ college), annual household income (< $35,000, $35,000-$74,999, $75,000 +), occupational class (professional/management, support services, laborers), region of residence (Northeast, Midwest, South, West), alcohol consumption (never, former, current), “ideal” cardiovascular health (never smoking/quit > 12 months prior to interview, BMI 18.5- < 25 kg/m2, meeting physical activity guidelines, and no prior diagnosis of dyslipidemia, hypertension, or diabetes/prediabetes), marital/co-habiting status (married/living with partner or cohabitating, divorced/widowed/separated, single/no live-in partner), employment status (unemployed, employed), and self-rated health status (excellent/very good, good, fair/poor). All model additionally adjusted for sex/gender (woman, man). Overall models adjusted for race/ethnicity (NH-White, NH-Black, Hispanic/Latinx, and Asian). Note. All estimates are weighted for the survey’s complex sampling design. Interaction results between nSC*race/ethnicity were significant (p-value < 0.05) and interaction results between nSC*sex/gender were not statistically significant
Fig. 4
Fig. 4
Prevalence Ratios of SPD by nSC: Racial Minoritized Participants vs. NH-Whites with High nSC (N = 168,573). PR = Prevalence Ratio; CI = Confidence Interval; Adjusted for age (18–30, 31–49, ≥ 50 years), educational attainment (< high school, high school graduate, some college, ≥ college), annual household income (< $35,000, $35,000-$74,999, $75,000 +), occupational class (professional/management, support services, laborers), region of residence (Northeast, Midwest, South, West), alcohol consumption (never, former, current), “ideal” cardiovascular health (never smoking/quit > 12 months prior to interview, BMI 18.5- < 25 kg/m2, meeting physical activity guidelines, and no prior diagnosis of dyslipidemia, hypertension, or diabetes/prediabetes), marital/co-habiting status (married/living with partner or cohabitating, divorced/widowed/separated, single/no live-in partner), employment status (unemployed, employed), and self-rated health status (excellent/very good, good, fair/poor). All model additionally adjusted for sex/gender (woman, man). Note. All estimates are weighted for the survey’s complex sampling design
Fig. 5
Fig. 5
Prevalence Ratios of SPD by nSC, Overall, Stratified by Race/Ethnicity, Sex/Gender, Self-Rated Health Status (N = 168,573). PR = Prevalence Ratio; CI = Confidence Interval;Adjusted for age (18–30, 31–49, ≥ 50 years), educational attainment (< high school, high school graduate, some college, ≥ college), annual household income (< $35,000, $35,000-$74,999, $75,000 +), occupational class (professional/management, support services, laborers), region of residence (Northeast, Midwest, South, West), alcohol consumption (never, former, current), “ideal” cardiovascular health (never smoking/quit > 12 months prior to interview, BMI 18.5- < 25 kg/m2, meeting physical activity guidelines, and no prior diagnosis of dyslipidemia, hypertension, or diabetes/prediabetes), marital/co-habiting status (married/living with partner or cohabitating, divorced/widowed/separated, single/no live-in partner), and employment status (unemployed, employed).All model additionally adjusted for sex/gender (woman, man) Overall models adjusted for race/ethnicity. Note. All estimates are weighted for the survey’s complex sampling design. Interaction results between nSC*self-rated health status were significant (p-value < 0.05). Blanks indicate data that was not estimable
Fig. 6
Fig. 6
Prevalence Ratios of SPD by nSC, Overall and Stratified by Race/Ethnicity, Sex/Gender, and Age (N = 168,573). PR = Prevalence Ratio; CI = Confidence Interval; Adjusted for educational attainment (< high school, high school graduate, some college, ≥ college), annual household income (< $35,000, $35,000-$74,999, $75,000 +), occupational class (professional/management, support services, laborers), region of residence (Northeast, Midwest, South, West), alcohol consumption (never, former, current), “ideal” cardiovascular health (never smoking/quit > 12 months prior to interview, BMI 18.5- < 25 kg/m2, meeting physical activity guidelines, and no prior diagnosis of dyslipidemia, hypertension, or diabetes/prediabetes), marital/co-habiting status (married/living with partner or cohabitating, divorced/widowed/separated, single/no live-in partner), employment status (unemployed, employed), and self-rated health status (excellent/very good, good, fair/poor). All model additionally adjusted for sex/gender (woman, man). Overall models adjusted for race/ethnicity. Note. All estimates are weighted for the survey’s complex sampling design. Interaction results between nSC*age were not statistically significant (p-value < 0.10). Blanks indicate data that was not estimable
Fig. 7
Fig. 7
Prevalence Ratios of SPD by nSC, Overall, Stratified by Race/Ethnicity, Sex/Gender, Annual Household Income (N = 156,362)a. a12211 participants excluded for missing income data. PR = Prevalence Ratio; CI = Confidence Interval; Adjusted for educational attainment (< high school, high school graduate, some college, ≥ college), age (18–30, 31–49, ≥ 50 years), occupational class (professional/management, support services, laborers), region of residence (Northeast, Midwest, South, West), alcohol consumption (never, former, current), “ideal” cardiovascular health (never smoking/quit > 12 months prior to interview, BMI 18.5- < 25 kg/m2, meeting physical activity guidelines, and no prior diagnosis of dyslipidemia, hypertension, or diabetes/prediabetes), marital/co-habiting status (married/living with partner or cohabitating, divorced/widowed/separated, single/no live-in partner), employment status (unemployed, employed), and self-rated health status (excellent/very good, good, fair/poor).All model additionally adjusted for sex/gender (woman, man). Overall models adjusted for race/ethnicity. Note. All estimates are weighted for the survey’s complex sampling design. Interaction results between nSC*annual household income were not statistically significant. Blanks indicate data that was not estimable

References

    1. Tsai CC, Chuang SY, Hsieh IC, Ho LH, Chu PH, Jeng C. The association between psychological distress and angina pectoris: A population-based study. PLoS ONE. 2019;14(11):e0224451. doi: 10.1371/journal.pone.0224451. - DOI - PMC - PubMed
    1. van Dijk I, Lucassen P, van Weel C, Speckens AEM. A cross-sectional examination of psychological distress, positive mental health and their predictors in medical students in their clinical clerkships. BMC Med Educ. 2017;17(1):219. doi: 10.1186/s12909-017-1035-8. - DOI - PMC - PubMed
    1. Arvidsdotter T, Marklund B, Kylen S, Taft C, Ekman I. Understanding persons with psychological distress in primary health care. Scand J Caring Sci. 2016;30(4):687–694. doi: 10.1111/scs.12289. - DOI - PubMed
    1. Weissman J, Pratt LA, Miller EA, Parker JD. Serious Psychological Distress Among Adults: United States, 2009–2013. 2015. - PubMed
    1. Forman-Hoffman , , , , VL, Muhuri PK, Novak SP, Pemberton MR, Ault KL, Mannix D. The CBHSQ Report. Rockville, MD: Rockville, MD; 2014. Psychological Distress and Mortality among Adults in the U.S. Household Population.

Publication types