. 2022 Jun 15;19(1):149.
doi: 10.1186/s12974-022-02514-x.

SARS-CoV-2 productively infects human brain microvascular endothelial cells

Affiliations

SARS-CoV-2 productively infects human brain microvascular endothelial cells

Rui-Cheng Yang et al. J Neuroinflammation. .

Abstract

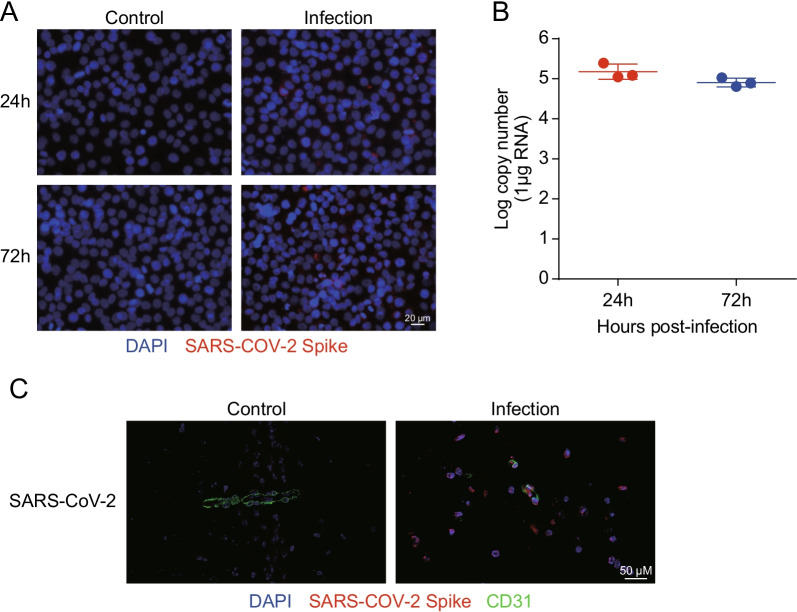
Background: The emergence of the novel, pathogenic severe acute respiratory syndrome coronavirus 2 (SARS-CoV-2) has caused a global health emergency. SARS-CoV-2 is highly contagious and has a high mortality rate in severe patients. However, there is very limited information on the effect of SARS-CoV-2 infection on the integrity of the blood-brain barrier (BBB).

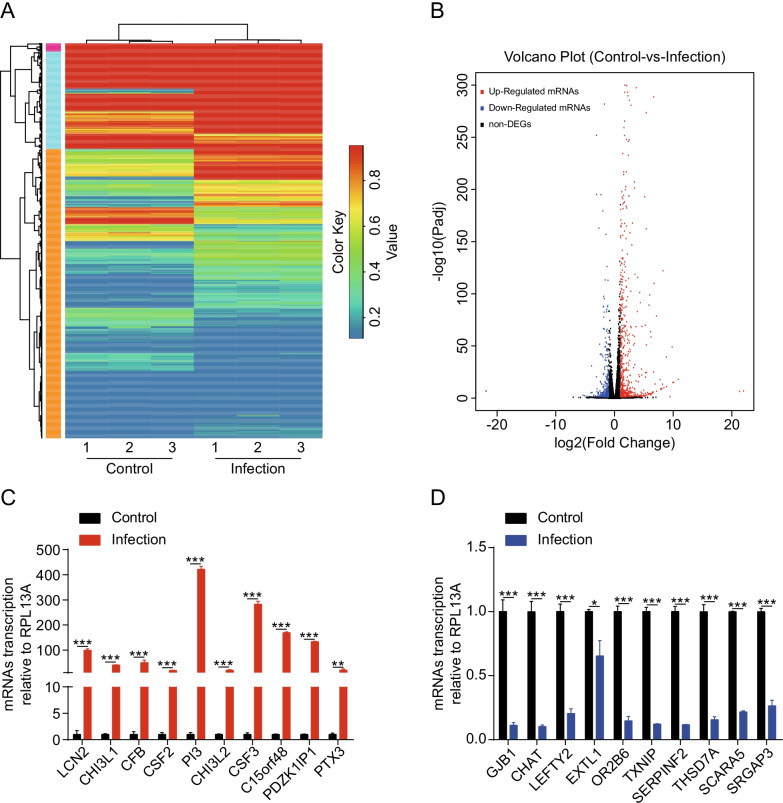
Methods: RNA-sequencing profiling was performed to analyze the transcriptomic changes in human brain microvascular endothelial cells (hBMECs) after SARS-CoV-2 infection. Bioinformatic tools were used for differential analysis. Immunofluorescence, real-time quantitative PCR, and Western blotting analysis were used to explore biological phenotypes.

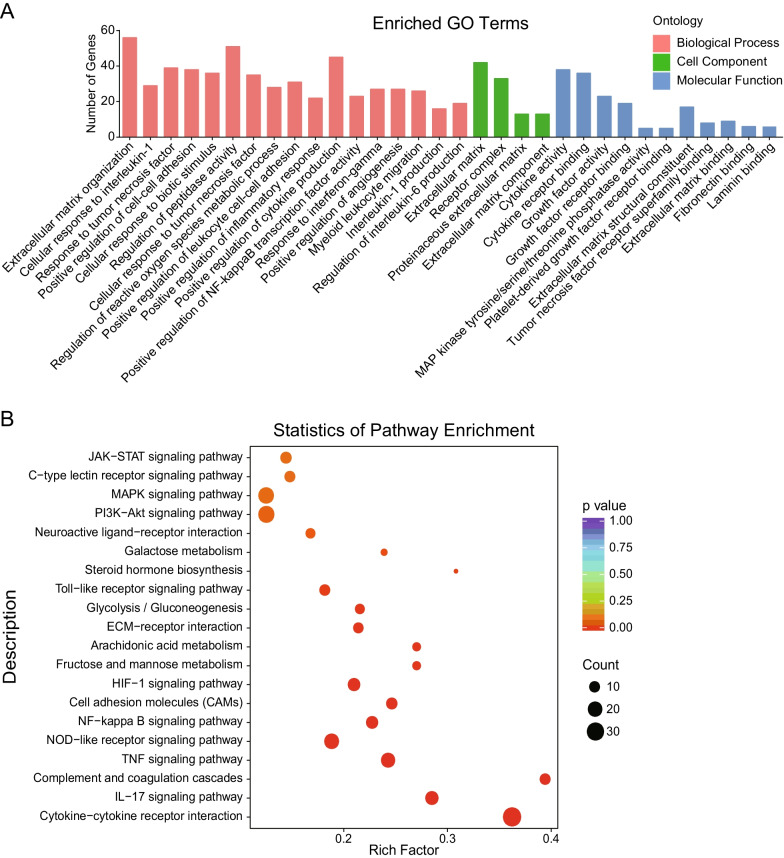
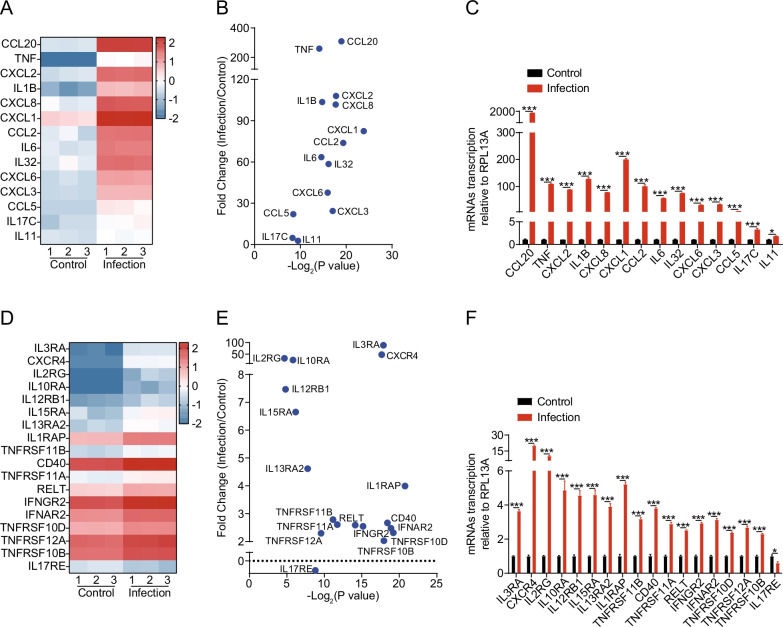
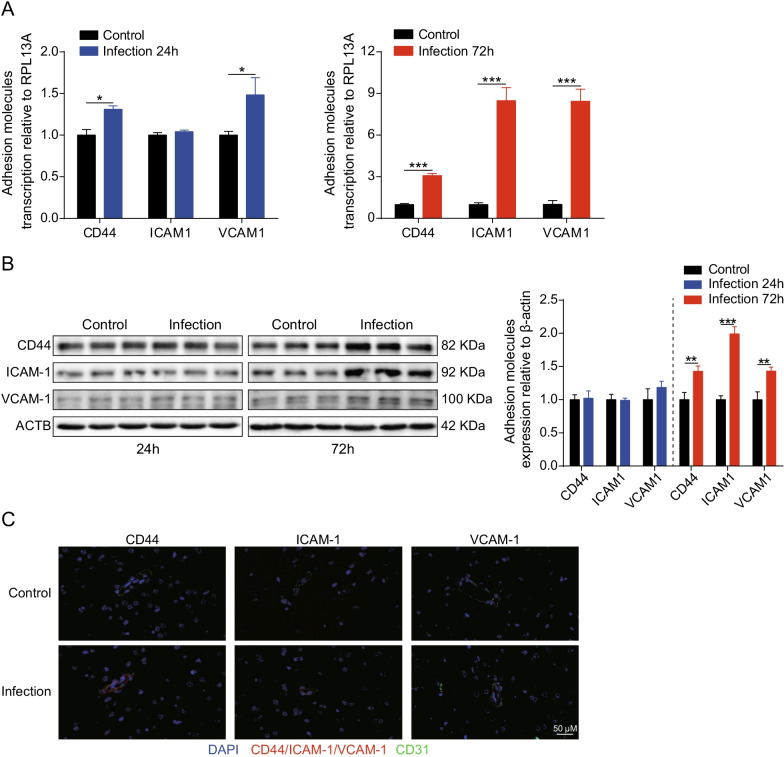
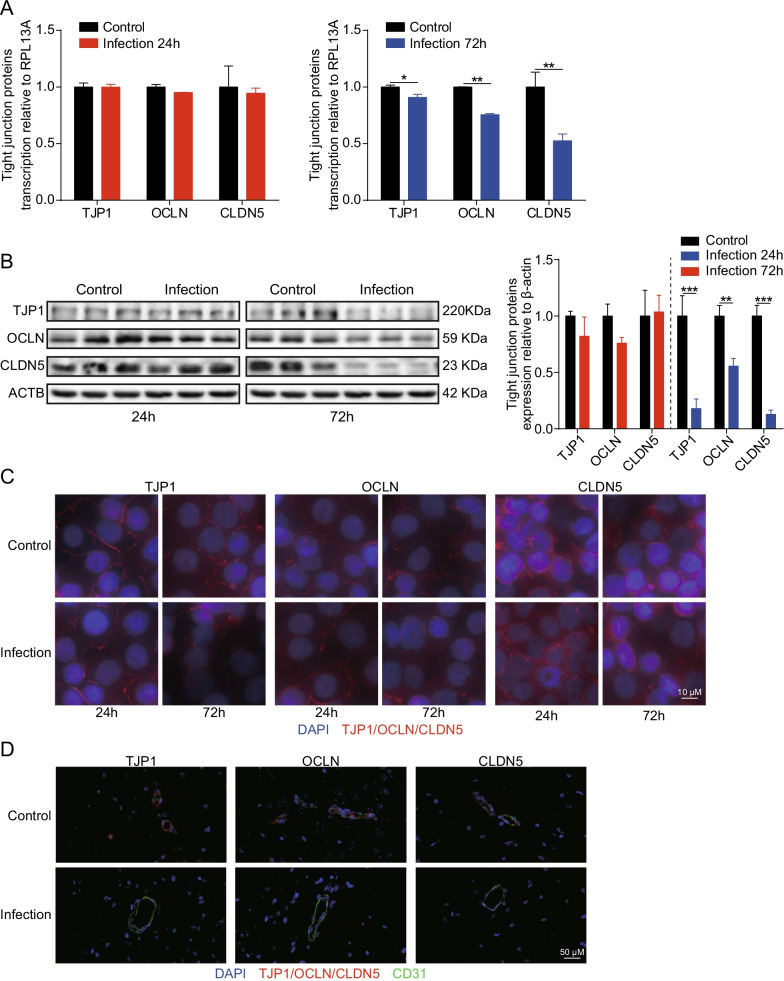
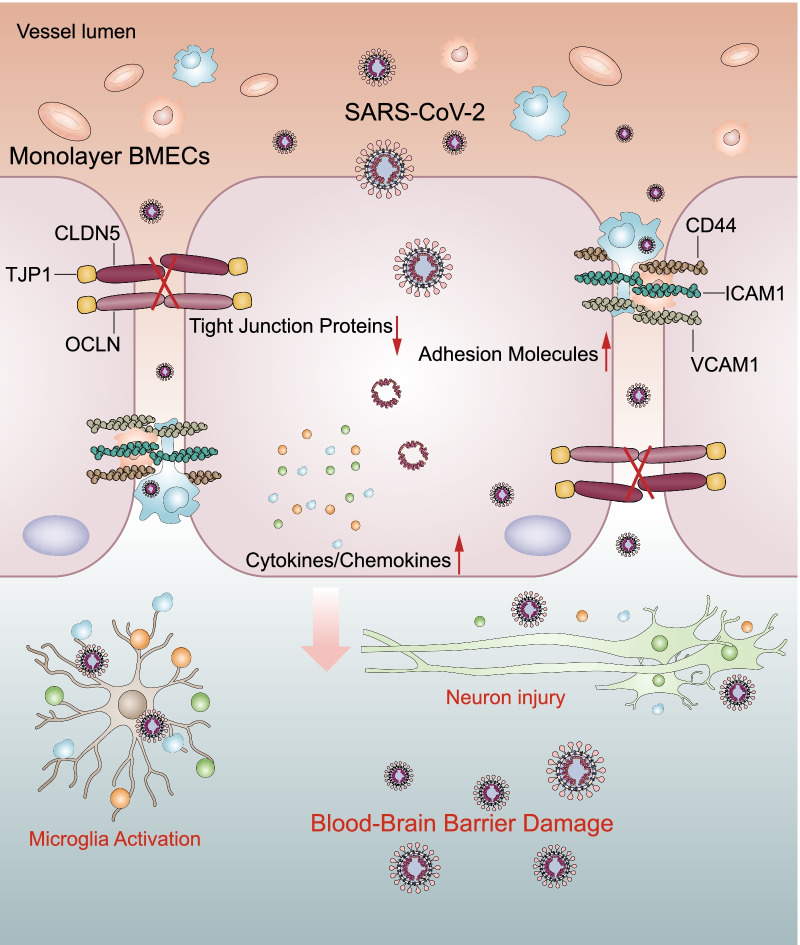
Results: A total of 927 differentially expressed genes were identified, 610 of which were significantly upregulated while the remaining 317 were downregulated. We verified the significant induction of cytokines, chemokines, and adhesion molecules in hBMECs by SARS-CoV-2, suggesting an activation of the vascular endothelium in brain. Moreover, we demonstrated that SARS-CoV-2 infection could increase the BBB permeability, by downregulating as well as remodeling the intercellular tight junction proteins.

Conclusions: Our findings demonstrated that SARS-CoV-2 infection can cause BBB dysfunction, providing novel insights into the understanding of SARS-CoV-2 neuropathogenesis. Moreover, this finding shall constitute a new approach for future prevention and treatment of SARS-CoV-2-induced CNS infection.

Keywords: Blood–brain barrier; Human brain microvascular endothelial cells; Inflammatory response; Permeability; SARS-CoV-2.


Conflict of interest statement

The authors declare that they have no competing interests.

Figures

Fig. 1
Fig. 1
Infection efficiency of SARS-CoV-2 analysis by RT-qPCR and immunofluorescence. A Infection efficiency of SARS-CoV-2 was detected using SARS-COV-2 Spike rabbit antibody, by immunofluorescence. Nuclei were stained in blue with DAPI, while SARS-CoV-2 was stained in red. Scale bar, 20 μm. B RT-qPCR for the RNA-dependent RNA polymerase (RdRP)-coding gene of SARS-CoV-2. Data are expressed as mean ± SD from three independent experiments. C Brain samples of both mice infected with SARS-CoV-2 for 5 d and those without were analyzed to determine the SARS-CoV-2 location by immunofluorescence. Nuclei were stained in blue with DAPI, while SARS-CoV-2 was stained in red. CD31 was specifically applied for labeling the micro-vessels in green. Scale bar indicates 50 μm
Fig. 2
Fig. 2
Expression profiling of the changes in messenger RNAs (mRNAs) in SARS-CoV-2-infected human brain microvascular endothelial cells (hBMECs). A Heat map showing unsupervised clustering of significantly expressed mRNAs from hBMECs in the SARS-CoV-2 infection groups compared with the control groups. The expression profiles are displayed with three samples in each group. Red represents high, while blue represents low expression, relative to that of the control. B Volcano plot of the upregulated and downregulated mRNAs from hBMECs in the SARS-CoV-2 infection group compared with the control group. Increase by ≥ twofold or decrease to ≤ 0.5-fold, p < 0.05 was considered statistically significant. C, D The relative expression levels of 20 mRNAs, including 10 downregulated and 10 upregulated ones, were examined by RT-qPCR in hBMECs infected with SARS-CoV-2 for 72 h and those without. The data from RNA-sequencing (RNA-seq) were highly consistent with the RT-qPCR results. RPL13A was used as the internal reference. Data were presented as the mean ± SD from three independent experiments. *p < 0.05, **p < 0.01, ***p < 0.001
Fig. 3
Fig. 3
Summary of the Gene Ontology (GO) and Kyoto Encyclopedia of Genes and Genomes (KEGG) pathway analyses for differentially expressed mRNAs. A Go of the differentially expressed mRNAs. The x-axis represents the enrichment pathway name. The y-axis is the targeted gene numbers corresponding to the GO terms. B KEGG analysis of the 20 most enriched pathways. The coloring of the p values indicates the significance of the rich factor. Circles indicate the target genes that are involved, with sizes proportional to the number of genes. The x-axis represents the rich factor. The y-axis represents the enrichment pathway name
Fig. 4
Fig. 4
SARS-CoV-2 infection of hBMECs induced a severe inflammatory response. A Heat maps depicting virally regulated cytokines and chemokines upon SARS-CoV-2 infection in hBMECs. Colored bar represents expressive abundance of log2 transformed values. B Significance analysis and difference multiples of cytokines and chemokines in hBMECs upon SARS-CoV-2 infection. C RT-qPCR analysis of cytokines and chemokines transcription in hBMECs upon SARS-CoV-2 infection. RPL13A was used as the internal reference. Data were presented as the mean ± SD from three independent experiments. *p < 0.05, ***p < 0.001. D Heat maps depicting virally regulated cytokine receptors upon SARS-CoV-2 infection in hBMECs. Colored bar represents expressive abundance of log2-transformed values. E Significance analysis and difference multiples of cytokine receptors in hBMECs upon SARS-CoV-2 infection. F RT-qPCR analysis of cytokine receptors transcription in hBMECs upon SARS-CoV-2 infection. RPL13A was used as the internal reference. Data were presented as the mean ± SD from three independent experiments. *p < 0.05, ***p < 0.001
Fig. 5
Fig. 5
SARS-CoV-2 infection increases expression of adhesion molecules in vitro and in vivo. A RT-qPCR analysis of CD44, ICAM1, and VCAM1 transcription in hBMECs 24 and 72 h post-SARS-CoV-2 infection. RPL13A was used as the internal reference. Data were presented as the mean ± SD from three independent experiments. *p < 0.05, ***p < 0.001. B Western blot analysis of CD44, ICAM1, and VCAM1 in hBMECs in response to SARS-CoV-2 after 24 and 72 h. β-Actin was used as the loading control, and differences were analyzed by densitometry. **p < 0.01, ***p < 0.001. C Brain samples of both mice infected with SARS-CoV-2 for 5 d and those without were analyzed for the expression of adhesion molecules by immunofluorescence. The CD44, ICAM1, and VCAM1 were selected as the markers reflecting the expression of adhesion molecules in red. CD31 was specifically applied for labeling the micro-vessels in green. The cell nucleus was stained in blue with DAPI. Scale bar indicates 50 μm
Fig. 6
Fig. 6
SARS-CoV-2 damaged the integrity of BBB by downregulating and disorganizing TJ proteins. A RT-qPCR analysis of TJP1, OCLN, and CLDN5 transcription in hBMECs 24 and 72 h post-infection with SARS-CoV-2. RPL13A was used as the internal reference. Data were presented as the mean ± SD from three independent experiments. *p < 0.05, **p < 0.01. B Western blot analysis of TJP1, OCLN, and CLDN5 in hBMECs in response to SARS-CoV-2 at 24 and 72 h post-infection. β-Actin was used as the loading control, and differences were analyzed by densitometry. **p < 0.01, ***p < 0.001. C Immunofluorescence analyses of TJP1, OCLN, and CLDN5 expression and distribution in hBMECs 24 and 72 h after infection with SARS-CoV-2. Nuclei were stained in blue with DAPI, while TJP1, OCLN, and CLDN5 were stained in red. Scale bar, 10 μm. D Brain samples of both mice infected with SARS-CoV-2 for 5 d and those without were analyzed for the integrity of vascular endothelium by immunofluorescence. TJ proteins, TJP1, OCLN, and CLDN5 were selected as the markers reflecting the integrity of the vascular endothelium in red. CD31 was specifically applied for labeling the micro-vessels in green. The cell nucleus was stained in blue with DAPI. Scale bar indicates 50 μm
Fig. 7
Fig. 7
Schematic representation of SARS-CoV-2-induced BBB damage and CNS dysfunctions. SARS-CoV-2 infection induced production of multiple cytokines, chemokines, and adhesion molecules in hBMECs. Meanwhile, SARS-CoV-2 infection could increase the BBB permeability, by downregulating as well as remodeling the intercellular TJ proteins

Similar articles

Cited by

References

    1. Sun SH, Chen Q, Gu HJ, Yang G, Wang YX, Huang XY, Liu SS, Zhang NN, Li XF, Xiong R, et al. A mouse model of SARS-CoV-2 infection and pathogenesis. Cell Host Microbe. 2020;28:124–133. doi: 10.1016/j.chom.2020.05.020. - DOI - PMC - PubMed
    1. Asadi-Pooya AA, Simani L. Central nervous system manifestations of COVID-19: a systematic review. J Neurol Sci. 2020;413:116832. doi: 10.1016/j.jns.2020.116832. - DOI - PMC - PubMed
    1. Zhou F, Yu T, Du RH, Fan GH, Liu Y, Liu ZB, Xiang J, Wang YM, Song B, Gu XY, et al. Clinical course and risk factors for mortality of adult inpatients with COVID-19 in Wuhan, China: a retrospective cohort study. Lancet. 2020;395:1054–1062. doi: 10.1016/S0140-6736(20)30566-3. - DOI - PMC - PubMed
    1. Baig AM. Neurological manifestations in COVID-19 caused by SARS-CoV-2. CNS Neurosci Ther. 2020;26:499–501. doi: 10.1111/cns.13372. - DOI - PMC - PubMed
    1. Bohmwald K, Galvez NMS, Rios M, Kalergis AM. Neurologic alterations due to respiratory virus infections. Front Cell Neurosci. 2018;12:386. doi: 10.3389/fncel.2018.00386. - DOI - PMC - PubMed