. 2022 Jun 15;10(1):87.
doi: 10.1186/s40478-022-01391-y.

Visual imaging as a predictor of neurodegeneration in experimental autoimmune demyelination and multiple sclerosis

Affiliations

Visual imaging as a predictor of neurodegeneration in experimental autoimmune demyelination and multiple sclerosis

Gabrielle M Mey et al. Acta Neuropathol Commun. .

Erratum in

Abstract

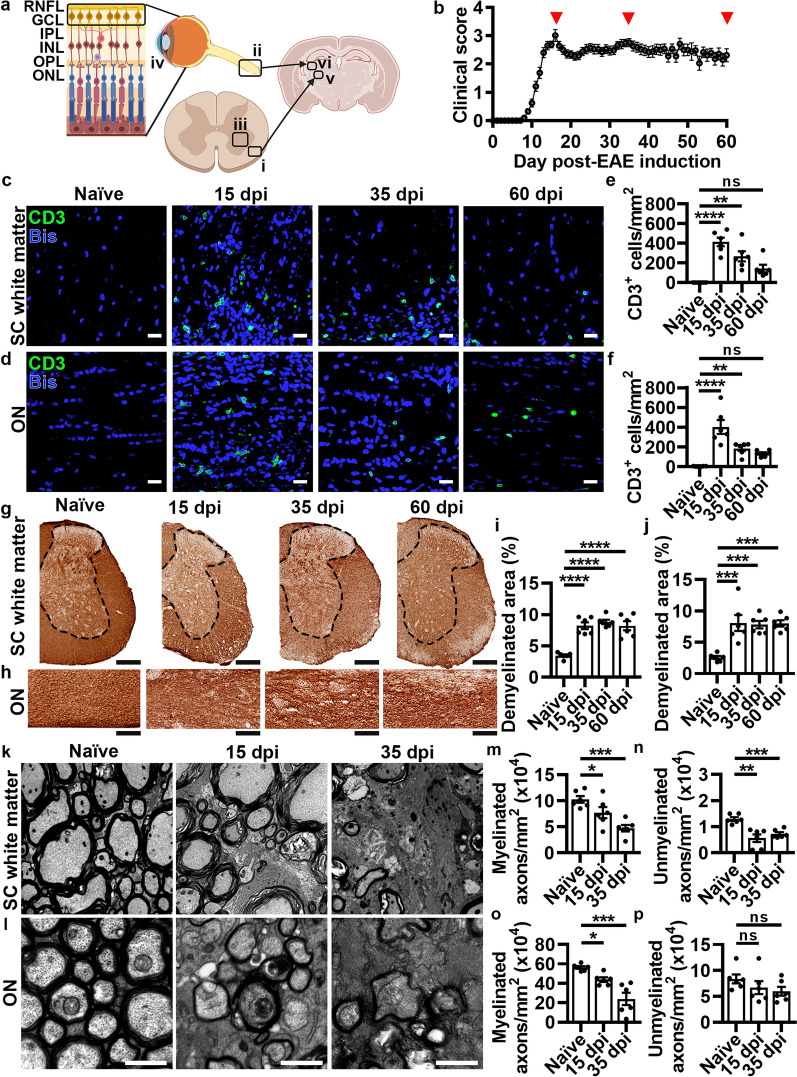
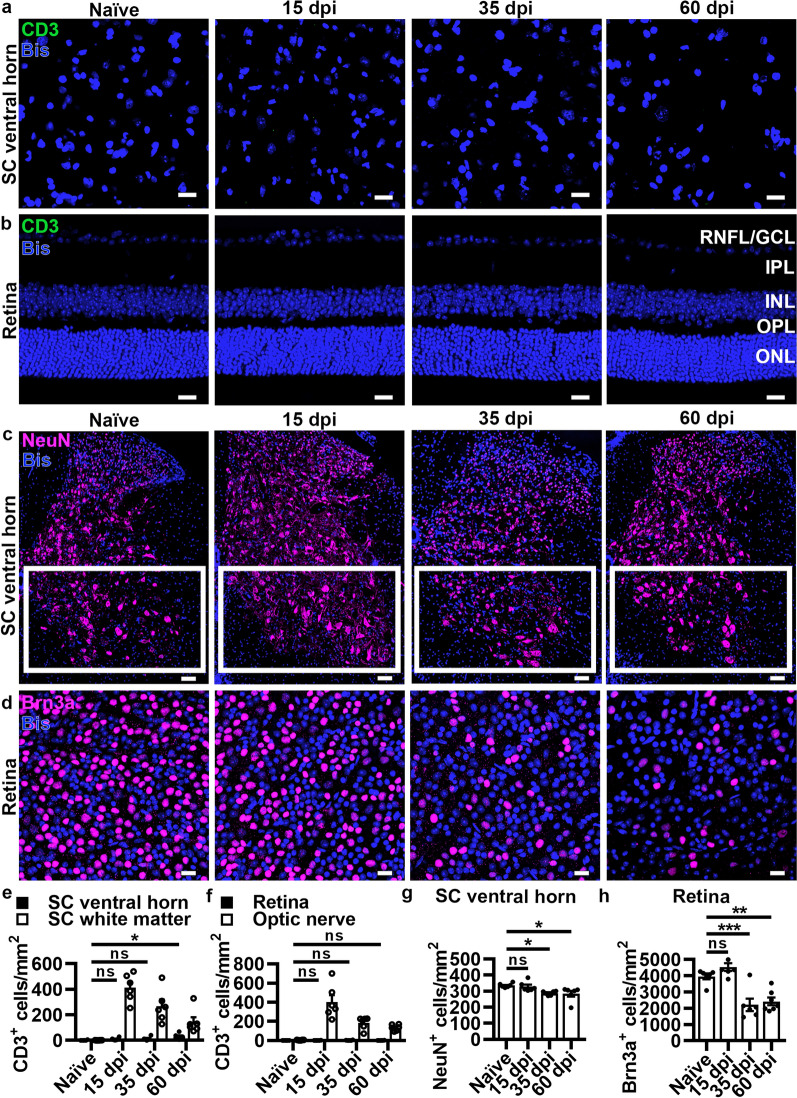
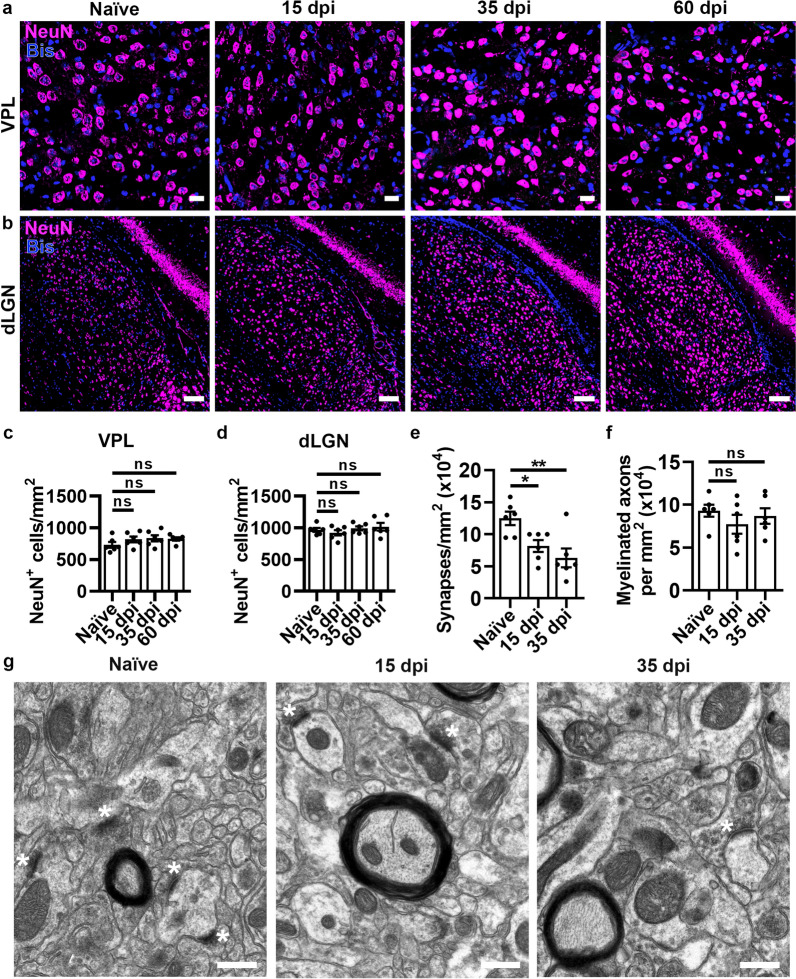
Thalamic volume is associated with clinical disability in multiple sclerosis (MS) and is vulnerable to secondary neurodegeneration due to its extensive connectivity throughout the central nervous system (CNS). Using a model of autoimmune demyelination that exhibits CNS-infiltrating immune cells in both spinal cord white matter and optic nerve, we sought to evaluate neurodegenerative changes due to lesions affecting the spino- and retino-thalamic pathways. We found comparable axonal loss in spinal cord white matter and optic nerve during the acute phase of disease consistent with synaptic loss, but not neuronal cell body loss in the thalamic nuclei that receive input from these discrete pathways. Loss of spinal cord neurons or retinal ganglion cells retrograde to their respective axons was not observed until the chronic phase of disease, where optical coherence tomography (OCT) documented reduced inner retinal thickness. In patients with relapsing-remitting MS without a history of optic neuritis, OCT measures of inner retinal volume correlated with retino-thalamic (lateral geniculate nucleus) and spino-thalamic (ventral posterior nucleus) volume as well as neuroperformance measures. These data suggest retinal imaging may serve as an important noninvasive predictor of neurodegeneration in MS.


Figures

Fig. 1
Fig. 1
T cell infiltration and myelin/axonal pathology follow similar time courses in spinal cord white matter and optic nerve. (a) Schematic of neural pathways in the spinal cord (SC) white matter (ai), optic nerve (ON) (aii), SC gray matter (aiii), retina (aiv), and ventral posterolateral (VPL) (av), and dorsal lateral geniculate (dLGN) (avi) nuclei of the thalamus. (b) EAE clinical scores. Analyses were performed at 15 (peak disease), 35 (chronic disease), and 60 dpi (sustained chronic disease), indicated by red arrowheads. P values listed consecutively are naïve vs 15, 35, or 60 dpi, respectively. (c-d) Representative images of CD3+ T cells in the SC white matter and ON. Scale bars = 20 µm. (e–f) Quantification of CD3+ T cells (e, SC: ****P < 0.0001, **P = 0.0017, P = 0.0745; f, ON: ****P < 0.0001, **P = 0.0092, P = 0.0502). (g-h) Representative images of 3,3'-diaminobenzidine (DAB) staining for myelin basic protein (MBP) in the SC white matter (gray matter of SC within black dotted line, white matter for analysis outside dotted line) and ON. Scale bars = 100 µm. (i-j) Quantification of demyelinated area (i, SC: ****P < 0.0001, ****P < 0.0001, ****P < 0.0001; j, ON: ***P = 0.0003, ***P = 0.0003, ***P = 0.0003). (k-l) Representative electron micrographs (EM) in the SC white matter and ON. Scale bars = 5 µm (SC) and 1 µm (ON). (m-p) Quantification of myelinated (m, SC: *P = 0.0425, ***P = 0.0006; o, ON: *P = 0.0433, ***P = 0.0001) and unmyelinated (n, SC: ***P = 0.0004, **P = 0.0023; p, ON: P = 0.4455, P = 0.3026) axons (see Additional file 1: Figure S1c-d for total axon counts). Statistical differences were determined by one-way analysis of variance (ANOVA) with Holm-Šidák post-hoc test. All data are expressed as means ± SEM, n = 6 mice per group, 12–16 fields from 3–4 sections (CD3, MBP) or 5–6 fields (EM) per mouse. Bis = bisbenzimide
Fig. 2
Fig. 2
Neuronal cell loss occurs in the spinal cord ventral horn and retina during chronic EAE. (a-b) Representative images of CD3+ T cells in the SC ventral horn and retina with retinal layers labeled. Scale bars = 20 µm. (c-d) Representative images of NeuN+ cells in the SC ventral horn and Brn3a+ RGCs in the retina. Scale bars = 100 µm (SC) and 20 µm (retina). P values listed consecutively are naïve vs 15, 35, or 60 dpi, respectively. (e–f) Quantification of CD3+ cells in SC ventral horn relative to SC white matter (e, SC ventral horn compared to naïve: P = 0.5095, P = 0.4159, *P = 0.0173; SC ventral horn compared to SC white matter naïve: P = 0.9997, 15 dpi: P < 0.0001, 35 dpi: P < 0.0001, 60 dpi: P = 0.0666) and CD3+ T cells in the retina relative to ON (f, retina compared to naïve: P = 0.8109, P = 0.4692, P = 0.8611; retina compared to optic nerve naïve: P > 0.9999, 15 dpi: P < 0.0001, 35 dpi: P = 0.0004, 60 dpi: P = 0.0171). (g-h) Quantification of NeuN+ cells in SC ventral horn (region outlined in white boxes, P = 0.8769, *P = 0.0405, *P = 0.0286) and Brn3a+ cells in the retina (P = 0.2820, ***P = 0.0007, **P = 0.0014). Statistical differences were determined by one or two-way ANOVA with Holm-Šidák post-hoc test. All data are expressed as means ± SEM including n = 6 mice per group, 4–6 fields from 2–3 sections (SC), 12–16 fields from 3–4 sections (retina CD3) and 12 fields from one whole retina (Brn3a) per mouse. Bis = bisbenzimide
Fig. 3
Fig. 3
There is no loss of neuronal cell bodies in the VPL and dLGN, but synaptic loss in the dLGN during EAE. (a-b) Representative images of NeuN+ cells in the VPL and dLGN. Scale bars = 20 µm (VPL) and 100 µm (dLGN). P values listed consecutively are naïve vs 15, 35, or 60 dpi, respectively. (c-d) Quantification of NeuN+ cells (c, VPL: P = 0.5266, P = 0.4775, P = 0.5244; d, dLGN: P = 0.8869, P = 0.8869, P = 0.8869). (e–f) Quantification of synapses (e, *P = 0.0400, **P = 0.0063) and myelinated axons (f, P = 0.5634, P = 0.9541) in the dLGN. (g) Representative images of EM in the dLGN (synapses indicated by white asterisks). Scale bars = 1 µm. Statistical differences were determined by one-way ANOVA with Holm-Šidák post-test. All data are expressed as means ± SEM including n = 5–6 mice per group, 3–6 fields from 2–3 sections (NeuN), and 4 fields (EM) per mouse. Bis = bisbenzimide
Fig. 4
Fig. 4
Retinal nerve fiber and ganglion cell/inner plexiform layer thicknesses are decreased during chronic EAE, while VEPs are delayed during acute and chronic EAE. a Representative SLO images. Scale bars = 200 µm. P values listed consecutively are baseline vs 15, 35, or 60 dpi, respectively b Quantification of RNFL area (P = 0.1020, **P = 0.0012, ****P < 0.0001). c Representative OCT b scans. d–h Quantification of the thicknesses of the RNFL (P = 0.7494, ****P < 0.0001, ****P < 0.0001), GC/IPL (P = 0.1083, **P = 0.0017, **P = 0.0014), INL (P = 0.1795, P = 0.8098, P = 0.8662), OPL (P = 0.8955, P = 0.5683, P = 0.9095), and ONL (P = 0.7659, P = 0.7080, P = 0.8720). i–k Correlation analyses between EAE clinical score (area under curve for each group) and RNFL thickness (i, Spearman r = − 0.7922, ****P < 0.0001), EAE clinical score versus GC/IPL thickness (j, Spearman r = − 0.6676, ****P < 0.0001), and EAE clinical score versus Brn3a+ cells in the retina (k, Spearman r = − 0.6070, **P = 0.0013) across all time points. l–m VEP latency (implicit time) and amplitude. P values for VEP data are listed in Table S1. Statistical differences were determined using a one-way ANOVA with Holm-Šidák post-hoc test (at each flash luminance for VEP) or Spearman r test for correlation analyses. All data are expressed as means ± SEM including n = 6–10 mice each for baseline and 15, 35, and 60 dpi

References

    1. Trapp BD, Nave KA. Multiple sclerosis: an immune or neurodegenerative disorder? Annu Rev Neurosci. 2008;31:247–269. - PubMed
    1. Confavreux C, Vukusic S, Moreau T, Adeleine P. Relapses and progression of disability in multiple sclerosis. N Engl J Med. 2000;343:1430–1438. - PubMed
    1. Eshaghi A, et al. Deep gray matter volume loss drives disability worsening in multiple sclerosis. Ann Neurol. 2018;83:210–222. - PMC - PubMed
    1. Fisniku LK, et al. Gray matter atrophy is related to long-term disability in multiple sclerosis. Ann Neurol. 2008;64:247–254. - PubMed
    1. Filippi M, et al. Gray matter damage predicts the accumulation of disability 13 years later in MS. Neurology. 2013;81:1759–1767. - PubMed

MeSH terms