Peripheral blood CD4posCD25posFoxP3pos cells and inflammatory cytokines as biomarkers of response in rheumatoid arthritis patients treated with CTLA4-Ig
- PMID: 35706043
- PMCID: PMC9199213
- DOI: 10.1186/s13075-022-02827-5
Peripheral blood CD4posCD25posFoxP3pos cells and inflammatory cytokines as biomarkers of response in rheumatoid arthritis patients treated with CTLA4-Ig
Erratum in
-
Correction: Peripheral blood CD4posCD25posFoxP3pos cells and inflammatory cytokines as biomarkers of response in rheumatoid arthritis patients treated with CTLA4-Ig.Arthritis Res Ther. 2022 Jul 25;24(1):177. doi: 10.1186/s13075-022-02866-y. Arthritis Res Ther. 2022. PMID: 35879726 Free PMC article. No abstract available.
Abstract
Background: Prognostic biomarkers of treatment response to distinct biologic disease-modifying anti-rheumatic drugs (b-DMARDs) are still lacking within the management of rheumatoid arthritis (RA).
Methods: Thirty-four b-DMARDs naive RA patients, divided by disease duration into early (cohort 1) and long standing (cohort 2), received CTLA4-Ig. At study entry, and every 3 months for 1 year, each patient underwent peripheral blood (PB)-derived CD4pos cell subpopulation assessment by flow cytometry, STAT3 and STAT5 expression by RT-PCR and IL-6, IL-12p70, TGFβ, and IL-10 serum levels by ELISA. The DAS and CDAI remission was assessed at 6 and 12 months.
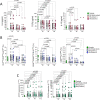
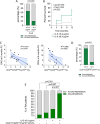
Results: DAS- and CDAI-defined remission within 12 months was achieved by 16 (47.1%) and 8 (23.5%) RA patients, respectively. Considering the whole RA cohort, CTLA4-Ig induced a significant decrease of IL-6 serum levels from baseline to 6 and 12 months, as well as of PB CD4posCD25posFoxP3pos cells at 6 and 12 months, and of CD4posIL17pos cells after 12 months. PB CD4pos cells of RA patients showed higher STAT3 and STAT5 expression than healthy controls, which remained unchanged within 12 months of treatment. At study entry, RA patients achieving DAS remission had significantly lower IL-6 serum levels than RA patients not achieving this outcome. In particular, having baseline IL-6 serum levels ≤ 8.4 pg/ml, significantly identified naïve to b-DMARDs RA patients more likely to achieve DAS-remission under CTLA4-Ig at 6 months (66.7%) compared to RA patients with baseline IL-6 serum levels > 8.4 pg/ml [15.4%, OR (95%Cis) 11.00 (1.75-55.82)]. Moreover, having CD4posCD25posFoxP3pos cells rate ≥ 6.0% significantly identifies naïve to b-DMARDs early RA patients more likely to achieve DAS remission at 6 months (83.3%) compared to RA patients with baseline CD4posCD25posFoxP3pos cells < 6.0% [16.7%, OR (95% Cis) 25.00 (1.00-336.81)].
Conclusions: Baseline IL-6 serum levels and peripheral blood-derived CD4pos subpopulations are putative novel prognostic biomarkers of CTLA4-Ig response in RA patients.
Keywords: Biomarkers; CTLA4-Ig; Rheumatoid arthritis.
© 2022. The Author(s).
Conflict of interest statement
The authors declare that they have no competing interests.
Figures


Similar articles
-
CTLA4-Ig modifies dendritic cells from mice with collagen-induced arthritis to increase the CD4+CD25+Foxp3+ regulatory T cell population.J Autoimmun. 2010 Mar;34(2):111-20. doi: 10.1016/j.jaut.2009.07.006. Epub 2009 Aug 8. J Autoimmun. 2010. PMID: 19665867
-
Conventional DMARDs therapy decreases disease activity and inflammation in newly diagnosed patients with rheumatoid arthritis by increasing FoxP3, Sema-3A, and Nrp-1 gene expression.Inflammopharmacology. 2024 Dec;32(6):3687-3695. doi: 10.1007/s10787-024-01565-1. Epub 2024 Sep 4. Inflammopharmacology. 2024. PMID: 39231852
-
Predictors of the effectiveness of first-line CTLA4-Ig in patients with RA: the FIRST registry.Rheumatology (Oxford). 2025 May 1;64(5):2403-2410. doi: 10.1093/rheumatology/keae598. Rheumatology (Oxford). 2025. PMID: 39499185
-
Inflammatory Pathways to Carcinogenesis: Deciphering the Rheumatoid Arthritis-Lung Cancer Connection.Cancers (Basel). 2025 Apr 15;17(8):1330. doi: 10.3390/cancers17081330. Cancers (Basel). 2025. PMID: 40282506 Free PMC article. Review.
-
Restoring the Balance between Pro-Inflammatory and Anti-Inflammatory Cytokines in the Treatment of Rheumatoid Arthritis: New Insights from Animal Models.Biomedicines. 2021 Dec 26;10(1):44. doi: 10.3390/biomedicines10010044. Biomedicines. 2021. PMID: 35052724 Free PMC article. Review.
Cited by
-
The forgotten key players in rheumatoid arthritis: IL-8 and IL-17 - Unmet needs and therapeutic perspectives.Front Med (Lausanne). 2023 Mar 22;10:956127. doi: 10.3389/fmed.2023.956127. eCollection 2023. Front Med (Lausanne). 2023. PMID: 37035302 Free PMC article. Review.
-
Correction: Peripheral blood CD4posCD25posFoxP3pos cells and inflammatory cytokines as biomarkers of response in rheumatoid arthritis patients treated with CTLA4-Ig.Arthritis Res Ther. 2022 Jul 25;24(1):177. doi: 10.1186/s13075-022-02866-y. Arthritis Res Ther. 2022. PMID: 35879726 Free PMC article. No abstract available.
-
Id2 exacerbates the development of rheumatoid arthritis by increasing IFN-γ production in CD4+ T cells.Clin Transl Med. 2025 Mar;15(3):e70242. doi: 10.1002/ctm2.70242. Clin Transl Med. 2025. PMID: 40051059 Free PMC article.
-
Rheumatoid Arthritis from Easy to Complex Disease: From the "2022 GISEA International Symposium".J Clin Med. 2023 Apr 9;12(8):2781. doi: 10.3390/jcm12082781. J Clin Med. 2023. PMID: 37109118 Free PMC article. Review.
-
Changes in Treg and Breg cells in a healthy pediatric population.Front Immunol. 2023 Nov 21;14:1283981. doi: 10.3389/fimmu.2023.1283981. eCollection 2023. Front Immunol. 2023. PMID: 38077340 Free PMC article.
References
-
- Kerschbaumer A, Sepriano A, Smolen JS, van der Heijde D, Dougados M, van Vollenhoven R, et al. Efficacy of pharmacological treatment in rheumatoid arthritis: a systematic literature research informing the 2019 update of the EULAR recommendations for management of rheumatoid arthritis. Ann Rheum Dis. 2020;79:744–759. doi: 10.1136/annrheumdis-2019-216656. - DOI - PMC - PubMed
-
- Humby F, Lewis M, Ramamoorthi N, Hackney JA, Barnes MR, Bombardieri M, et al. Synovial cellular and molecular signatures stratify clinical response to csDMARD therapy and predict radiographic progression in early rheumatoid arthritis patients. Ann Rheum Dis. 2019;78:761–772. doi: 10.1136/annrheumdis-2018-214539. - DOI - PMC - PubMed
-
- Alivernini S, Tolusso B, Gessi M, Gigante MR, Mannocci A, Petricca L, et al. Inclusion of synovial tissue-derived characteristics in a nomogram for the prediction of treatment response in treatment-naive rheumatoid arthritis patients. Arthritis Rheumatol. 2021;73:1601–1613. doi: 10.1002/art.41726. - DOI - PMC - PubMed
-
- Aldridge J, Pandya JM, Meurs L, Andersson K, Nordström I, Theander E, et al. Sex-based differences in association between circulating T cell subsets and disease activity in untreated early rheumatoid arthritis patients. Arthritis Res Ther. 2018;20:150. doi: 10.1186/s13075-018-1648-2. - DOI - PMC - PubMed
Publication types
MeSH terms
Substances
LinkOut - more resources
Full Text Sources
Medical
Research Materials
Miscellaneous

