

Serum metabolomics analysis of deficiency pattern and excess pattern in patients with rheumatoid arthritis
- PMID: 35706052
- PMCID: PMC9199155
- DOI: 10.1186/s13020-022-00632-5
Serum metabolomics analysis of deficiency pattern and excess pattern in patients with rheumatoid arthritis
Abstract
Background: Rheumatoid arthritis (RA) is a chronic and refractory autoimmune disease. Deficiency pattern (DP) and excess pattern (EP), as crucial types of Chinese medicine pattern diagnoses published by International Classification of Diseases 11th Revision (ICD-11), could provide new strategies for RA diagnosis. However, the biological basis of DP and EP of RA is not explicit.
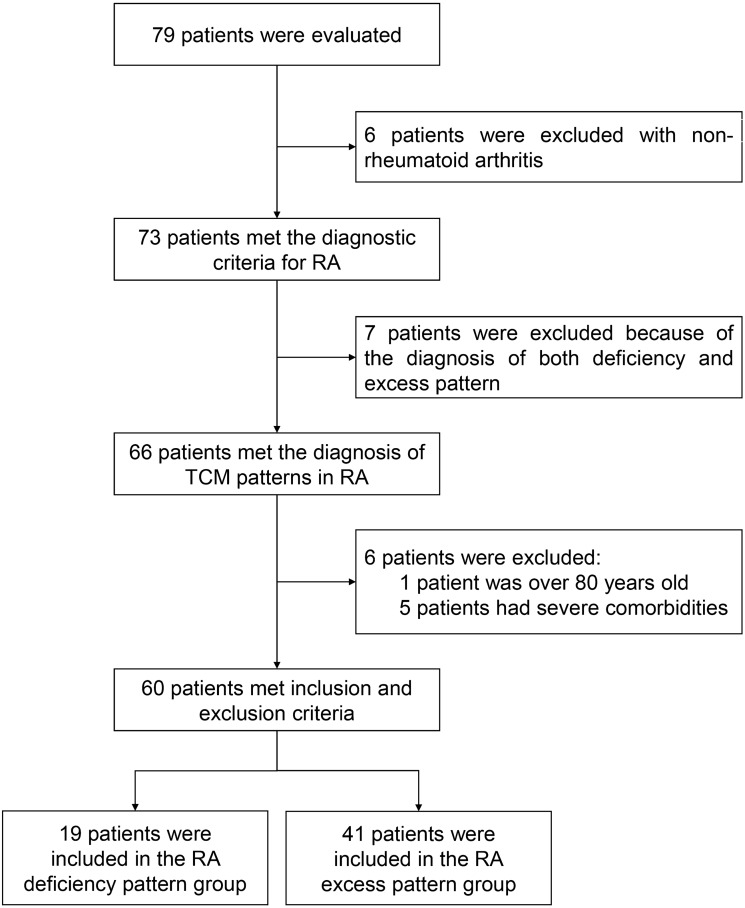
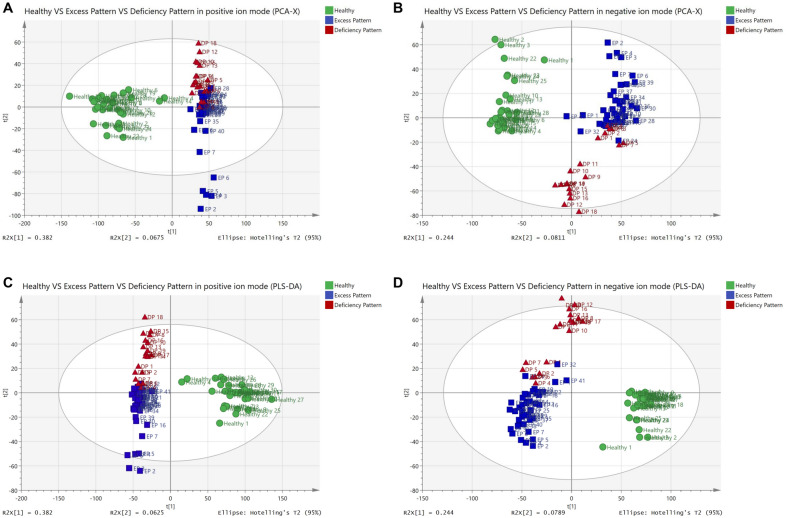
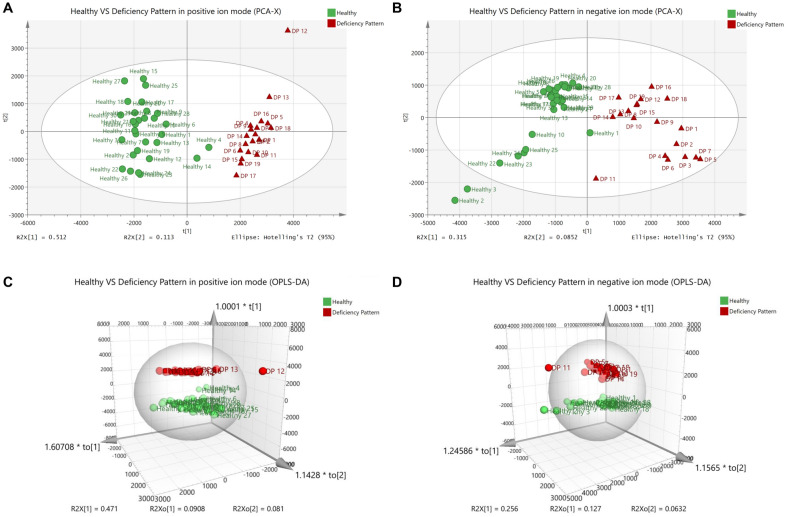
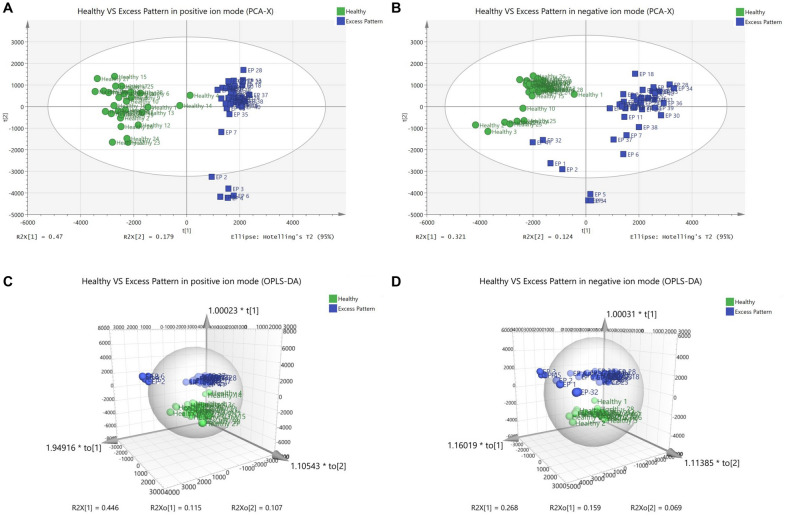
Methods: 19 female RA DP patients, 41 female RA EP patients and 30 female healthy participants were included in the study. The serums of participants were collected and analyzed by metabolomics based on ultra-performance liquid chromatography coupled with quadrupole time-of-flight mass spectrometry to profile metabolic characteristics of RA DP and EP. Furthermore, bioinformatics analysis results were obtained by using Ingenuity Pathway Analysis (IPA) and statistical analysis was performed by SAS version 9.4 for further identification of potential biomarkers.
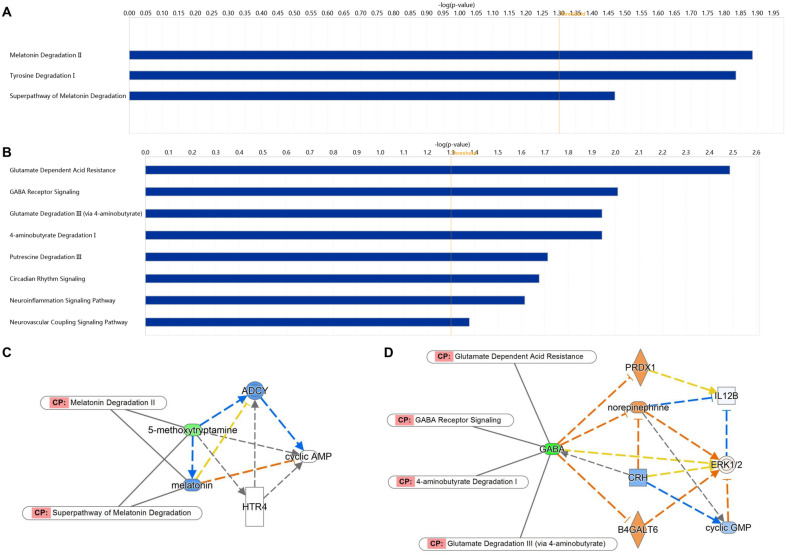
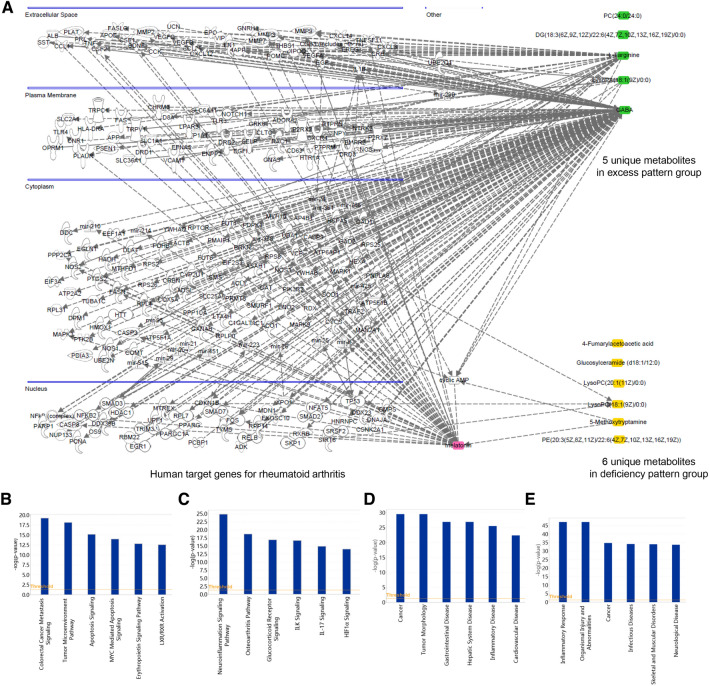
Results: Serum metabolic profiling revealed 25 and 24 differential metabolites in RA DP and EP respectively, and 19 metabolites were common to RA DP and EP. Compared with DP group, L-Homocysteic acid, LysoPE(P-16:0/0:0), N(omega)-Hydroxyarginine and LysoPC(16:0/0:0) decreased (P < 0.05), and Pyruvic acid, D-Ribose, Gamma-Glutamylserine, PE(22:0/24:1(15Z)), Inosinic acid increased (P < 0.05) in EP group. Menawhile, S-Nitrosoglutathione, 5-Thymidylic acid, SN38 glucuronide, PE(22:0/24:0), PC(24:0/24:1(15Z)) and Bisdiphosphoinositol tetrakisphosphate increased significantly in DP group compared to EP group (P < 0.05). For the unique metabolites, bioinformatics analysis results showed that 5-Methoxytryptamine involved in Melatonin Degradation II and Superpathway of Melatonin Degradation is the key metabolite to RA DP. Meanwhile, GABA is the key metabolite in EP group, which involved in Glutamate Dependent Acid Resistance, GABA Receptor Signaling, Glutamate Degradation III (via 4-aminobutyrate) and 4-aminobutyrate Degradation I. Bioinformatics analysis between unique metabolites of RA DP and EP groups with human target genes for RA showed that 5-methoxytryptamine and LysoPC(18:1(9Z)/0:0), the unique metabolites of RA DP, might participate in colorectal cancer metastasis signaling, tumor microenvironment pathway, apoptosis signaling, MYC mediated apoptosis signaling, erythropoietin signaling pathway and LXR/RXR activation. Simultaneously, GABA, LysoPA(18:1(9Z)/0:0) and L-Targinine, the unique metabolites of RA EP, might participate in neuroinflammation signaling pathway, osteoarthritis pathway, glucocorticoid receptor signaling, ILK signaling, IL-17 signaling and HIF1α signaling.
Conclusions: The study indicates that serum metabolomics preliminarily revealed the biological basis of RA DP and EP. 5-methoxytryptamine, LysoPC(18:1(9Z)/0:0) and GABA, LysoPA(18:1(9Z)/0:0), L-Targinine might be the predictors to distinguish the DP and EP of RA respectively. These interesting results provide thoughts for further study of traditional medicine patterns of ICD-11. It also contributes to provide strategy for personalized precision treatment of RA and further validation is needed.
Keywords: Deficiency pattern; Excess pattern; Rheumatoid arthritis; Serum metabolomics.
© 2022. The Author(s).
Conflict of interest statement
These authors declare that there are no conflicts of interest regarding this work.
Figures


References
-
- Fan D, Xia Y, Lu C, Ye Q, Xi X, Wang Q, Wang Z, Wang C, Xiao C. Regulatory role of the RNA N6-methyladenosine modification in immunoregulatory cells and immune-related bone homeostasis associated with rheumatoid arthritis. Front cell Dev Biol. 2020;8:627893. doi: 10.3389/fcell.2020.627893. - DOI - PMC - PubMed
-
- Maeda-Minami A, Yoshino T, Katayama K, Horiba Y, Hikiami H, Shimada Y, Namiki T, Tahara E, Minamizawa K, Muramatsu S, Yamaguchi R, Imoto S, Miyano S, Mima H, Mimura M, Nakamura T, Watanabe K. Discrimination of prediction models between cold-heat and deficiency-excess patterns. Complement Ther Med. 2020;49:102353. doi: 10.1016/j.ctim.2020.102353. - DOI - PubMed
Grants and funding
LinkOut - more resources
Full Text Sources
