. 2022 Jun 15;15(1):55.
doi: 10.1186/s13041-022-00940-9.

Genome-wide translation control analysis of developing human neurons

Affiliations

Genome-wide translation control analysis of developing human neurons

Érico Moreto Lins et al. Mol Brain. .

Abstract

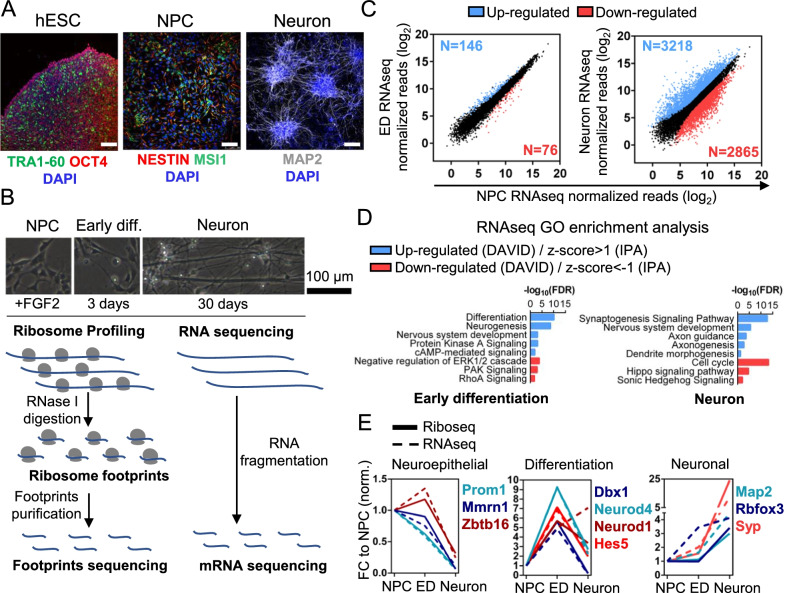
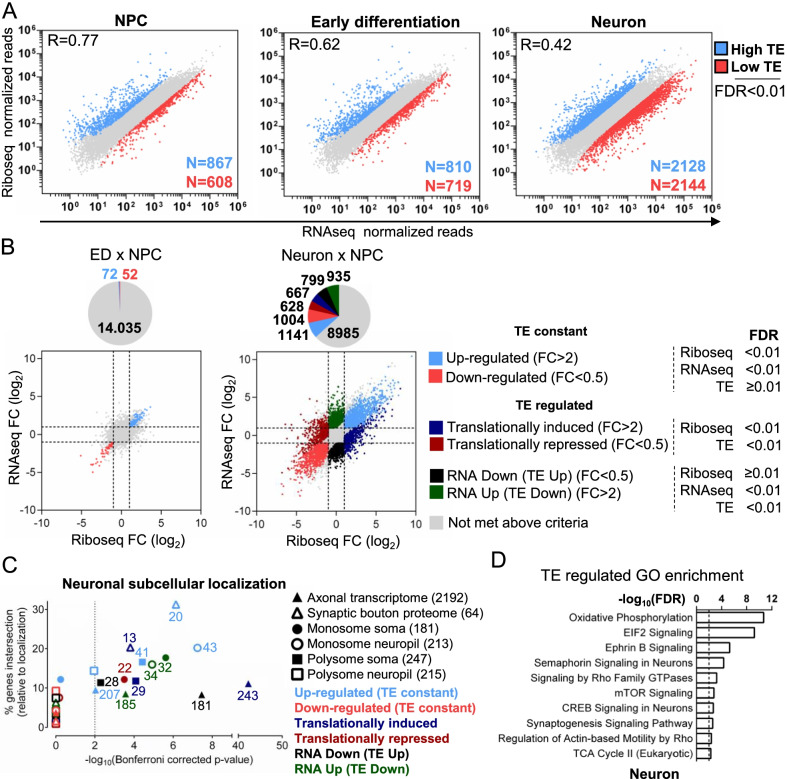
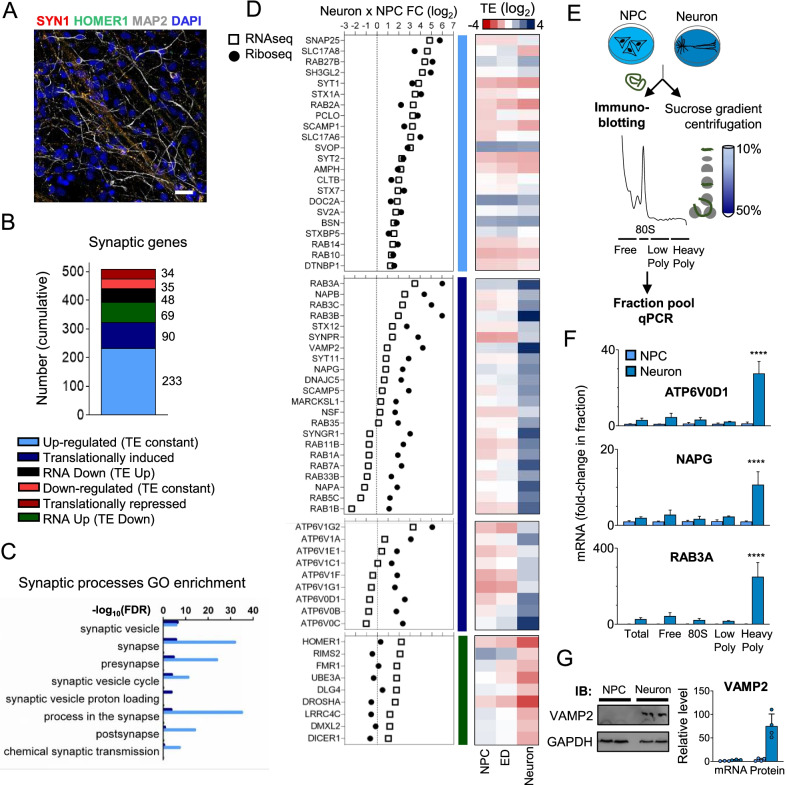
During neuronal differentiation, neuroprogenitor cells become polarized, change shape, extend axons, and form complex dendritic trees. While growing, axons are guided by molecular cues to their final destination, where they establish synaptic connections with other neuronal cells. Several layers of regulation are integrated to control neuronal development properly. Although control of mRNA translation plays an essential role in mammalian gene expression, how it contributes temporarily to the modulation of later stages of neuronal differentiation remains poorly understood. Here, we investigated how translation control affects pathways and processes essential for neuronal maturation, using H9-derived human neuro progenitor cells differentiated into neurons as a model. Through Ribosome Profiling (Riboseq) combined with RNA sequencing (RNAseq) analysis, we found that translation control regulates the expression of critical hub genes. Fundamental synaptic vesicle secretion genes belonging to SNARE complex, Rab family members, and vesicle acidification ATPases are strongly translationally regulated in developing neurons. Translational control also participates in neuronal metabolism modulation, particularly affecting genes involved in the TCA cycle and glutamate synthesis/catabolism. Importantly, we found translation regulation of several critical genes with fundamental roles regulating actin and microtubule cytoskeleton pathways, critical to neurite generation, spine formation, axon guidance, and circuit formation. Our results show that translational control dynamically integrates important signals in neurons, regulating several aspects of its development and biology.

Keywords: Neural stem cells; Neuron; Neuronal differentiation; Translational control.


Conflict of interest statement

The authors declare that they have no competing interests.

Figures

Fig. 1
Fig. 1
Human neuronal differentiation model and experimental design. A H9 human embryonic stem cell line was differentiated into neuroprogenitor cells, which were induced to differentiate into neurons by FGF2 removal for 30 days. Each developmental stage was tested for correspondent markers. hESC (green: TRA1-60; Red: OCT4), NPC (Red: NESTIN) and Neuron (white: MAP2). Blue: DAPI. Scale bars = 100 µm. B Experimental design. Samples from NPCs in different points of differentiation were collected for Ribosome Profiling and RNA sequencing analysis. C Transcriptomic analysis of differentiating NPCs. RNAseq libraries prepared in duplicates from ED and Neurons were compared with NPC libraries. Differentially expressed genes are indicated according to FC > 2, FDR < 0.01. Blue: upregulated; Red: downregulated. D DAVID and IPA Gene Ontology analysis of RNAseq differentially expressed transcripts in ED and Neurons (FDR < 0.01). E Differentiation markers analysis. Plot with Riboseq and RNAseq fold-change values (normalized to NPC) of neuroepithelial, neural differentiation, and canonical neuronal markers
Fig. 2
Fig. 2
Translational Control analysis of genes expressed during human neuronal differentiation. A Ribosome Profiling versus RNA sequencing expression plots at selected differentiation stages. Blue: High translation efficiency genes (TE > 3); Red: low translation efficiency genes (TE < 0.33), FDR < 0.01. B RNAseq versus Riboseq fold-change plots comparing ED and Neurons with NPC. Genes were classified according to their regulation with the parameters indicated criteria. Blue represents Up-regulated genes, with no change in translation efficiency; Red indicates Down-regulated genes, with no change in translation efficiency; Dark blue indicates genes with increased translation efficiency and significative increase of total riboseq counts between cells; Dark red indicates genes with decreased translation efficiency and significative decrease of total riboseq counts between cells; Black indicates genes with increased translation efficiency without a significative increase in total riboseq counts between cells; Green indicates genes with decreased translation efficiency without significative decrease of total riboseq counts between cells. Gray indicates genes without regulation. C) Subcellular localization analysis of translation-regulated transcripts. Genes from each regulatory category in B were compared with human axonal transcriptome [25], synaptic bouton proteome [26] and monosome/polysome enriched transcripts in soma/neuronal neuropil [79]. Data is presented as Fisher exact test p-values (X-axis) to the percentual intersected relative to total genes in the subcellular localization category list (Y-axis). D IPA GO enrichment analysis of TE regulated genes in Neurons (TE FC > 2, FDR < 0.01)
Fig. 3
Fig. 3
Translational Control of synaptic genes. A Immunofluorescence showing positive presynaptic and post-synaptic markers in 30 days Neurons (green: HOMER1; Red: SYN1; white: MAP2. Blue: DAPI. Scale bars = 100 µm. B Classification of the differential expressed synaptic genes between NPC and neuron accord with their mode of regulation. C SynGO enrichment analysis and total Unique terms quantification of the translation-regulated genes in Neurons in relationship to NPCs. Categories with significant enrichment (FDR < 0.01) in SynGO processes are shown. Dark blue bars: Translational induced category; Light blue bars: up-regulated (TE constant) category. D RNAseq and Riboseq fold-change plots of synaptic vesicles genes Up-regulated and translationally regulated in Neurons compared to NPC. Corresponding TE heatmap of v-ATPase complex subunits, selected RNA Up, TE Down genes, and selected translationally induced genes at each differentiation time-point are indicated. Data are presented as log2 of TE value at each time point. E Experimental design used to confirm translation regulation of selected genes. F ATP6V0D1, NAPG, and RAB3A mRNA are strongly associated with heavy polysomes in neurons. The graphic represents an average of 3 independent experiments. **** indicates p < 0.0001. G VAMP2 is more induced at the protein level than at mRNA level during the differentiation of NPCs into neurons. Comparative protein levels were determined by western blot meanwhile mRNA levels were determined by qPCR. The analysis was performed in 4 independent biological samples
Fig. 4
Fig. 4
Translational Control of neuronal metabolic genes involved in Glycolysis, TCA, Urea cycle, and glutamate metabolism. A TE Heatmap showing significantly regulated genes (TE FC > 2, FDR < 0.01) involved in glycolysis, TCA cycle, and glutamate metabolism in Neurons. B Glycolysis, TCA, Urea cycle, and glutamate/GABA metabolic map. Gray: No regulation in neurons; Blue: Up-regulated genes; Red: Down-regulated genes; Dark blue: Translationally induced genes; Dark Red: Translationally repressed genes; Black: RNA Down, TE Up genes; Green: RNA up, TE down genes. Circles: Riboseq FC Heatmap for each gene. C ARG2, GOT1, and OAT and SRM mRNA are more associated with heavy polysomes in neurons; meanwhile, SRM is more associated with heavy polysomes in NPCs. The graphic represents an average of 3 independent experiments. Asterisks indicates: *p < 0.05, **p < 0.01, ***p < 0.001, ****p < 0.0001
Fig. 5
Fig. 5
Translational Control of neuritogenesis, axon guidance, and cytoskeleton genes in Neurons. A IPA GO analysis of Actin cytoskeleton and neurite guidance processes enriched in translation-regulated genes. The dashed line marks FDR < 0.01. B RNAseq versus Riboseq FC plot of dendritic and axonal AMIGO GO processes genes regulated between neurons and NPCs. Different translation regulation categories are indicated in the figure. C TE heatmap of cytoskeleton regulators and structural genes. Data are presented as the TE fold-change value in Neurons compared to NPC. D CFL1, DPYSL2, and SS18L1 mRNA are strongly associated with heavy polysomes in neurons. The graphic represents an average of 3 independent experiments. Asterisks indicate **** p < 0.0001. E GPM6A and STMN3 are more induced at the protein level than at the mRNA level during the differentiation of NPCs into neurons. Comparative protein levels were determined by western blot, meanwhile mRNA levels were determined by qPCR. The analysis was performed in 4 independent biological samples

References

    1. Schwanhüusser B, Busse D, Li N, Dittmar G, Schuchhardt J, Wolf J, et al. Global quantification of mammalian gene expression control. Nature. 2011;473:337–342. - PubMed
    1. Ingolia NT. Genome-wide translational profiling by Ribosome footprinting. Methods Enzymol. 2010. - PubMed
    1. Holt CE, Martin KC, Schuman EM. Local translation in neurons: visualization and function. Nature Struct Mol Biol. 2019;26:557. - PubMed
    1. Sutton MA, Schuman EM. Dendritic protein synthesis, synaptic plasticity, and memory. Cell. 2006;127:49. - PubMed
    1. Zahr SK, Kaplan DR, Miller FD. Translating neural stem cells to neurons in the mammalian brain. Cell Death Differ. 2019;26:2495. - PMC - PubMed

Publication types