. 2022 Aug 3;10(8):996-1012.
doi: 10.1158/2326-6066.CIR-21-0870.

Microenvironmental Landscape of Human Melanoma Brain Metastases in Response to Immune Checkpoint Inhibition

Affiliations

Microenvironmental Landscape of Human Melanoma Brain Metastases in Response to Immune Checkpoint Inhibition

Christopher Alvarez-Breckenridge et al. Cancer Immunol Res. .

Abstract

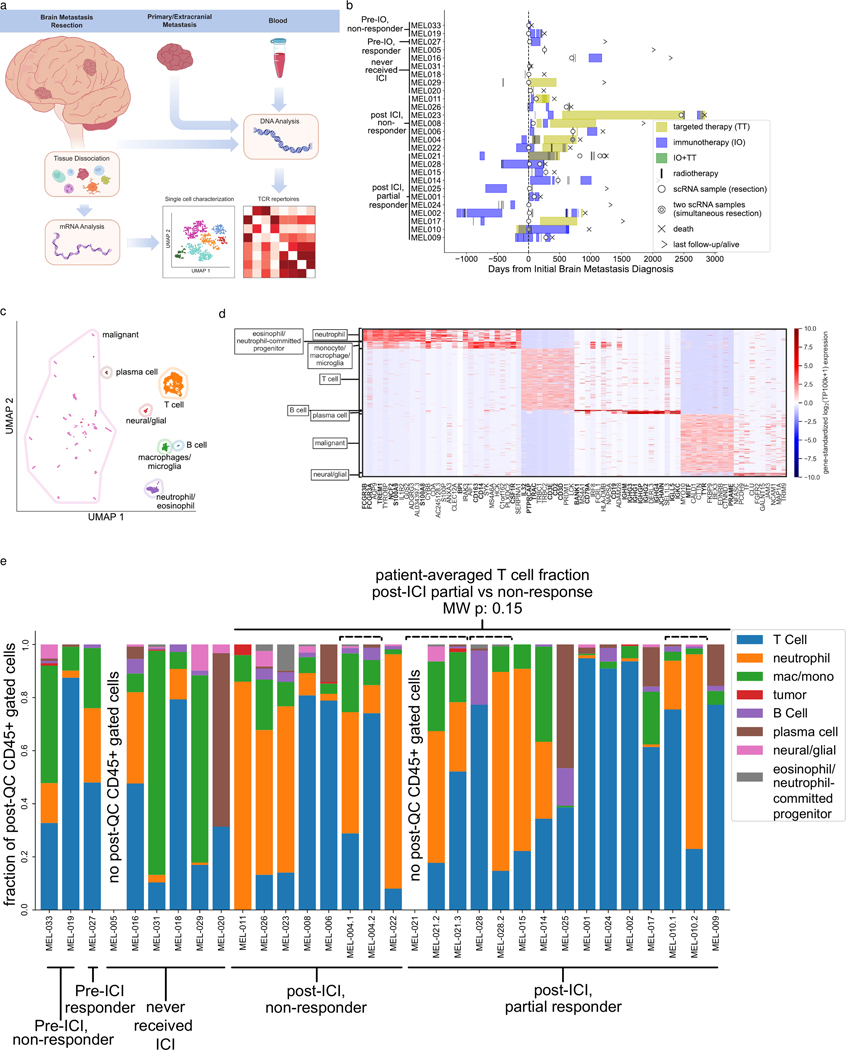
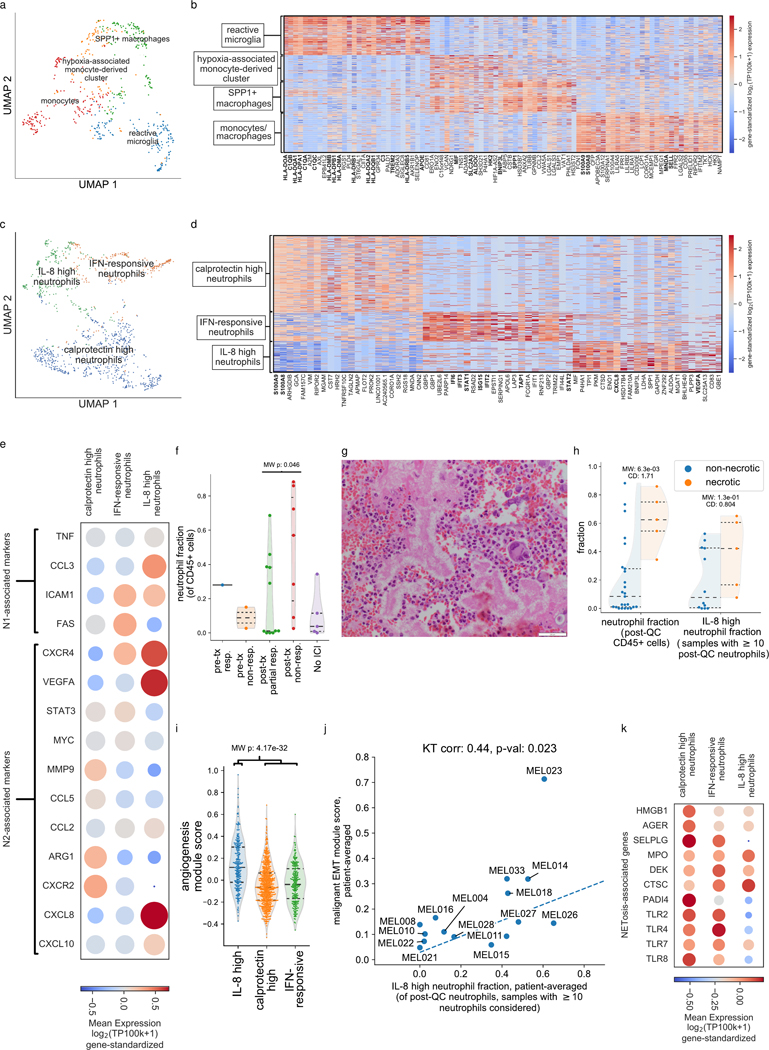
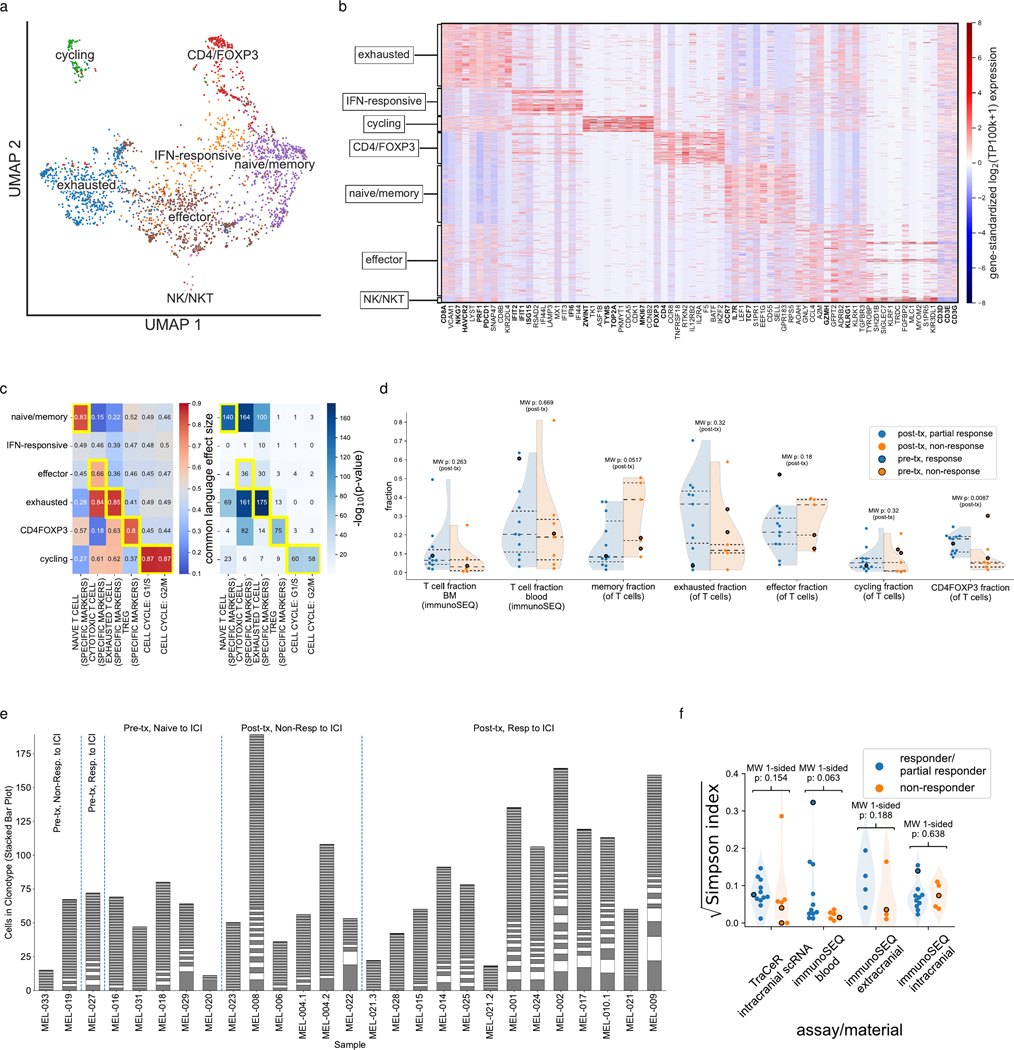
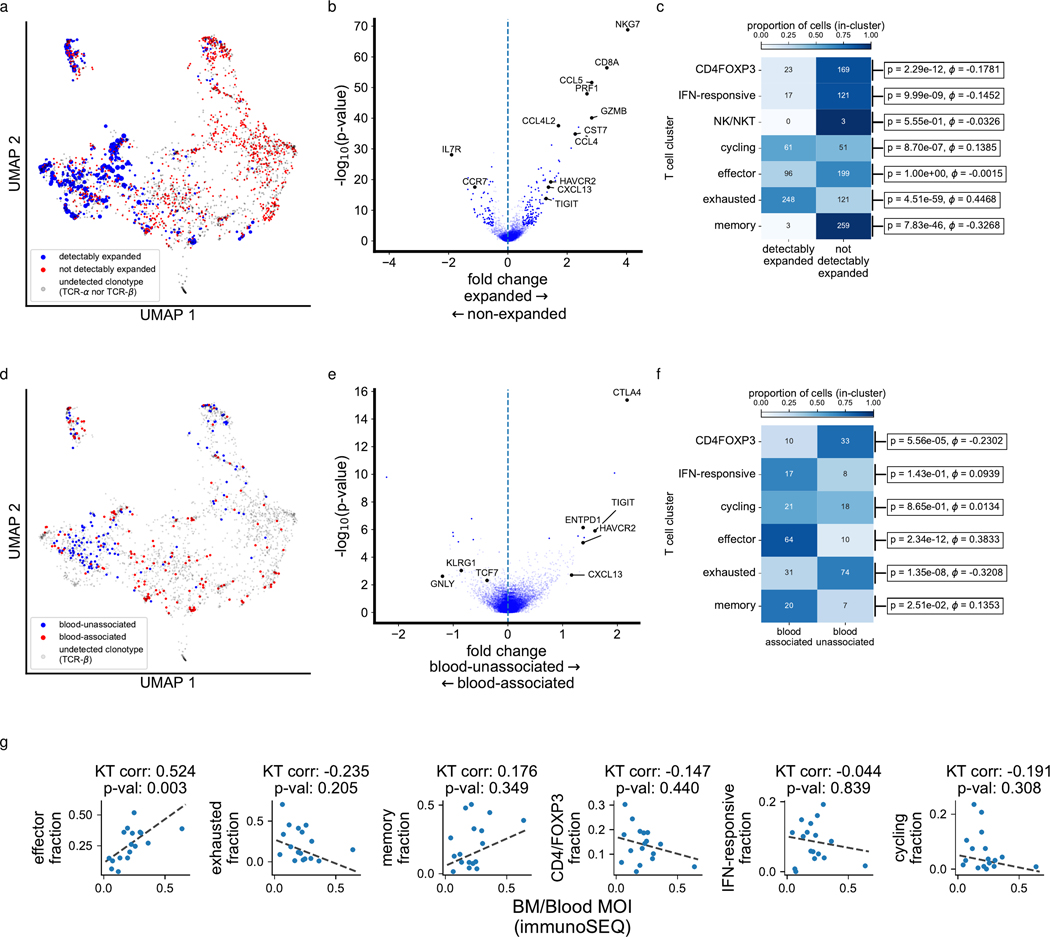
Melanoma-derived brain metastases (MBM) represent an unmet clinical need because central nervous system progression is frequently an end stage of the disease. Immune checkpoint inhibitors (ICI) provide a clinical opportunity against MBM; however, the MBM tumor microenvironment (TME) has not been fully elucidated in the context of ICI. To dissect unique elements of the MBM TME and correlates of MBM response to ICI, we collected 32 fresh MBM and performed single-cell RNA sequencing of the MBM TME and T-cell receptor clonotyping on T cells from MBM and matched blood and extracranial lesions. We observed myeloid phenotypic heterogeneity in the MBM TME, most notably multiple distinct neutrophil states, including an IL8-expressing population that correlated with malignant cell epithelial-to-mesenchymal transition. In addition, we observed significant relationships between intracranial T-cell phenotypes and the distribution of T-cell clonotypes intracranially and peripherally. We found that the phenotype, clonotype, and overall number of MBM-infiltrating T cells were associated with response to ICI, suggesting that ICI-responsive MBMs interact with peripheral blood in a manner similar to extracranial lesions. These data identify unique features of the MBM TME that may represent potential targets to improve clinical outcomes for patients with MBM.


Conflict of interest statement

Competing Interests

The other authors have no competing interests.

Figures

Figure 1.
Figure 1.. Study design, cohort overview, high-level cell classification and populations.
a) Schematic representation of the study. b) Patient clinical trajectories relative to initial diagnosis of brain metastasis. c) UMAP of single-cell transcriptomes, colored and circled by cell type. d) Heatmap of standardized gene expression of key marker genes for each cluster. e) Fraction of post-QC FACS sorted CD45+ cells in each cluster, for each sample. P-value was computed via Mann-Whitney U test using patient-averaged T-cell fraction for post-ICI nonresponders vs post-ICI partial responders. Samples derived from the same patient are grouped, with groups indicated by dashed brackets (n=7, 11 patients in non-responding, partial-responding groups, respectively).
Figure 2.
Figure 2.. Multiple myeloid phenotypes and their association with malignant phenotypes observed intracranially.
a) UMAP of post-QC monocyte-derived cells, including macrophages and microglia. b) Heatmap of standardized gene expression of marker genes for clusters of monocyte-derived cells. c) UMAP of post-QC neutrophils (excluding neutrophil-committed progenitors/eosinophils). d) Heatmap of standardized gene expression of marker genes for clusters of post-QC neutrophils (excluding neutrophil-committed progenitors/eosinophils). e) Dot plot of key genes associated with N1 and N2 phenotypes in the calprotectin-high, IFN-responsive, and IL8-high neutrophil populations. f) Swarm/violin plots of fraction of non-neutrophil-committed progenitors (of CD45+ cells) across patients; Mann-Whitney U p-value for comparison of post-treatment partial vs non-responders indicated (n=7, 11 patients in non-responding, partial-responding groups, respectively), quartiles indicated by dashed lines. g) Hematoxylin and eosin (H&E) stain of tumor section from MEL022 with 100 μm scale bar indicated, showing high levels of blood product and neutrophil infiltration. h) Swarm/violin plot of neutrophil fraction (of post-QC CD45+ cells, n=5, 22 for samples with and without evidence of necrosis, respectively), IL8 fraction (only samples with 10 or more neutrophils considered) in samples with and without evidence of necrosis (n=12, 5 for samples with and without necrosis, respectively), quartiles indicated by dashed lines. i) Swarm/violin plot of the hallmark angiogenesis module score for the IL8-expressing, calprotectin-high, and IFN-responsive neutrophils, with Mann-Whitney p-value of IL8 vs other neutrophils indicated (n=662, 269, 256 for calprotectin high, IL8 high, and IFN-responsive, respectively), quartiles indicated by dashed lines. j) Fraction of IL8-high neutrophils (of all mature) vs. EMT module score calculated in malignant cells across patients; Kendall-τ correlation and associated p-values are indicated. Kendall-tau correlations in Fig. 2j were computed only over patients with ten or more detected neutrophils (15 patients total). Theil-sen line of best fit indicated by dotted line. k) Dot plot of genes associated with NETosis across calprotectin-high, IFN-responsive, and IL8-high neutrophils.
Figure 3.
Figure 3.. T-cell phenotypic, clonotype heterogeneity, and corresponding association with response to ICI.
a) UMAP of post-QC CD3+ (isolated via FACS) T cells. b) Heatmap standardized expression of top 10 marker genes for each cluster. c) Heatmap of effect sizes (left) and negative base-10 logarithm of p-values (right) for module scores of selected signatures from Jerby-Arnon et al. (25), with NK/NKT cells removed. Effect sizes and p-values used were the common language effect size and Mann-Whitney U p-value, respectively. These are computed for each post-QC CD3+ T-cell cluster (NK/NKT cells removed) for the in-cluster and not-in-cluster groups, for the module score of the gene signature in question. Signatures with highest effect size for each cluster and p<10−10 highlighted in yellow (both cycling signatures highlighted for “cycling” cluster). N = 739, 701, 644, 349, 310, and 171 for effector, exhausted, naive/memory, CD4FOXP3, IFN-responsive, and cycling cells, respectively. d) Distribution of T-cell fraction (per the immunoSEQ assay) and phenotype fraction across patients; pre-treatment patients noted in bold, Mann-Whitney U p-value comparing distribution of post-treatment partial vs nonresponders indicated (With BM immunoSEQ data: n=10 post-treatment partial-responder, n=5 post-treatment non-responder patients; with blood immunoSEQ n=10 post-treatment partial-responder, n=6 post-treatment non-responder patients; with post-QC T cells, n=11 post-treatment partial-responder, n=5 post-treatment non-responder patients), quartiles indicated by dashed lines. e) Stacked bar plot for size of clonotypes identified via TraCeR. Only samples with 10 or more cells are shown. f) Swarm/violin plot of Simpson indices according to TraCeR and immunoSEQ across patients; pre-treatment patients noted in bold, one-sided Mann-Whitney U p-value comparing distribution of post-treatment partial vs non-responders indicated (With BM immunoSEQ data: n=10 post-treatment partial-responder, n=4 post-treatment non-responder patients; with extracranial immunoSEQ data: n=4 post-treatment partial-responder, n=3 post-treatment non-responder patients; with blood immunoSEQ n=10 post-treatment partial-responder, n=5 post-treatment non-responder patients; with post-QC T cell TraCeR, n=11 post-treatment partial-responder, n=5 post-treatment non-responder patients), quartiles indicated by dashed lines. Samples are combined when multiple samples from a single patient were present.
Figure 4.
Figure 4.. Association between T-cell CDR3 and phenotype.
a) UMAP (from Fig. 3a) indicating phenotypic distribution of detectably expanded T cells (blue), non-detectably expanded T cells (red), and non-clonotyped cells (gray); clone size of T cells belonging to detectably expanded clone is proportional in size to marker area. b) Volcano plot of differentially expressed genes between detectably and non-detectably expanded cells; key genes annotated. P-values calculated via Mann-Whitney U, n=421, 894 detectably and non-detectably expanded cells, respectively. c) Heatmap of fraction of detectably and non-detectably expanded cells in each cluster. Colors indicate fraction in each cluster, on-block annotations indicate absolute number of cells in each stratum. P-values (Fisher’s exact test on in-cluster and out-of-cluster counts for detectably/non-detectably expanded cells) and effect sizes (φ-coefficient) are annotated. d) UMAP (from Fig. 3a) indicating phenotypic distribution of blood-unassociated T cells (blue), blood-associated T cells (red), and non-clonotyped cells (gray). e) Volcano plot of differentially expressed genes between blood-unassociated and blood-associated T cells; key genes annotated. P-values calculated via Mann-Whitney U, n=150, 163 blood-associated and blood-unassociated cells, respectively. f) Heatmap of fraction of blood-associated and blood-unassociated cells in each cluster. Colors indicate fraction in each cluster, on-block annotations indicate absolute number of cells in each stratum. P-values (Fisher’s exact test on in-cluster and out-of-cluster counts for blood associated/unassociated cells) and effect sizes (φ-coefficient) are annotated. g) Association between patient-averaged post-QC phenotype fraction and MOI. Kendall-τ correlation and p-values are indicated (n=17). Theil-sen line of best fit indicated by dotted line.
Figure 5.
Figure 5.. Association of clonotype privacy with phenotype and ICI response.
a) UMAP (from Fig. 3a) indicating phenotypic distribution of T cells with private CDR3 (blue), public CDR3 (red), and non-clonotyped cells (gray). b) Distribution of CDR3 lengths in public and private clonotypes (n=97, n=206, respectively). Distribution is normalized kernel density estimate; quartiles indicated by dashed lines. Mann-Whitney p-value and Cohen’s D effect size annotated. c) Heatmap of fraction of cells with private and public CDR3 in each cluster. Colors indicate fraction in each cluster, on-block annotations indicate absolute number of cells in each stratum. P-values (Fisher’s exact test on in-cluster and out-of-cluster counts for cells with private/public CDR3s) and effect sizes (φ-coefficient) are annotated. d) Swarm/violin plots of fraction of T cells with private CDR3 across patients; pre-treatment patients noted in bold, Mann-Whitney U p-value comparing distribution of post-treatment partial vs non-responders indicated (n=9, 4 respectively). Dashed lines indicate quartiles. e) T1 post-contrast MRI of the brain and lung from an ICI responsive individual (MEL027). Representative images of the brain and lung are included at the time of craniotomy for the large, symptomatic cerebellar metastasis (pre-ICI) and after six months of ICI administration (11 cycles of pembrolizumab) indicating resolution of intra- and extracranial disease. Yellow arrows mark regions of enhancement indicative of pre-treatment disease. f) Hematoxylin and eosin (H&E) staining of tumor section from MEL027, indicating large population of TILs. g) Multiple prognostic metrics across patients (see Methods); distribution for each metric, with upper, lower quartiles indicated by dotted lines, median by dashed line. Black line connects values for individual responding patient MEL027.

References

    1. Nieblas-Bedolla E, Nayyar N, Singh M, Sullivan RJ, Brastianos PK. Emerging Immunotherapies in the Treatment of Brain Metastases. The Oncologist. 2021;26:231–41. - PMC - PubMed
    1. Brastianos PK, Carter SL, Santagata S, Cahill DP, Taylor-Weiner A, Jones RT, et al. Genomic Characterization of Brain Metastases Reveals Branched Evolution and Potential Therapeutic Targets. Cancer Discov [Internet]. 2015 [cited 2018 Nov 11]; Available from: http://cancerdiscovery.aacrjournals.org/content/early/2015/10/14/2159-82... - PMC - PubMed
    1. Twomey JD, Zhang B. Cancer Immunotherapy Update: FDA-Approved Checkpoint Inhibitors and Companion Diagnostics. AAPS J. 2021;23:39. - PMC - PubMed
    1. Tawbi HA, Forsyth PA, Algazi A, Hamid O, Hodi FS, Moschos SJ, et al. Combined Nivolumab and Ipilimumab in Melanoma Metastatic to the Brain. N Engl J Med. Massachusetts Medical Society; 2018;379:722–30. - PMC - PubMed
    1. Kalbasi A, Ribas A. Tumour-intrinsic resistance to immune checkpoint blockade. Nat Rev Immunol. 2020;20:25–39. - PMC - PubMed

Publication types

Substances