. 2022 Aug:28:101858.
doi: 10.1016/j.pmedr.2022.101858. Epub 2022 Jun 10.

An optimized machine learning model for identifying socio-economic, demographic and health-related variables associated with low vaccination levels that vary across ZIP codes in California

Affiliations

An optimized machine learning model for identifying socio-economic, demographic and health-related variables associated with low vaccination levels that vary across ZIP codes in California

George Avirappattu et al. Prev Med Rep. 2022 Aug.

Abstract

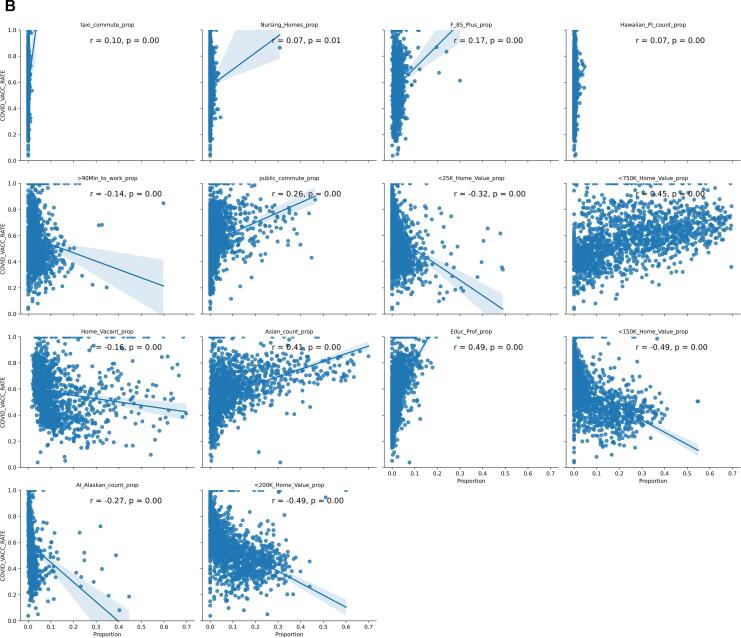
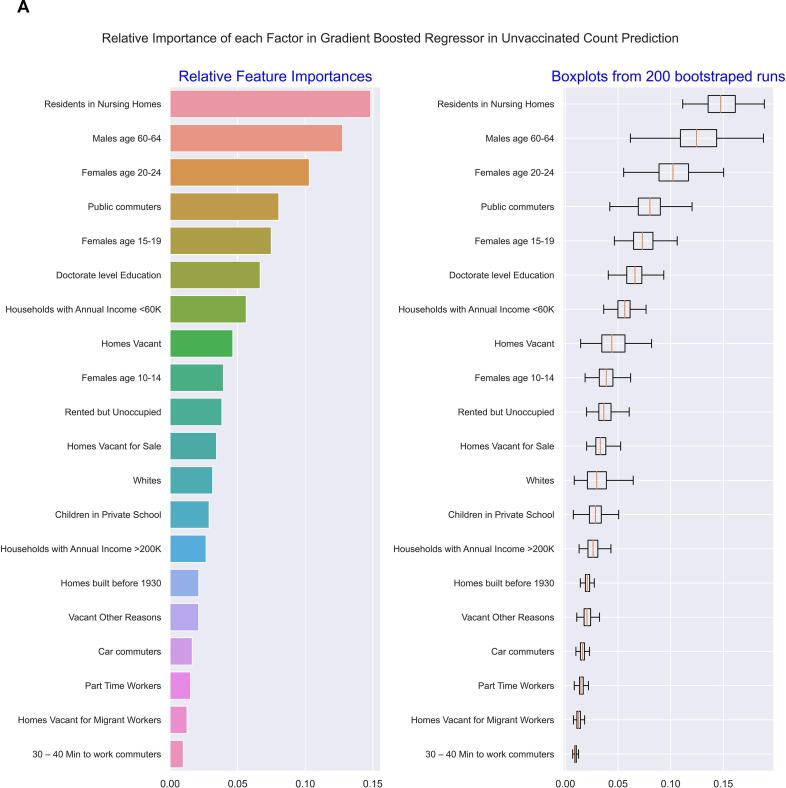
There is an urgent need for an in-depth and systematic assessment of a wide range of predictive factors related to populations most at risk for delaying and refusing COVID-19 vaccination as cases of the disease surge across the United States. Many studies have assessed a limited number of general sociodemographic and health-related factors related to low vaccination rates. Machine learning methods were used to assess the association of 151 social and health-related risk factors derived from the American Community Survey 2019 and the Centers for Disease Control and Prevention (CDC) BRFSS with the response variables of vaccination rates and unvaccinated counts in 1,555 ZIP Codes in California. The performance of various analytical models was evaluated according to their ability to regress between predictive variables and vaccination levels. Machine learning modeling identified the Gradient Boosting Regressor (GBR) as the predictive model with a higher percentage of the explained variance than the variance identified through linear and generalized regression models. A set of 20 variables explained 72.90% of the variability of unvaccinated counts among ZIP Codes in California. ZIP Codes were shown to be a more meaningful geo-local unit of analysis than county-level assessments. Modeling vaccination rates was not as effective as modeling unvaccinated counts. The public health utility of this model provides for the analysis of state and local conditions related to COVID-19 vaccination use and future public health problems and pandemics.

Keywords: COVID-19; Machine learning; Sociodemographic determinants; Spatial assessment; Vaccination uptake.


Conflict of interest statement

The authors declare that they have no known competing financial interests or personal relationships that could have influenced the work reported in this paper.

Figures

Fig. 1
Fig. 1
A and B: Box plots illustrate within-county variations on median household income and the Social Vulnerability Index (SVI) within the counties listed on the x-axis. Significant variations of many of these variables, especially within large counties, make it very challenging to understand how they may play a role in vaccination prevalence if measured only by counties, as is done in much of the literature and media.
Fig. 2A
Fig. 2A
Correlations between proportions of each feature group in ZIP codes in California and unvaccinated counts. As shown in the table above, these feature variables correlate significantly (p = 0) to the vaccination counts.
Fig. 2B
Fig. 2B
Correlations between proportions of each feature group in ZIP codes in California and vaccination rates. These feature variables correlate significantly to the vaccination rates, as shown in the table above.
Fig. 3
Fig. 3
A and B: ML Method selection - Modeling Unvaccinated Counts and Vaccination Rates in CA. These tables list different machine learning methods we tried on our data set before selecting the best one. We use 5-fold cross-validation to assess the performance of each method through “explained_variance” criteria. 20% of the data is set aside for each fold, and the model is trained on the other 80%. Then the trained model predicts on the 20% and calculates variance explained between the prediction y^ and the actual y values: L(y-y^)=1-Var(y-y^)Var(y). The higher the variance explained, the better the model.
Fig. 3
Fig. 3
A and B: ML Method selection - Modeling Unvaccinated Counts and Vaccination Rates in CA. These tables list different machine learning methods we tried on our data set before selecting the best one. We use 5-fold cross-validation to assess the performance of each method through “explained_variance” criteria. 20% of the data is set aside for each fold, and the model is trained on the other 80%. Then the trained model predicts on the 20% and calculates variance explained between the prediction y^ and the actual y values: L(y-y^)=1-Var(y-y^)Var(y). The higher the variance explained, the better the model.
Fig. 4
Fig. 4
A and B: Forward Sequential Selection considering variance explained by each variable starting from largest until a maximum is reached - for Unvaccinated Counts and Vaccination Rates.
Fig. 5
Fig. 5
A and B: Modeling Unvaccinated Counts and Vaccination Rates by ZIP codes in CA. The green lines represent the actual values in each ZIP code, and the dotted red predicted. (For interpretation of the references to colour in this figure legend, the reader is referred to the web version of this article.)
Fig. 6
Fig. 6
A and B: Modeling Unvaccinated Counts and Vaccination Rates by ZIP codes in CA. These scatter plots illustrate the correlation between actual values (on the x-axis) and predicted.
Fig. 6
Fig. 6
A and B: Modeling Unvaccinated Counts and Vaccination Rates by ZIP codes in CA. These scatter plots illustrate the correlation between actual values (on the x-axis) and predicted.
Fig. 7
Fig. 7
A and B: Feature Importances in predicting Unvaccinated Counts and Vaccination Rates using GBR in CA ZIP codes. The importances give us a sense of each variable's contribution in bringing the prediction as close as possible to the actual values.
Fig. 7
Fig. 7
A and B: Feature Importances in predicting Unvaccinated Counts and Vaccination Rates using GBR in CA ZIP codes. The importances give us a sense of each variable's contribution in bringing the prediction as close as possible to the actual values.

References

    1. Al-Mohaithef, M., Padhi, B.K., Ennaceur, S. Socio-Demographics Correlate of COVID-19 Vaccine Hesitancy During the Second Wave of COVID-19 Pandemic: A Cross-Sectional Web-Based Survey in Saudi Arabia. (2296-2565 (Electronic)). - PMC - PubMed
    1. Bureau USC. American Community Survey, 2019 American Community Survey 5-Year Estimates. US Census Bureau. Accessed October 19, 2020. https://data.census.gov/mdat/#/search?ds=ACSPUMS5Y2019.
    1. Aw J., Seng J.J.B., Seah S.S.Y., Low L.L. COVID-19 Vaccine Hesitancy—A Scoping Review of Literature in High-Income Countries. Vaccines. 2021;9(8):900. - PMC - PubMed
    1. Barry V Fau - Dasgupta S, Dasgupta S Fau - Weller DL, Weller Dl Fau - Kriss JL, et al. Patterns in COVID-19 Vaccination Coverage, by Social Vulnerability and Urbanicity - United States, December 14, 2020-May 1, 2021. (1545-861X (Electronic)). - PMC - PubMed
    1. BRFSS. PLACES: Local Data for Better Health, ZCTA Data 2020 release. https://chronicdata.cdc.gov/500-Cities-Places/PLACES-Local-Data-for-Bett....