

Bayesian hierarchical models for linear networks
- PMID: 35707112
- PMCID: PMC9042008
- DOI: 10.1080/02664763.2020.1864814
Bayesian hierarchical models for linear networks
Abstract
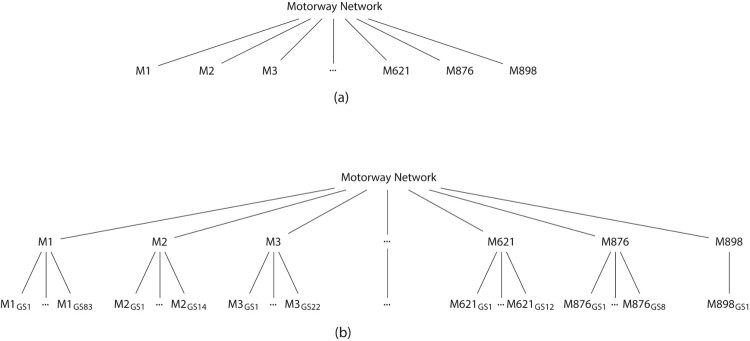
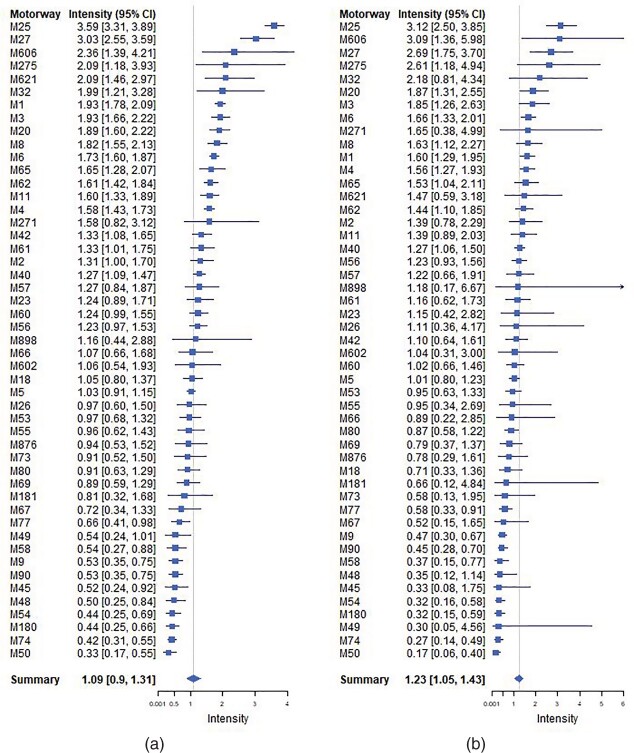
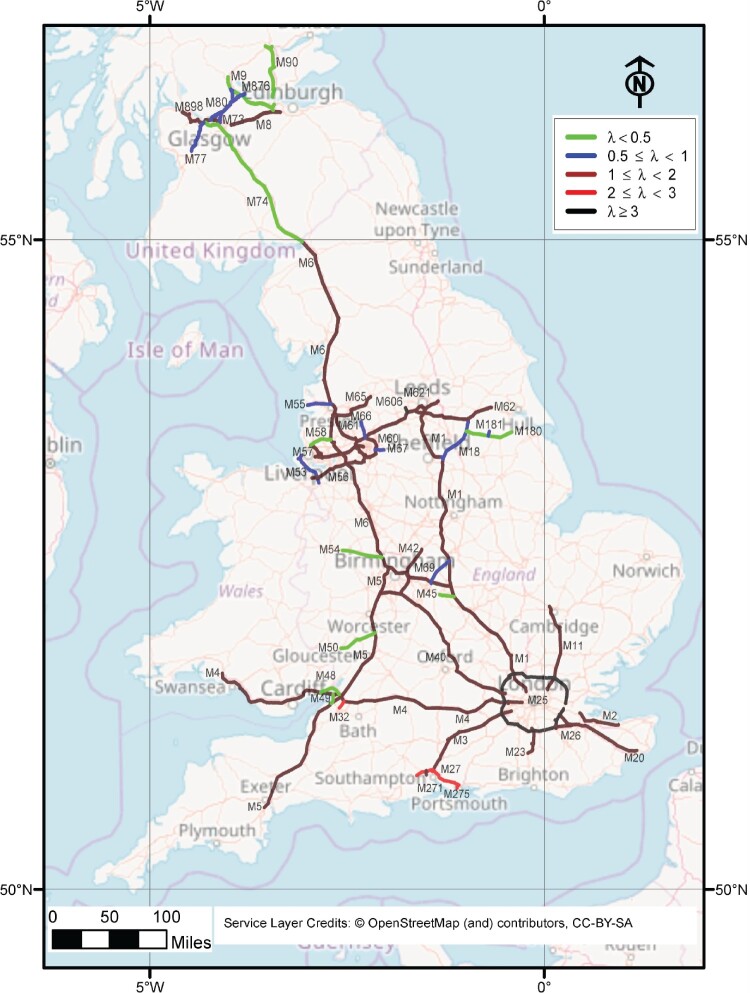
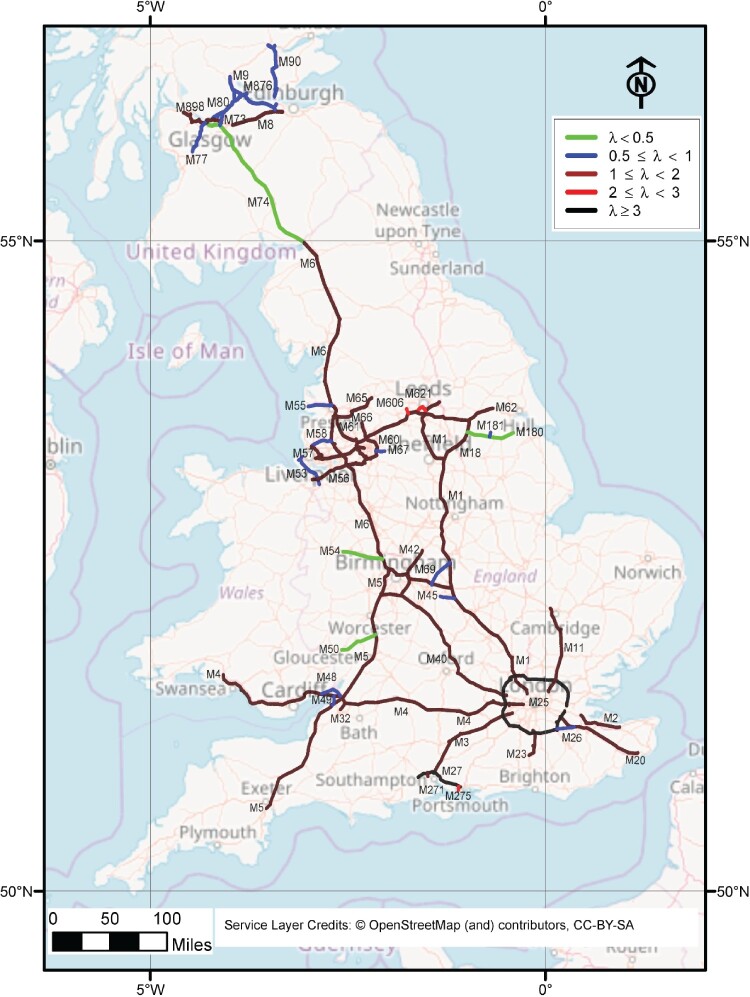
The purpose of this study is to highlight dangerous motorways via estimating the intensity of accidents and study its pattern across the UK motorway network. Two methods have been developed to achieve this aim. First, the motorway-specific intensity is estimated by using a homogeneous Poisson process. The heterogeneity across motorways is incorporated using two-level hierarchical models. The data structure is multilevel since each motorway consists of junctions that are joined by grouped segments. In the second method, the segment-specific intensity is estimated. The homogeneous Poisson process is used to model accident data within grouped segments but heterogeneity across grouped segments is incorporated using three-level hierarchical models. A Bayesian method via Markov Chain Monte Carlo is used to estimate the unknown parameters in the models and the sensitivity to the choice of priors is assessed. The performance of the proposed models is evaluated by a simulation study and an application to traffic accidents in 2016 on the UK motorway network. The deviance information criterion (DIC) and the widely applicable information criterion (WAIC) are employed to choose between models.
Keywords: Bayesian methods; Hierarchical models; linear networks; point processes.
© 2020 Informa UK Limited, trading as Taylor & Francis Group.
Conflict of interest statement
No potential conflict of interest was reported by the author(s).
Figures
Similar articles
-
Comparing hierarchical models via the marginalized deviance information criterion.Stat Med. 2018 Jul 20;37(16):2440-2454. doi: 10.1002/sim.7649. Epub 2018 Mar 26. Stat Med. 2018. PMID: 29579777
-
Comparing DIC and WAIC for multilevel models with missing data.Behav Res Methods. 2024 Apr;56(4):2731-2750. doi: 10.3758/s13428-023-02231-0. Epub 2023 Oct 20. Behav Res Methods. 2024. PMID: 37864117
-
Bayesian Poisson hierarchical models for crash data analysis: Investigating the impact of model choice on site-specific predictions.Accid Anal Prev. 2018 Aug;117:181-195. doi: 10.1016/j.aap.2018.04.016. Epub 2018 Apr 27. Accid Anal Prev. 2018. PMID: 29705601
-
Investigating different approaches to develop informative priors in hierarchical Bayesian safety performance functions.Accid Anal Prev. 2013 Jul;56:51-8. doi: 10.1016/j.aap.2013.03.023. Epub 2013 Apr 3. Accid Anal Prev. 2013. PMID: 23612558
-
[Bayesian statistics in spatial epidemiology].Zhejiang Da Xue Xue Bao Yi Xue Ban. 2008 Nov;37(6):642-7. doi: 10.3785/j.issn.1008-9292.2008.06.017. Zhejiang Da Xue Xue Bao Yi Xue Ban. 2008. PMID: 19084965 Review. Chinese.
Cited by
-
Advancing Precision Medicine: A Review of Innovative In Silico Approaches for Drug Development, Clinical Pharmacology and Personalized Healthcare.Pharmaceutics. 2024 Feb 27;16(3):332. doi: 10.3390/pharmaceutics16030332. Pharmaceutics. 2024. PMID: 38543226 Free PMC article. Review.
References
-
- Alarifi S.A., A bayesian multivariate hierarchical spatial joint model for predicting crash counts by crash type at intersections and segments along corridors, Accid. Anal. Prev. 119 (2018), pp. 263–273. - PubMed
-
- Alarifi S.A., Abdel-Aty M.A., Lee J., and Park J., Crash modeling for intersections and segments along corridors: a Bayesian multilevel joint model with random parameters, Anal. Meth. Accid. Res. 16 (2017), pp. 48–59.
-
- Anastasopoulos P.C., Random parameters multivariate tobit and zero-inflated count data models: addressing unobserved and zero-state heterogeneity in accident injury-severity rate and frequency analysis, Anal. Meth. Accid. Res. 11 (2016), pp. 17–32.
-
- Ang Q.W., Baddeley A., and Nair G., Geometrically corrected second order analysis of events on a linear network, with applications to ecology and criminology, Scand. J. Stat. 39 (2012), pp. 591–617.
-
- Baddeley A., Rubak E., and Turner R., Spatial Point Patterns: Methodology and Applications with R, CRC Press, Boca Raton, 2015.
LinkOut - more resources
Full Text Sources