. 2022 Jun 6:2022:5110161.
doi: 10.1155/2022/5110161. eCollection 2022.

Silencing the ADAM9 Gene through CRISPR/Cas9 Protects Mice from Alcohol-Induced Acute Liver Injury

Affiliations

Silencing the ADAM9 Gene through CRISPR/Cas9 Protects Mice from Alcohol-Induced Acute Liver Injury

Yong-Yong Zhang et al. Biomed Res Int. .

Abstract

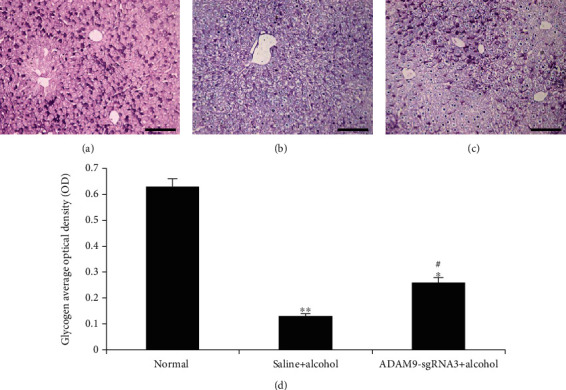
Alcoholic liver injury is a major global public health concern at present. The ADAM9 gene plays a crucial role in the occurrence and development of various liver diseases, but its role in acute alcoholic liver injury remains ambiguous. In this study, a chimeric single-guide RNA targeting the genomic regions of mouse ADAM9 was designed using the clustered regularly interspaced short palindromic repeats (CRISPR)/CRISPR-associated protein 9 (Cas9) technology. Next, the role of ADAM9 in acute alcoholic liver injury in vitro in cultured mouse cells and in vivo in a hydrodynamic injection-based alcoholic liver injury mouse model was documented. The findings of this study suggest that ADAM9 induces by regulating cell proliferation, apoptosis, and stress metabolism in mice. Thus, inhibiting the expression of ADAM9 gene using CRISPR/Cas9 can attenuate alcohol-induced acute liver injury in mice.


Conflict of interest statement

The authors declare that they have no conflicts of interest.

Figures

Figure 1
Figure 1
CRISPR sequences of the mouse ADAM9 gene. The underlined portion and yellow highlights indicate the CRISPR sequences, and the red highlight indicates the protospacer adjacent motif (PAM) sequence GG (RC: CCN).
Figure 2
Figure 2
Electrophoresis profiles of transformant positive clones obtained by PCR. The band of approximately 100 bp was a positive clone, and the leftmost lane contained the DNA marker: 100, 250, 500, 750, 1000, 1500, 2000, 3000, and 5000 bp. Lanes 2–6: pYSY-CMV-Cas9-U6-ADAM9-gRNA1-EFla-Puromycin clones; lanes 7–11: pYSY-CMV-Cas9-U6-ADAM9-gRNA2-EFla-Puromycin clones; lanes 12–15: pYSY-CMV-Cas9-U6-ADAM9-gRNA3-EFla-Puromycin clones.
Figure 3
Figure 3
ADAM9 DNA sequence alignment results. Wild type: the ADAM9 DNA sequence of wild mice. sgRNA inhibition: ADAM9 DNA sequence of mouse C2C12 myoblast transfected with sgRNA 3. Sequencing results compared using the DNAssist software.
Figure 4
Figure 4
ADAM9 protein expression in mouse C2C12 myoblasts transfected with ADAM9-sgRNA3. (a) Detection of ADAM9 protein expression in normal C2C12 cells and C2C12 cells transfected with sgRNA3 by western blotting. (b) ADAM9 expression levels were quantified using Gel-Pro Analyzer 4.0 software (Media Cybernetics Inc.). Band intensities were normalized to β-actin. AU = arbitrary unit. ∗∗P < 0.01: significant differences between normal C2C12 cells and C2C12 cells transfected with sgRNA3.
Figure 5
Figure 5
Serum (a) AST and (b) ALT levels in the mice 24 h after alcohol treatment. ∗∗P < 0.01 and P < 0.05: significant differences between the positive control or experimental group and the negative control group. ##P < 0.01: significant difference between the experimental and positive control groups. Every experiment was repeated three times.
Figure 6
Figure 6
Histologic examination of liver injuries in the mice 24 h after alcohol treatment. HE staining in the (a) negative control group, (b) positive control group, and (c) experimental group. (d) Necrotic score. ∗∗P < 0.01 and P < 0.05: significant differences between the positive control or experimental group and the negative control group. ##P < 0.01: significant difference between the experimental and positive control groups. Every experiment was repeated three times (scale bar: 50 μm).
Figure 7
Figure 7
Glycogen quantification in liver sections prepared from mice 24 h after alcohol treatment. PAS staining in the (a) negative control group, (b) positive control group, and (c) experimental group. (d) Staining quantification using the Motic Images Advanced 3.2 software (Motic China Group Co., Ltd., Xiamen, China). ∗∗P < 0.01 and P < 0.05: significant differences between the positive control or experimental group and the negative control group. #P < 0.01: significant difference between the experimental and positive control groups. Every experiment was repeated three times (scale bar: 50 μm).
Figure 8
Figure 8
Apoptosis analysis of liver sections from mice 24 h after alcohol treatment. Hoechst 33258 staining in the (a) negative control group, (b) positive control group, and (c) experimental group. (d) Apoptotic rate. ∗∗P < 0.01 and P < 0.05: significant differences between the positive control or experimental group and the negative control group. #P < 0.01: significant difference between the experimental and positive control groups. Every experiment was repeated three times (scale bar: 50 μm).
Figure 9
Figure 9
The influence of alcohol on the expression of ADAM9, HSP27, HSP70, PCNA, Bax, Bcl-2, caspase-3, VEGF, and p-STAT3 in the liver of mice 24 h after alcohol treatment. (a) Western blotting results. The expression levels of (b) ADAM9, (c) HSP27, (d) HSP70, (e) PCNA, (f) Bax, (g) Bcl-2, (h) caspase-3, (i) VEGF, and (j) p-STAT3 quantified with the Gel-Pro Analyzer 4.0 software (Media Cybernetics Inc.). Band intensities normalized to β-actin. AU = arbitrary unit. ∗∗P < 0.01 and P < 0.05: significant differences between the positive control or experimental group and the negative control group. ##P < 0.01 and #P < 0.05: significant differences between the experimental and positive control groups.
Figure 10
Figure 10
In vitro analysis of the effects of alcohol on the expression levels of ADAM9, HSP27, HSP70, PCNA, Bax, Bcl-2, caspase-3, VEGF, and p-STAT3 in hepatic L02 cells. (a) Western blotting results. The expression levels of (b) ADAM9, (c) HSP27, (d) HSP70, (e) PCNA, (f) Bax, (g) Bcl-2, (h) caspase-3, (i) VEGF, and (j) p-STAT3 quantified using Gel-Pro Analyzer 4.0 software (Media Cybernetics Inc.). Band intensities normalized to β-actin. AU = arbitrary unit. ∗∗P < 0.01 and P < 0.05: significant differences between the normal+ADAM9-sgRNA3, saline+alcohol, ADAM9-sgRNA+alcohol, and normal group. ##P < 0.01 and #P < 0.05: significant differences between the normal+ADAM9-sgRNA3, ADAM9-sgRNA+alcohol, and saline+alcohol groups. △△P < 0.01 and P < 0.05: significant difference between the ADAM9-sgRNA+alcohol group and the normal+ADAM9-sgRNA3 group.

References

    1. Lee W. M., Seremba E. Etiologies of acute liver failure. Current Opinion in Critical Care . 2008;14(2):198–201. doi: 10.1097/MCC.0b013e3282f6a420. - DOI - PubMed
    1. Gao B., Bataller R. Alcoholic liver disease: pathogenesis and new therapeutic targets. Gastroenterology . 2011;141(5):1572–1585. doi: 10.1053/j.gastro.2011.09.002. - DOI - PMC - PubMed
    1. Liu J., Ma Q., Zhang M., et al. Alterations of TP53 are associated with a poor outcome for patients with hepatocellular carcinoma: evidence from a systematic review and meta-analysis. European Journal of Cancer . 2012;48(15):2328–2338. doi: 10.1016/j.ejca.2012.03.001. - DOI - PMC - PubMed
    1. Miranda-Mendez A., Lugo-Baruqui A., Armendariz-Borunda J. Molecular basis and current treatment for alcoholic liver disease. International Journal of Environmental Research and Public Health . 2010;7(5):1872–1888. doi: 10.3390/ijerph7051872. - DOI - PMC - PubMed
    1. Zhang Y.-Y., Li S.-Q., Song Y., et al. The therapeutic effect of Chaihu-Shugan-San in fatty liver disease: a meta-analysis randomized controlled trials. International Journal of Clinical and Experimental Medicine . 2018;11:12880–12888.

Substances

LinkOut - more resources