. 2022 Jul 15;135(14):jcs260015.
doi: 10.1242/jcs.260015. Epub 2022 Jul 20.

Centriole distal-end proteins CP110 and Cep97 influence centriole cartwheel growth at the proximal end

Affiliations

Centriole distal-end proteins CP110 and Cep97 influence centriole cartwheel growth at the proximal end

Mustafa G Aydogan et al. J Cell Sci. .

Abstract

Centrioles are composed of a central cartwheel tethered to nine-fold symmetric microtubule (MT) blades. The centriole cartwheel and MTs are thought to grow from opposite ends of these organelles, so it is unclear how they coordinate their assembly. We previously showed that in Drosophila embryos an oscillation of Polo-like kinase 4 (Plk4) helps to initiate and time the growth of the cartwheel at the proximal end. Here, in the same model, we show that CP110 and Cep97 form a complex close to the distal-end of the centriole MTs whose levels rise and fall as the new centriole MTs grow, in a manner that appears to be entrained by the core cyclin-dependent kinase (Cdk)-Cyclin oscillator that drives the nuclear divisions in these embryos. These CP110 and Cep97 dynamics, however, do not appear to time the period of centriole MT growth directly. Instead, we find that changing the levels of CP110 and Cep97 appears to alter the Plk4 oscillation and the growth of the cartwheel at the proximal end. These findings reveal an unexpected potential crosstalk between factors normally concentrated at opposite ends of the growing centrioles, which might help to coordinate centriole growth. This article has an associated First Person interview with the first authors of the paper.

Keywords: CP110; Cell cycle; Centriole; Centrosome; Cep97; Embryogenesis; Organelle biogenesis; Polo-like kinase 4.


Conflict of interest statement

Competing interests Laura Hankins is currently an employee of The Company of Biologists and had no role in the review of the paper. The authors declare no other competing interests for this study.

Figures

Fig. 1.
Fig. 1.
3D-SIM analyses reveal that CP110 and Cep97 colocalize near the distal-end of the centriole microtubules. (A) 3D-SIM micrographs showing the distribution of the mother centriole marker Asl–mCherry and either uCP110–GFP or uGFP–Cep97 at mother–daughter centriole pairs in Drosophila wing disc cells. Scale bars: 0.2 μm. uCP110–GFP and uGFP–Cep97 are located at the distal ends of the mother and daughter centrioles (with the mother centriole viewed ‘end-on’, as depicted in the schematic). (B) The horizontal bar chart quantifies the mean radii of the indicated GFP moieties on the mother centrioles. Data are presented as mean±s.d. N=3 wing discs, n≥50 centrioles in total for each protein marker. Statistical significance was assessed using an unpaired t-test with Welch's correction (for Gaussian-distributed data) or an unpaired Mann–Whitney test (ns, not significant; ***P<0.001; ****P<0.0001). (C) The average radial position of each indicated GFP marker – coloured solid line (±1s.d.) – is overlaid on a schematic representation of the Trichonympha EM-tomogram-derived cartwheel structure (Guichard et al., 2013). The data for Sas-6–GFP and Sas-4–GFP were acquired on the same microscope set-up, but were analysed previously using single-molecule localization microscopy (Gartenmann et al., 2017). They are re-plotted here to indicate the positions of CP110 and Cep97 relative to the outer cartwheel spokes (Sas-6–GFP) and the area linking the cartwheel to the centriole MTs (Sas-4–GFP). CP110 and Cep97 colocalize with the predicted position of the centriole MTs. Note that the radial measurements of the relative position of a protein around the mother centriole do not provide any information about the location of a protein along the proximal-distal axis. In the schematic, we depict Sas-6 and Ana2 as being present along the entire length of the mother centriole, while CP110 and Cep97 are concentrated at the distal end (slightly offset in the schematic for ease of presentation) based on prior knowledge of the distributions of these proteins at centrioles.
Fig. 2.
Fig. 2.
CP110 and Cep97 are recruited to centrioles in a cyclical manner during each nuclear cycle. (A) Micrographs from two different embryos illustrate how the centriolar levels of uCP110–GFP and uGFP–Cep97 vary over time during nuclear cycle 12 – obtained by superimposing all the uCP110–GFP (n=150) or uGFP–Cep97 (n=115) centriole foci at each time point. (B) Graphs quantify the centrosomal fluorescence levels (mean±s.d., shaded area) of uCP110–GFP or uGFP–Cep97 in an individual embryo during cycles 11–13. The graphs are representative examples from four independent embryos expressing either uCP110–GFP or uGFP–Cep97 with an average of n=66 or 51 centrioles analysed per embryo, respectively. (C) Graph quantifies the centrosomal fluorescence levels (mean±s.d., shaded area) of uCP110–GFP and uRFP–Cep97 co-expressed in an individual embryo during cycles 11–13. The graph is representative of six independent embryos with an average of n=71 centrioles analysed per embryo. CS, centrosome separation; NEB, nuclear envelope breakdown; A.U., arbitrary units.
Fig. 3.
Fig. 3.
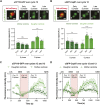
The cyclical recruitment of CP110–GFP and GFP–Cep97 during each nuclear cycle occurs largely at the growing daughter centriole. (A,B) Airy-scan micrographs of centrioles at the indicated stages of S-phase in embryos that express Asl–mCherry and either uCP110–GFP (A) or uGFP–Cep97 (B). D, daughter centriole; M, mother centriole. Scale bars: 0.2 μm. Bar charts quantify the centriolar levels (mean±s.e.m.) of uCP110–GFP (A) or uGFP–Cep97 (B) on the mother (dark green bars) and daughter (light green bars) centrioles at various stages of S-phase. N≥7 embryos. For uCP110–GFP, n=1–9 centrioles per embryo. For uGFP-Cep97, n=1–14 centrioles per embryo. Statistical significance was assessed using an ordinary one-way ANOVA test (for Gaussian-distributed data) or a Kruskal–Wallis test (ns, not significant; ***P<0.001; ****P<0.0001). (C,D) Graphs quantify the fluorescence intensity (mean±s.d., shaded area) acquired using Airy-scan microscopy of uCP110-GFP (C) or uGFP-Cep97 (D) on mother (dark green) and daughter (light green) centrioles in individual embryos over cycles 12–13. For uCP110–GFP, n=1–3 or 1–8 daughter and mother centrioles per time point in cycles 12 and 13, respectively. For uGFP–Cep97, n=1–4 or 1–10 daughter and mother centrioles per time point in cycles 12 and 13, respectively. Note that the numbers of centrioles analysed in these experiments is relatively low because the Airy-scan system has a small field of view (so we can track fewer centrioles) and because centrioles have to be unambiguously assigned as mothers or daughters. This was not always possible, and was particularly challenging during mitosis when the centrioles move rapidly within the embryo, and when the daughter centrioles are also starting to load Asl–mCherry as they mature into new mothers. CS, centrosome separation; NEB, nuclear envelope breakdown; A.U., arbitrary units.
Fig. 4.
Fig. 4.
CP110 and Cep97 are recruited to centrioles faster and to higher levels when they are expressed at higher levels. (A,B) Western blots comparing CP110 or Cep97 expression levels in WT embryos or embryos expressing one copy of either eCP110–GFP or uCP110–GFP (A), or eCep97–GFP or uGFP–Cep97 (B). Endogenous CP110 and Cep97 are indicated with arrows, the GFP-tagged proteins with arrowheads. Actin and Cnn are shown as loading controls. These blots were not repeated multiple times as similar comparisons have been published previously (Franz et al., 2013; Dobbelaere et al., 2020). (C,D) Graphs comparing how the levels (mean±s.e.m.) of centriolar CP110–GFP and Cep97–GFP change during nuclear cycle 12 in embryos expressing (C) uCP110–GFP or eCP110–GFP and (D) uGFP–Cep97 or eCep97–GFP, as indicated. (E,F) Bar charts quantify several parameters (mean±s.d.) of the recruitment dynamics derived from the profiles shown in C and D. N≥14 embryos per group, n≥9 centrioles per embryo. Statistical significance was assessed using an unpaired t-test with Welch's correction (for Gaussian-distributed data) or an unpaired Mann–Whitney test (ns, not significant; *P<0.05; ****P<0.0001). CS, centrosome separation; NEB, nuclear envelope breakdown; A.U., arbitrary units.
Fig. 5.
Fig. 5.
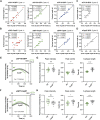
The phase of CP110 and Cep97 recruitment is strongly correlated to, and regulated by, the progression of the cell cycle in fly embryos. Scatter plots showing the positive correlation between S-phase length and the peak time of centriolar uCP110–GFP (A) and uGFP–Cep97 (B) levels in cycle 11–13, and of eCP110–GFP (C) and eCep97–GFP (D) levels in cycle 12. The plots were regressed using the line function in GraphPad Prism 8. Correlation strength was examined using Pearson's correlation coefficient (0.40<r<0.60=moderate; r>0.60=strong), and the statistical significance of the correlation was determined by the P-value. (E,F) Graphs comparing how the levels (mean±s.e.m.) of centriolar CP110–GFP or Cep97–GFP change during nuclear cycle 12 in embryos expressing uCP110–GFP (E) or uGFP–Cep97 (F) in WT or CycB+/− embryos, as indicated. (G,H) Bar charts quantify several parameters (mean±s.d.) of the recruitment dynamics derived from the profiles shown in E and F, respectively. N≥16 embryos per group, n≥50 centrioles per embryo. Statistical significance was assessed using an unpaired t-test with Welch's correction (ns, not significant; *P<0.05; **P<0.01; ****P<0.0001). CS, centrosome separation; NEB, nuclear envelope breakdown; A.U., arbitrary units.
Fig. 6.
Fig. 6.
CP110 and Cep97 levels influence the rate and period of centriole cartwheel growth. (A,B) Graphs comparing the Sas-6–GFP incorporation profile (mean±s.e.m.) – as a proxy for centriole cartwheel growth (Aydogan et al., 2018) – during nuclear cycle 12 in WT embryos or in embryos lacking or overexpressing CP110 (A) or Cep97 (B). (C,D) Bar charts quantify several parameters of cartwheel growth (mean±s.d.) derived from the profiles shown in A and B, respectively. N≥14 embryos per group, n≥40 centrioles on average per embryo. Statistical significance was assessed using an ordinary one-way ANOVA test (for Gaussian-distributed data) or a Kruskal–Wallis test (*P<0.05; **P<0.01; ***P<0.001; ****P<0.0001). O/E, overexpressing; CS, centrosome separation; NEB, nuclear envelope breakdown; A.U., arbitrary units.
Fig. 7.
Fig. 7.
CP110 and Cep97 levels influence the parameters of the Plk4 oscillation. Graphs show the fitted oscillation in centriolar Plk4–GFP levels (mean±s.e.m.) in S-phase of nuclear cycle 12 in embryos expressing various levels of either CP110 or Cep97. The Plk4 oscillation was previously shown to influence the parameters of centriole growth (Aydogan et al., 2020). Corresponding bar charts compare the amplitude and centre (mean±s.d.) of the fitted Plk4–GFP oscillation under the indicated conditions. N≥16 embryos per group, n≥45 centriole pairs per embryo. Statistical significance was assessed using an ordinary one-way ANOVA test (for Gaussian-distributed data) or a Kruskal–Wallis test (**P<0.01; ****P<0.0001). O/E, overexpressing; CS, centrosome separation; NEB, nuclear envelope breakdown; A.U., arbitrary units.
Fig. 8.
Fig. 8.
Altering the cytoplasmic levels or activity of Plk4 does not detectably alter the cytoplasmic levels of CP110 or Cep97 and vice versa. (A) Bar charts quantifying PeCoS measurements (mean±s.d.) of Plk4–GFP in embryos expressing various levels of CP110 and Cep97. Every data point represents one 180 s measurement from an individual embryo. Statistical significance was assessed using an ordinary one-way ANOVA test (for Gaussian-distributed data) or a Kruskal–Wallis test (ns, not significant). (B) Bar charts quantifying the background-corrected FCS measurements (mean±s.d.) of uCP110–GFP or uGFP–Cep97 under the indicated conditions. Each data point represents the average of 4–6 recordings from each embryo measured. Statistical significance was assessed using an ordinary unpaired t-test (for Gaussian-distributed data) or a Mann–Whitney test (ns, not significant). (C) Upper panel, western blots showing the cytoplasmic expression of endogenous CP110 and Cep97 (arrows) under the same conditions used to measure the concentration of uCP110-GFP and uGFP-Cep97 by FCS in B. Actin is shown as a loading control, and prominent non-specific bands are indicated (*). Representative blots are shown from four technical repeats. Lower panel, bar charts quantify the loading-normalized levels (mean±s.d.) of CP110 and Cep97 from the four technical repeats. Statistical significance was assessed using a Mann–Whitney test (ns, not significant).

References

    1. Alvarez-Rodrigo, I., Steinacker, T. L., Saurya, S., Conduit, P. T., Baumbach, J., Novak, Z. A., Aydogan, M. G., Wainman, A. and Raff, J. W. (2019). Evidence that a positive feedback loop drives centrosome maturation in fly embryos. ELife 8, e50130. 10.7554/eLife.50130 - DOI - PMC - PubMed
    1. Alvarez-Rodrigo, I., Wainman, A., Saurya, S. and Raff, J. W. (2021). Ana1 helps recruit Polo to centrioles to promote mitotic PCM assembly and centriole elongation. J. Cell Sci. 134, jcs258987. 10.1242/jcs.258987 - DOI - PMC - PubMed
    1. Arquint, C. and Nigg, E. A. (2016). The PLK4–STIL–SAS-6 module at the core of centriole duplication. Biochem. Soc. Trans. 44, 1253-1263. 10.1042/BST20160116 - DOI - PMC - PubMed
    1. Aydogan, M. G., Wainman, A., Saurya, S., Steinacker, T. L., Caballe, A., Novak, Z. A., Baumbach, J., Muschalik, N. and Raff, J. W. (2018). A homeostatic clock sets daughter centriole size in flies. J. Cell Biol. 217, 1233-1248. 10.1083/jcb.201801014 - DOI - PMC - PubMed
    1. Aydogan, M. G., Steinacker, T. L., Mofatteh, M., Wilmott, Z. M., Zhou, F. Y., Gartenmann, L., Wainman, A., Saurya, S., Novak, Z. A., Wong, S.-S.et al. (2020). An autonomous oscillation times and executes centriole biogenesis. Cell 181, 1566-1581.e27. 10.1016/j.cell.2020.05.018 - DOI - PMC - PubMed

Publication types

MeSH terms

LinkOut - more resources