On the choice of timescale for other cause mortality in a competing risk setting using flexible parametric survival models
- PMID: 35708221
- PMCID: PMC9795972
- DOI: 10.1002/bimj.202100254
On the choice of timescale for other cause mortality in a competing risk setting using flexible parametric survival models
Abstract
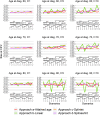
In competing risks settings where the events are death due to cancer and death due to other causes, it is common practice to use time since diagnosis as the timescale for all competing events. However, attained age has been proposed as a more natural choice of timescale for modeling other cause mortality. We examine the choice of using time since diagnosis versus attained age as the timescale when modeling other cause mortality, assuming that the hazard rate is a function of attained age, and how this choice can influence the cumulative incidence functions ( s) derived using flexible parametric survival models. An initial analysis on the colon cancer data from the population-based Swedish Cancer Register indicates such an influence. A simulation study is conducted in order to assess the impact of the choice of timescale for other cause mortality on the bias of the estimated and how different factors may influence the bias. We also use regression standardization methods in order to obtain marginal estimates. Using time since diagnosis as the timescale for all competing events leads to a low degree of bias in for cancer mortality ( ) under all approaches. It also leads to a low degree of bias in for other cause mortality ( ), provided that the effect of age at diagnosis is included in the model with sufficient flexibility, with higher bias under scenarios where a covariate has a time-varying effect on the hazard rate for other cause mortality on the attained age scale.
Keywords: attained age; choice of timescale; competing risks; flexible parametric models; simulation study.
© 2022 The Authors. Biometrical Journal published by Wiley-VCH GmbH.
Conflict of interest statement
The authors declare that they have no conflicts of interest. Coauthor Michael J. Crowther is a paid consultant to StataCorp for work not associated with this study.
Figures


References
-
- Aalen, O. O. , & Johansen, S. (1978). An empirical transition matrix for non‐homogeneous Markov chains based on censored observations. Scandinavian Journal of Statistics, 141–150.
-
- Canchola, A. J. , Stewart, S. L. , Bernstein, L. , West, D. W. , Ross, R. K. , Deapen, D. , Pinder, R., Reynolds, P., Wright, W., Anton‐Culver, H., Peel, D., Ziogas, A., & Horn‐Ross, P.L. (2003). Cox regression using different time‐scales. Western Users of SAS Software. San Francisco, CA.
-
- Chalise, P. , Chicken, E. , & McGee, D. (2012). Baseline age effect on parameter estimates in Cox models. Journal of Statistical Computation and Simulation, 82(12), 1767–1774.
-
- Chalise, P. , Chicken, E. , & McGee, D. (2016). Time Scales in Epidemiological Analysis: An Empirical Comparison. International Journal of Statistics and Probability, 5(3), 91. 10.5539/ijsp.v5n3p91 - DOI
-
- Cole, S. R. , Lau, B. , Eron, J. J. , Brookhart, M. A. , Kitahata, M. M. , Martin, J. N. , & Mugavero, M. J. (2015). Estimation of the standardized risk difference and ratio in a competing risks framework: Application to injection drug use and progression to aids after initiation of antiretroviral therapy. American Journal of Epidemiology, 181(4), 238–245. - PMC - PubMed
Publication types
MeSH terms
LinkOut - more resources
Full Text Sources

