

Complementary Structural Information for Antibody-Antigen Complexes from Hydrogen-Deuterium Exchange and Covalent Labeling Mass Spectrometry
- PMID: 35708229
- PMCID: PMC9631465
- DOI: 10.1021/jasms.2c00108
Complementary Structural Information for Antibody-Antigen Complexes from Hydrogen-Deuterium Exchange and Covalent Labeling Mass Spectrometry
Abstract
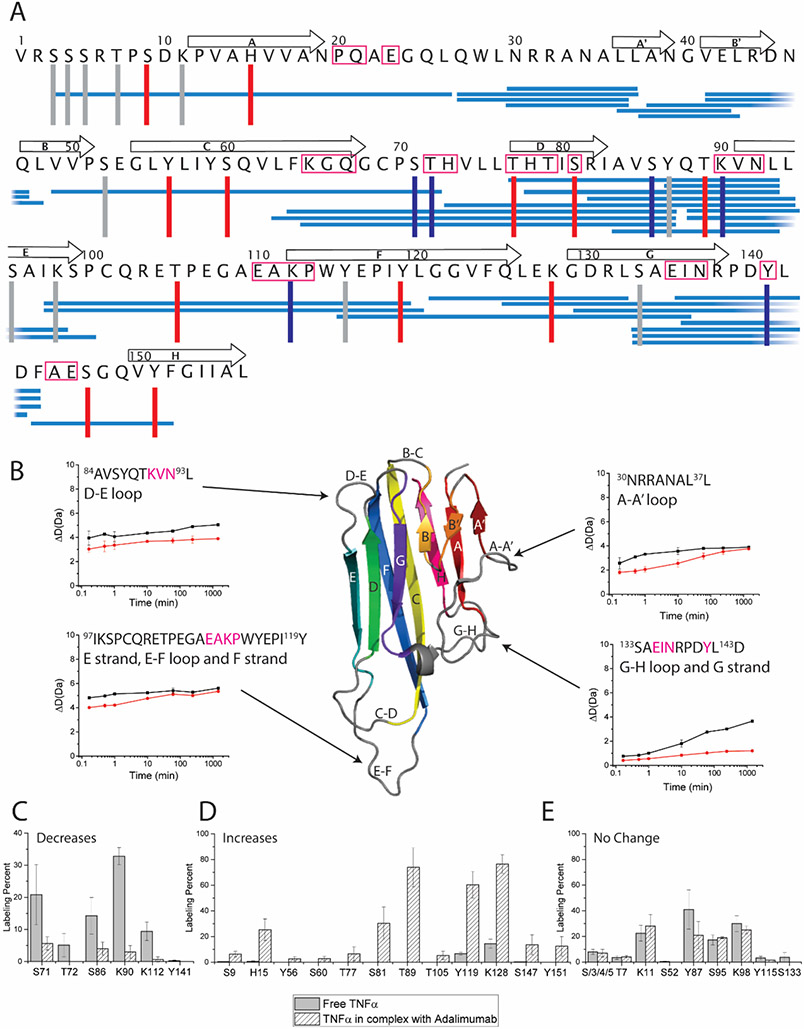
Characterizing antibody-antigen interactions is necessary for properly developing therapeutic antibodies, understanding their mechanisms of action, and patenting new drug molecules. Here, we demonstrate that hydrogen-deuterium exchange (HDX) mass spectrometry (MS) measurements together with diethylpyrocarbonate (DEPC) covalent labeling (CL) MS measurements provide higher order structural information about antibody-antigen interactions that is not available from either technique alone. Using the well-characterized model system of tumor necrosis factor α (TNFα) in complex with three different monoclonal antibodies (mAbs), we show that two techniques offer a more complete overall picture of TNFα's structural changes upon binding different mAbs, sometimes providing synergistic information about binding sites and changes in protein dynamics upon binding. Labeling decreases in CL generally occur near the TNFα epitope, whereas decreases in HDX can span the entire protein due to substantial stabilization that occurs when mAbs bind TNFα. Considering both data sets together clarifies the TNFα regions that undergo a decrease in solvent exposure due to mAb binding and that undergo a change in dynamics due to mAb binding. Moreover, the single-residue level resolution of DEPC-CL/MS can clarify HDX/MS data for long peptides. We feel that the two techniques should be used together when studying the mAb-antigen interactions because of the complementary information they provide.
Conflict of interest statement
Disclosure statement
The authors report no conflict of interest.
Figures


Similar articles
-
Complementary Structural Information for Stressed Antibodies from Hydrogen-Deuterium Exchange and Covalent Labeling Mass Spectrometry.J Am Soc Mass Spectrom. 2021 May 5;32(5):1237-1248. doi: 10.1021/jasms.1c00072. Epub 2021 Apr 22. J Am Soc Mass Spectrom. 2021. PMID: 33886284 Free PMC article.
-
Computational Structure Prediction for Antibody-Antigen Complexes From Hydrogen-Deuterium Exchange Mass Spectrometry: Challenges and Outlook.Front Immunol. 2022 May 26;13:859964. doi: 10.3389/fimmu.2022.859964. eCollection 2022. Front Immunol. 2022. PMID: 35720345 Free PMC article. Review.
-
Synergistic Structural Information from Covalent Labeling and Hydrogen-Deuterium Exchange Mass Spectrometry for Protein-Ligand Interactions.Anal Chem. 2019 Dec 3;91(23):15248-15254. doi: 10.1021/acs.analchem.9b04257. Epub 2019 Nov 12. Anal Chem. 2019. PMID: 31664819 Free PMC article.
-
Impact of Tryptophan Oxidation in Complementarity-Determining Regions of Two Monoclonal Antibodies on Structure-Function Characterized by Hydrogen-Deuterium Exchange Mass Spectrometry and Surface Plasmon Resonance.Pharm Res. 2018 Dec 10;36(1):24. doi: 10.1007/s11095-018-2545-8. Pharm Res. 2018. PMID: 30536043 Free PMC article.
-
Advances in mass spectrometry-based epitope mapping of protein therapeutics.J Pharm Biomed Anal. 2022 Jun 5;215:114754. doi: 10.1016/j.jpba.2022.114754. Epub 2022 Apr 6. J Pharm Biomed Anal. 2022. PMID: 35427962 Review.
Cited by
-
Mapping conformational changes on bispecific antigen-binding biotherapeutic by covalent labeling and mass spectrometry.J Pharm Anal. 2024 Aug;14(8):100966. doi: 10.1016/j.jpha.2024.100966. Epub 2024 Mar 16. J Pharm Anal. 2024. PMID: 39263356 Free PMC article.
-
Mass Spectrometry-Driven Epitope Mapping: Application of Diethylpyrocarbonate Covalent Labeling for the Immunotherapeutic Target Programmed Cell Death Protein 1.J Am Soc Mass Spectrom. 2025 Jul 2;36(7):1480-1492. doi: 10.1021/jasms.5c00070. Epub 2025 Jun 20. J Am Soc Mass Spectrom. 2025. PMID: 40540218 Free PMC article.
-
Determination of Protein Monoclonal-Antibody Epitopes by a Combination of Structural Proteomics Methods.J Proteome Res. 2023 Sep 1;22(9):3096-3102. doi: 10.1021/acs.jproteome.3c00159. Epub 2023 Aug 1. J Proteome Res. 2023. PMID: 37526474 Free PMC article.
References
-
- Pettersson I Methods of Epitope Mapping. Mol. Biol. Rep 1992, 16, 149–153. - PubMed
-
- Fiedler W; Borchers C; Macht M; Deininger SO; Przybylski M Molecular Characterization of a Conformational Epitope of Hen Egg White Lysozyme by Differential Chemical Modification of Immune Complexes and Mass Spectrometric Peptide Mapping. Bioconjug. Chem 1998, 9 (2), 236–241. 10.1021/bc970148g. - DOI - PubMed
-
- Narang D; James DA; Balmer MT; Wilson DJ Protein Footprinting, Conformational Dynamics, and Core Interface-Adjacent Neutralization “Hotspots” in the SARS-CoV-2 Spike Protein Receptor Binding Domain/Human ACE2 Interaction. J. Am. Soc. Mass Spectrom 2021, 32 (7), 1593–1600. 10.1021/jasms.0c00465. - DOI - PubMed
MeSH terms
Substances
Grants and funding
LinkOut - more resources
Full Text Sources
