. 2022 Nov 10;31(22):3807-3828.
doi: 10.1093/hmg/ddac135.

Cerebellar contribution to threat probability in a SCA6 mouse model

Affiliations

Cerebellar contribution to threat probability in a SCA6 mouse model

Pauline Bohne et al. Hum Mol Genet. .

Abstract

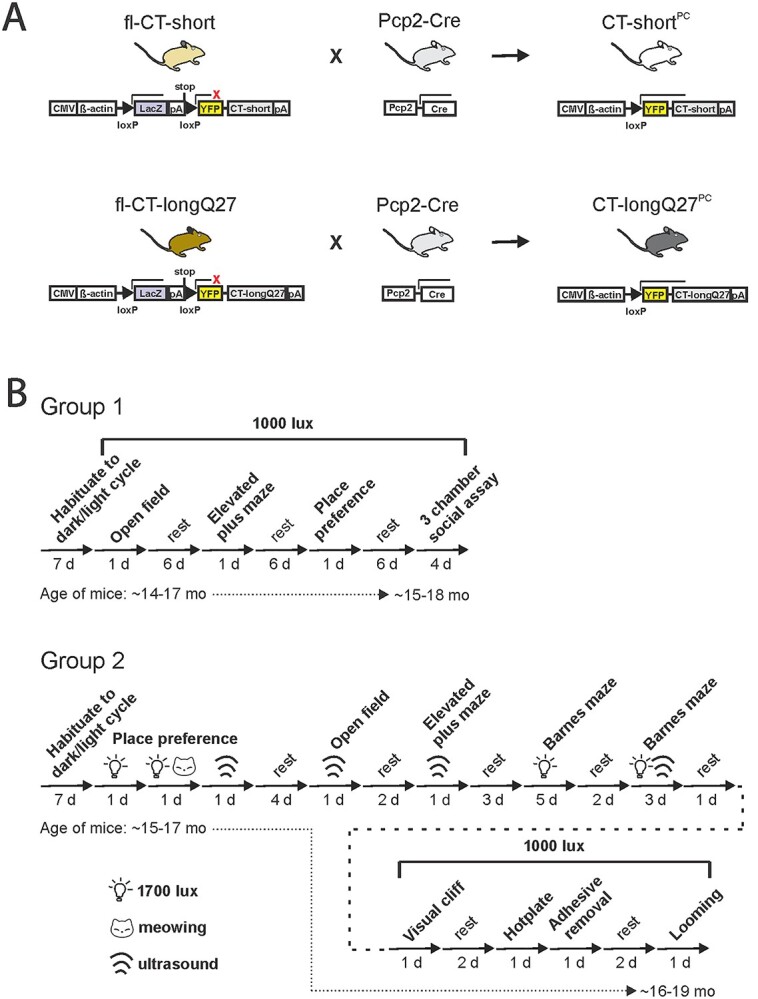
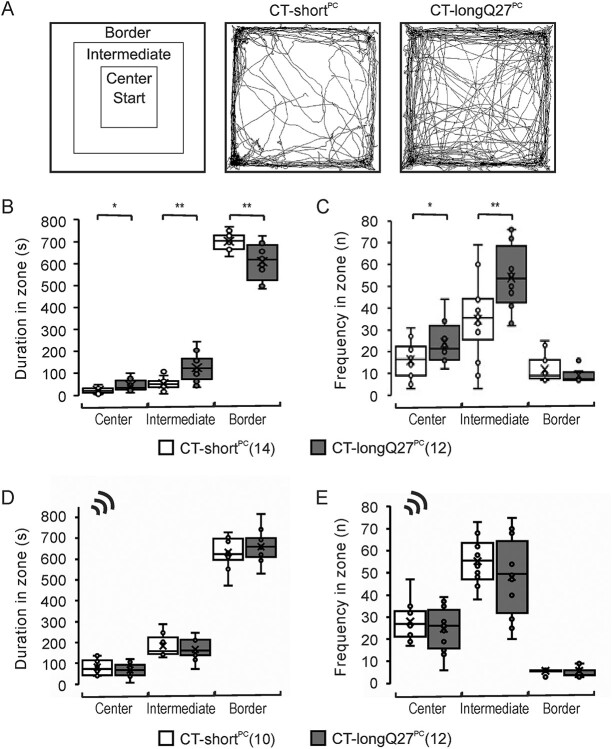
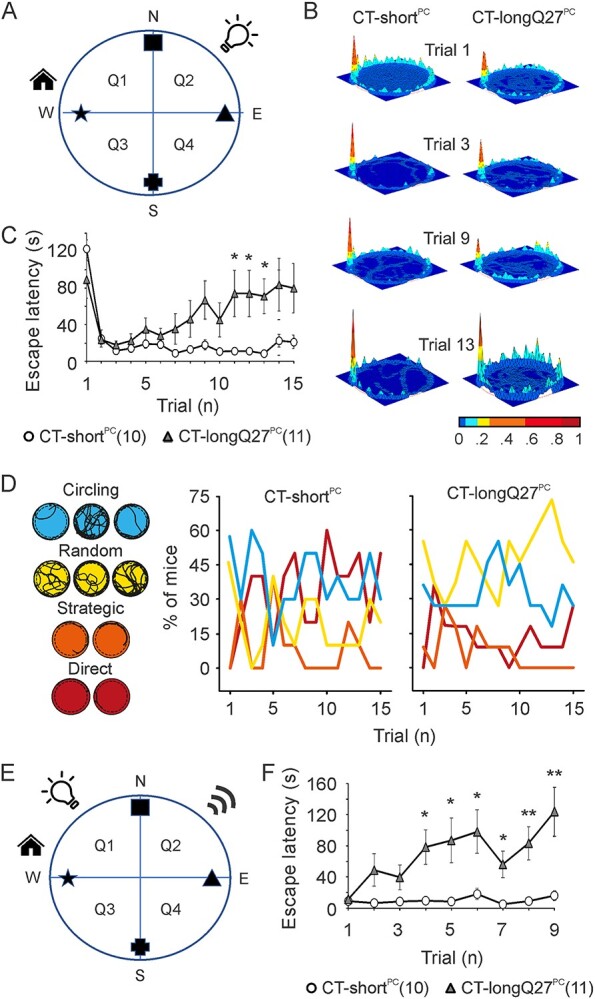
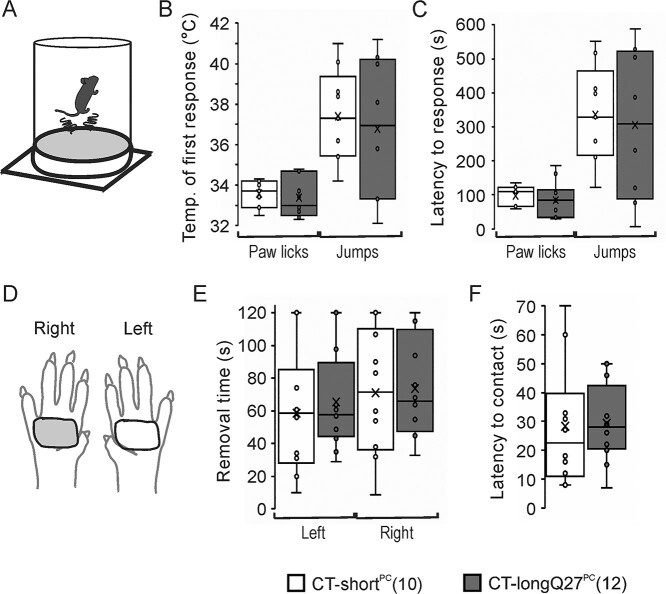
Fear and anxiety have proven to be essential during the evolutionary process. However, the mechanisms involved in recognizing and categorizing threat probability (i.e. low to high) to elicit the appropriate defensive behavior are yet to be determined. In this study, we investigated the cerebellar contribution in evoking appropriate defensive escape behavior using a purely cerebellar, neurodegenerative mouse model for spinocerebellar ataxia type 6 which is caused by an expanded CAG repeat in exon 47 of the P/Q type calcium channel α1A subunit. These mice overexpress the carboxy terminus (CT) of the P/Q type calcium channel containing an expanded 27 CAG repeat specifically in cerebellar Purkinje cells (CT-longQ27PC). We found that our CT-longQ27PC mice exhibit anxiolytic behavior in the open field, elevated plus maze and light/dark place preference tests, which could be recovered with more threatening conditions such as brighter lighting, meowing sounds and an ultrasound repellent. Their innate fear to find safety in the Barnes maze and visual cliff tests was also diminished with subsequent trials, which could be partially recovered with an ultrasound repellent in the Barnes maze. However, under higher threat conditions such as in the light/dark place preference with ultrasound repellent and in the looming tests, CT-longQ27PC mice responded with higher defensive escape behaviors as controls. Moreover, CT-longQ27PC mice displayed increased levels of CT-labeled aggregates compared with controls. Together these data suggest that cerebellar degeneration by overexpression of CT-longQ27PC is sufficient to impair defensive escape responses in those mice.


Figures

Figure 1
Figure 1
Schematics of the generation of transgenic CT-longQ27PC and CT-shortPC mouse lines and the sequence of behavior tests performed. (A) Description of the constructs used to create the transgenic mice expressing CT-short (fl-CT-short) or CT-longQ27 (fl-CT-longQ27). The human CT-short and CT-longQ27 constructs were tagged with a YFP at their N terminus and cloned into the pCZW vector containing the ubiquitous CMV/β-actin promotor and a floxed (loxP sites represented as black triangles) lacZ cassette with a stop codon. To activate the expression of CT-short and CT-longQ27 constructs, fl-CT-short and fl-CT-longQ27 transgenic lines were crossbred with a mouse line that specifically expresses Cre recombinase in Purkinje cells (PCP2–Cre). After Cre-mediated recombination, the lacZ expression cassette containing the stop condon is excised out, resulting in mice (CT-shortPC and CT-longQ27PC) expressing the CTs only in Purkinje cells containing the Cre recombinase. pA, polyadenylation. (B) Timeline of behavior tests performed with group 1 and later with group 2 of mice under various lighting (light bulb symbol) or sound (meowing or ultrasound symbol) conditions. Each arrow represents a different behavior experiment or rest day. The duration of the experiment or rest breaks are indicated below the arrow in days. The approximate age of the mice at the start and end of the behavior study is indicated below the sequence of behavior tests in months (mo).
Figure 2
Figure 2
In CT-longQ27PC mice ultrasound repellent conditions restore anxious behavior in the open field test. (A) Schematic of the different areas analyzed in the open field (left), which includes the border, intermediate and center regions. Mice were placed in the center at the start of the test and allowed to explore for 15 min under 1000 lux lighting conditions. An example trace from one CT-shortPC (middle) and CT-longQ27PC (right). Whisker boxplots from the average time (B) and frequency (C) spent in center, intermediate and border regions of the open field from CT-shortPC (white) and CT-longQ27PC (gray) mice under 1000 lux lighting conditions. Whisker boxplots from the average time (D) and frequency (E) spent in center, intermediate and border regions of the open field from CT-shortPC (white) and CT-longQ27PC (gray) mice under 1000 lux lighting plus a 70 kHz ultrasound repellent. CT-longQ27PC mice spent less time in the border and more time and visits in the center and intermediate regions than CT-shortPC mice under 1000 lux lighting conditions. However, CT-longQ27PC mice behaved similarly to CT-shortPC mice when the threat situation was increased with an ultrasound repellent. The number of mice tested/group is indicated in parentheses in the legend. Statistical significance was evaluated by an unpaired Students t-test with unequal variance (*P ≤ 0.05, **P ≤ 0.01).
Figure 3
Figure 3
CT-longQ27PC mice exhibit anxiolytic behavior except under ultrasound repellent conditions in the elevated plus maze. (A) Depiction of the elevated plus maze (left) consisting of two closed (black) and two open (grey) arms and the center where the test begins. Representative traces from a CT-shortPC (middle) and CT-longQ27PC (right) mouse under 1000 lux lighting conditions. Whisker boxplots from the duration (B) and frequency (C) spent in open and closed arms under 1000 lux lighting conditions for CT-shortPC (white) and CT-longQ27PC (gray) mice. Whisker boxplots from the duration (D) and frequency (E) spent in open and closed arms under 1000 lux lighting plus a 70 kHz ultrasound repellent for CT-shortPC (white) and CT-longQ27PC (gray) mice. CT-longQ27PC mice spent more time in the open arms and less time in the closed arms than the CT-shortPC mice under 1000 lux lighting conditions. In the presence of an ultrasound repellent CT-longQ27PC mice behaved like their control, CT-shortPC mice. The number of mice tested/group is indicated in parentheses in the legend. Statistical significance was evaluated by an unpaired Student t-test with unequal variance (*P ≤ 0.05, **P ≤ 0.01, ***P ≤ 0.001).
Figure 4
Figure 4
CT-longQ27PC mice demonstrate increasing anxious behavior with higher threat conditions in the place preference test. (A) Schematic of the place preference test (left) where an open field was divided into a light zone (gray) and dark zone (black). Mice started in the light zone in the opposite corner to the dark zone entrance and were given 5 min to explore both zones. Representative traces from a CT-shortPC (middle) and CT-longQ27PC (right) mouse under 1000 lux lighting conditions. Whisker boxplots from the duration spent in the light or dark zone under 1000 lux lighting conditions (B), bright, 1700 lux lighting conditions (C), bright, 1700 lux lighting plus intermittent meowing sounds (D) and 1000 lux lighting plus a 70 kHz ultrasound repellent (E) for CT-shortPC (white) and CT-longQ27PC (gray) mice. CT-longQ27PC mice spent more time in the light zone than the dark zone under 1000 lux lighting conditions compared with CT-shortPC controls. Whereas the CT-shortPC mice spent equal time in both arenas. Under brighter lighting conditions plus meowing both groups behaved similarly and spent more time in the dark zone with higher threat levels. CT-longQ27PC mice displayed more anxious behavior compared with CT-shortPC mice in the presence of the ultrasound repellent. The number of mice tested/group is indicated in parentheses in the legend. Statistical significance was evaluated by an unpaired Student t-test with unequal variance (*P ≤ 0.05, **P ≤ 0.01, ***P ≤ 0.001).
Figure 5
Figure 5
CT-longQ27PC mice display cognitive deficits in the Barnes maze with increasing trials and threatening conditions. (A) Schematic of the Barnes maze arena under bright, 1700 lux lighting conditions. The arena was divided into four quadrants (Q1 = escape house, Q2 and Q3 = neighboring quadrants to house and Q4 = opposite quadrant from house) and a 5 cm periphery from wall. Visual cues were placed at each cardinal direction (square at north (N), cross at south (S), triangle at east (E), star at west (W)) on the inner wall of the maze. (B) Heat maps from average search patterns of CT-shortPC (left) and CT-longQ27PC (right) mice on trials 1, 3, 9 and 13. CT-longQ27PC mice spent more time in the periphery and center regions as CT-shortPC mice with subsequent trials. (C) Escape latency durations for each trial are depicted as line graphs for CT-shortPC (white) and CT-longQ27PC (gray) mice under bright 1700 lux lighting conditions. (D) Example escape strategy traces for circling (blue), random (yellow), strategic (orange) and direct (red) strategies. The percentage of CT-shortPC (left) and CT-longQ27PC (right) mice in each trial displaying the different search strategies under bright 1700 lux lighting conditions. CT-shortPC (left) mice showed augmented direct and spatial strategic patterns where CT-longQ27PC (right) exhibited greater random and circling non-strategic patterns. (E) Schematic of the Barnes maze arena under bright, 1700 lux lighting plus a 70 kHz ultrasound repellent conditions. (F) Escape latency durations for each trial are depicted as line graphs for CT-shortPC (white) and CT-longQ27PC (gray) mice under bright, 1700 lux lighting plus a 70 kHz ultrasound repellent conditions. CT-longQ27PC mice showed comparable escape latencies to CT-shortPC mice until trial 10 under bright 1700 lux lighting conditions and trial 3 under 1700 lux lighting with ultrasound repellent, however, escape latencies escalated with increasing trials. The number of mice tested/group is indicated in parentheses in the legend. Statistical significance was evaluated by 2-way ANOVA (*P ≤ 0.05, **P ≤ 0.01).
Figure 6
Figure 6
CT-longQ27PC mice show cognitive impairments in the visual cliff test with increasing trials. (A) Schematic of visual cliff arena which was divided into a safety and cliff zone with black and white checkered floors by a ridge. The mouse started on the ridge and was allowed to choose a zone to reside. (B) Average latencies to the safety zone per trial required to choose a zone for CT-shortPC (white) and CT-longQ27PC (gray) mice under normal, laboratory lighting conditions. All mice chose the safety zone in all trials and showed similar latencies for the first five trials. However, CT-longQ27PC mice demonstrated higher latencies to the safety zone as CT-shortPC mice in later trials 6–9. The number of mice tested/group is indicated in parentheses in the legend. Statistical significance was evaluated by 2-way ANOVA (*P ≤ 0.05).
Figure 7
Figure 7
CT-longQ27PC mice show no sensorimotor deficits on the hotplate and the adhesive removal tests. (A) Schematic of the hotplate apparatus. The mouse was placed on a 32°C warm aluminum plate surrounded by a plexiglass cylinder, which was heated to 42°C with 1°C/min. (B) Average temperature to first paw lick or jump for CT-shortPC (white) and CT-longQ27PC (gray) mice. First licking of paws was observed at ~33°C for both mouse lines, while first jumps were observed at ~37°C. (C) Latencies to first paw lick and jump were similar between CT-shortPC (white) and CT-longQ27PC (gray) mice. (D) Schematic of different colored tape on the left and right paws for the adhesive removal test. (E) Average removal time of tape on left and right paw for CT-shortPC (white) and CT-longQ27PC (gray) mice. (F) Latencies to first contact with tape were similar between CT-shortPC (white) and CT-longQ27PC (gray) mice. No differences in sensorimotor performance were observed between mouse groups for the hotplate and adhesive removal tests. The number of mice tested/group is indicated in parentheses in the legend. Statistical significance was evaluated by an unpaired Student t-test with unequal variance.
Figure 8
Figure 8
CT-longQ27PC mice show defensive escape behavior in the looming test. (A) Schematic of looming test where an expanding black disk on a liquid-crystal display (LCD) monitor represents a looming stimulus from above. The stimulus is triggered when the mouse is in the opposite corner from the house. (B) Average percentage of responding mice to freezing, flight or no response from all five trials to the looming stimulus represented as a whisker box plot. CT-longQ27PC (gray) mice responded with less freezing (12.0 ± 3.8%) and more flight (68.3 ± 6.0%) behavior compared with CT-shortPC (white) controls, whereas CT-shortPC mice responded equally with either freezing (48.0 ± 4.3%) or flight (42.0 ± 3.3%) behavior to the looming stimulus. Both mouse groups showed the same average percentage of unresponsive trials. (C) The response duration per trial of freezing or flight behavior was similar in CT-longQ27PC (gray) and CT-shortPC (white) mice. (D) The percentage of CT-shortPC (white) and CT-longQ27PC (gray) mice responding to either freezing (o) or flight (∆) behavior per trial. A higher percentage of CT-longQ27PC mice sustained flight behavior to the looming stimulus which escalated to 83.3% in trials 4 and 5 compared with CT-shortPC mice, which remained at approximately 30–50% throughout. The total number of CT-longQ27PC mice freezing to the looming stimulus decreased from 25% in trial 1 to 1% in trial 5, whereas CT-shortPC mice remained at 50% in the later trials from 3 to 5. The number of mice tested/group is indicated in parentheses in the legend. Statistical significance was evaluated by an unpaired Student t-test with unequal variance. (*P ≤ 0.05, ***P ≤ 0.001).
Figure 9
Figure 9
CT-longQ27PC mice exhibit augmented Purkinje cell aggregate burden compared with CT-shortPC mice during a late stage of the SCA6 disease. Neuropathological analyses of CT-longQ27PC and CT-shortPC mice at the age of ~13–16 months of age, a similar age that the behavior tests were performed. (A) Example images of the cerebellar PC layer from a CT-longQ27PC mouse detected with the Purkinje cell (PC) specific marker calbindin (magenta, upper image). YFP-tagged CT-longQ27 protein fragments were identified with a GFP antibody (yellow, middle image). Merged image (lower image) shows the colocalization of calbindin and the CT-longQ27 containing aggregates in PC. Arrows indicate PC aggregates. Bar = 20 μm. (B) Average fluorescence intensity of PC aggregation from lobules 2–10 (*P = 0.016) from CT-shortPC (white) and CT-longQ27PC (gray) mice. (C) Average fluorescence intensity of PC aggregation in each lobule (2–10) from CT-shortPC (white) and CT-longQ27PC (gray) mice. P-values for individual lobules: lobule 2, *P = 0.042; lobules 4 and 5, # P = 0.052; lobule 6, *P = 0.049; lobule 8, *P = 0.036; lobule 9, # P = 0.066. PC overexpressing the CT-longQ27 fragments displayed more aggregation than CT-short expressing PC. n = 4 mice/group. Statistical significance was evaluated by an unpaired Student t-test. *P ≤ 0.05; #P ≤ 0.10 trend. AU = arbitrary units.

Similar articles

Cited by

References

    1. Laing, P.A.F. and Harrison, B.J. (2021) Safety learning and the Pavlovian conditioned inhibition of fear in humans: current state and future directions. Neurosci. Biobehav. Rev., 127, 659–674. - PubMed
    1. Bentz, D. and Schiller, D. (2015) Threat processing: models and mechanisms. Wiley Interdiscip. Rev. Cogn. Sci., 6, 427–439. - PubMed
    1. Yang, X., Liu, Q., Zhong, J., Song, R., Zhang, L. and Wang, L. (2020) A simple threat-detection strategy in mice. BMC Biol., 18, 1–11. - PMC - PubMed
    1. Clark, S. (1939) Responses following electrical stimulation of the cerebellar cortex in the normal cat. J. Neurophysiol., 2, 19–36.
    1. Chambers, W.J. (1947) Electrical stimulation of the interior of the cerebellum in the cat. Am. J. Anat., 80, 55–94. - PubMed

Publication types

Substances