. 2022 Aug 25;34(9):3460-3481.
doi: 10.1093/plcell/koac177.

The retrograde signaling regulator ANAC017 recruits the MKK9-MPK3/6, ethylene, and auxin signaling pathways to balance mitochondrial dysfunction with growth

Affiliations

The retrograde signaling regulator ANAC017 recruits the MKK9-MPK3/6, ethylene, and auxin signaling pathways to balance mitochondrial dysfunction with growth

Cunman He et al. Plant Cell. .

Abstract

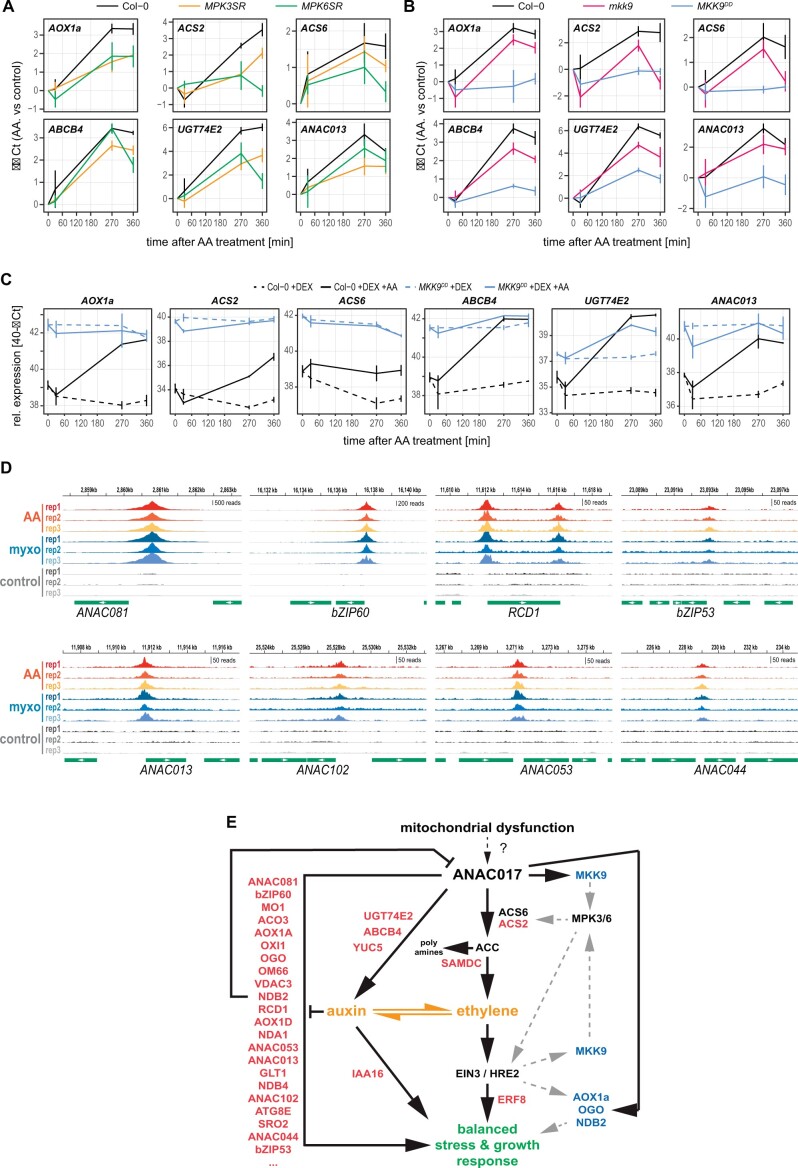
In plant cells, mitochondria are ideally positioned to sense and balance changes in energy metabolism in response to changing environmental conditions. Retrograde signaling from mitochondria to the nucleus is crucial for adjusting the required transcriptional responses. We show that ANAC017, the master regulator of mitochondrial stress, directly recruits a signaling cascade involving the plant hormones ethylene and auxin as well as the MAP KINASE KINASE (MKK) 9-MAP KINASE (MPK) 3/6 pathway in Arabidopsis thaliana. Chromatin immunoprecipitation followed by sequencing and overexpression demonstrated that ANAC017 directly regulates several genes of the ethylene and auxin pathways, including MKK9, 1-AMINO-CYCLOPROPANE-1-CARBOXYLATE SYNTHASE 2, and YUCCA 5, in addition to genes encoding transcription factors regulating plant growth and stress responses such as BASIC REGION/LEUCINE ZIPPER MOTIF (bZIP) 60, bZIP53, ANAC081/ATAF2, and RADICAL-INDUCED CELL DEATH1. A time-resolved RNA-seq experiment established that ethylene signaling precedes the stimulation of auxin signaling in the mitochondrial stress response, with a large part of the transcriptional regulation dependent on ETHYLENE-INSENSITIVE 3. These results were confirmed by mutant analyses. Our findings identify the molecular components controlled by ANAC017, which integrates the primary stress responses to mitochondrial dysfunction with whole plant growth via the activation of regulatory and partly antagonistic feedback loops.


Figures

Figure 1
Figure 1
A co-expression network of AOX1A involves ethylene signaling-related genes. A, Co-expression network analysis of AOX1A with the CoNekT tool kit (Proost and Mutwil, 2018) identified 12 genes with highly correlated gene expression patterns. In the resulting network, two genes close to AOX1A were related to ethylene signaling, that is, the ERF ERF71/HRE2 and OGO/AT5G43450. Edge color represents the Pearson correlation coefficient (PCC). Genes of the MDS are represented by orange circles (De Clercq et al., 2013). B, HRE2 binds to the promoters of AOX1A and OGO. Shown are genome browser views of the ChIP-seq read coverage at the promoters of the two genes. ChIP-seq data were downloaded from the NCBI SRA database (SRR8234099) and aligned to the TAIR10 Arabidopsis genome release. Both genes were among the significant peak calls, as identified previously by (Lee and Bailey-Serres, 2019). C, Heatmap showing induced expression of AOX1A, OGO, and HRE2 in various experiments involving ethylene-dependent signaling (hypoxia, anoxia), altering ethylene tissue-concentrations (ethylene gas, AgNO3) or induce mitochondrial stress (AA, oligomycin). Publicly available gene expression data were retrieved using the Genevestigator platform, and data set IDs are indicated (Hruz et al., 2008).
Figure 2
Figure 2
Induced expression of OGO by ACC, senescence, and submergence. A, OGO expression is upregulated by ACC and AA treatment. Left: proOGO-GUS reporter lines were treated with AA to induce mitochondrial dysfunction or ACC to increase ethylene concentrations in tissues. For both treatments, increased GUS activity was detected after 4 h and 12 h of staining, respectively. Shown are representative images of three biological replicates (separate experiments). Right: Increased expression of OGO after AA and ACC treatments in wild type Col-0 was also quantified by RT–qPCR. AOX1A and EBF2 were used as known response genes for the treatments, respectively. Seedlings were grown on plates for 10 days, sprayed with 50-µM AA or varying ACC concentrations as indicated, and harvested 3-h post treatment. Shown are the mean ± se. Asterisks indicate statistically significant differences (P < 0.05, one-way (AOX1A, OGO) and two-way (EBF2, OGO) ANOVA, n = 3) from control (water) treatment. B, The expression of OGO is induced during age-dependent senescence in leaves. Top: GUS activity in rosette leaves of a representative proOGO-GUS reporter line. Leaves are numbered by the sequence of their occurrence through development. GUS staining was highest in the oldest, senescing leaves and not detectable in young leaves. Bottom: OGO expression was also quantified by RT–qPCR in wild-type Col-0 for the indicated leaf developmental stages. The expression of the senescence marker genes SENESCENCE-RELATED GENE 1 (SRG1), PHEOPHORBIDE A OXYGENASE (PAO), and RIBULOSE BISPHOSPHATE CARBOXYLASE SMALL CHAIN 1A (RBCS1A) was also determined. Shown are the means of 40−DCt values ± se. Asterisks indicate statistically significant differences (P < 0.05, one-way ANOVA, n = 3) from youngest leaf #20. C, OGO promoter activity in reporter lines was also increased by dark-induced senescence. Top: Plants were kept in the dark for up to 7 days as indicated before GUS staining. Bottom: gene expression was quantified by RT–qPCR as described in (B). D, The mutant lines for OGO (ogo-1) and EIN3 (ein3-1) showed a similar reduction in submergence tolerance. Shown are representative images (left), chlorophyll concentrations and maximum quantum efficiency of photosystem II (Fv/Fm) (middle panels) and the expression of OGO in the wild-type (Col-0), ein3-1, and ogo-1 mutant lines (right) before submergence (control), after 4 and 10 days submergence, and 3 days after desubmergence as indicated. Graphs shown the mean ± se. Asterisks indicate statistically significant differences (*P < 0.05, one-way ANOVA, n = 3, except for Fv/Fm with n = 5) from the control.
Figure 3
Figure 3
Impaired ethylene-signaling in the ein3-1 mutant attenuates the transcriptional response to mitochondrial dysfunction. A time course RNA-seq experiment was performed by treating Col-0, ein3-1 mutant, and ogo-1 mutant lines with AA to induced mitochondrial stress or with water as a control treatment. Samples of three biological replicates were taken at the indicated timepoints for RNA-seq analysis. A, UpSet plot representation of overlaps in DEGs (|log2(fold change AA versus control)| > 1, FDR <0.05) for the comparisons of AA and control treatments at the same time point (Conway et al., 2017). The vertical bar chart gives the number of DEGs in the three genotypes at the different time points and the horizontal bar chart the number of overlapping DEGs in the intersects indicated by connected dots. Only the 15 largest intersects are shown. B, GO terms enriched (P < 0.001 after Bonferroni correction) for the ogo-1-specific DEGs in the four largest intersects (indicated by blue, horizontal bars) as shown in (A). C, A self-organism maps algorithm identified six clusters of DEGs with shared expression patterns across the three genotypes and time points. D, Enrichment of EIN3 binding sites in the promoters of genes in clusters 1–6. The gene lists for the six clusters were cross-referenced with a list of identified promoter binding sites for EIN3 (Chang et al., 2013). Enrichment was calculated by a hypergeometric test with asterisks indicating statistical significance (*P < 0.05, **P < 0.01, ***P < 0.001). E and F, Expression profiles in the AA and control treatments across Col-0, ein3-1, and ogo-1 for the MDS genes (De Clercq et al., 2013). These genes were included in cluster 6 except for OM66 in cluster 5. G, Enriched GO terms (P <0.001 after Bonferroni correction) for DEGs in clusters 5 and 6, respectively. Genes related to ethylene signaling in cluster 5 (magenta) or auxin signaling in cluster 6 (turquoise) are listed. Circle sizes represent the number of genes included in the GO term and circle color the significance of enrichment as indicated.
Figure 4
Figure 4
DREM analysis of the response to AA in wild-type and ein3-1. DREM modeling reveals differences in the sequence of regulatory events that govern the transcriptional response to mitochondrial stress induced by AA in wild-type (Col-0), ein3-1, and ogo-1. DREM models for Col-0 (A), ein3-1 (B), and ogo-1 (C) show groups of co-expressed genes in 16, 11, and 14 paths, respectively, with TFs underlying the separation of genes into different paths indicated for major furcation events. Paths emanating from the three primary paths are colored in shades of red, blue, or green. The y-axis gives the average expression levels of genes in the paths at the indicated time points after AA treatment, and node areas are proportional to the standard deviation of the distribution of genes associated with them. Number of genes in each path and a summary of enriched GO terms (P <0.001 after Bonferroni correction) are indicated on the right (see Supplemental Data Sets S5–S13 for all genes, TFs associated with regulatory events and details for GO term enrichment for all paths).
Figure 5
Figure 5
Changes in expression of genes associated with ethylene- and auxin signaling or homeostasis. From the list of DEGs responsive to AA treatment, those related to ethylene or auxin biosynthesis, transport, conjugation, signaling, or response were identified and manually curated based on their annotations in TAIR10, GO term lists, and from recent literature reviews (Supplemental Data Sets S11 and S12; Lavy and Estelle, 2016; Dubois et al., 2018; Casanova-Saez et al., 2021; Pattyn et al., 2021). A heatmap of their expression over the time course experiments is shown, with gene names colored according to their functions. Genes responding early to treatment are at the top of each heatmap, while late-responsive genes are at the bottom.
Figure 6
Figure 6
ANAC017 binds to the promoters of several ethylene- and auxin-related genes. A, Binding of ANAC017 to the promoters of target genes was determined by ChIP-seq experiments using a transgenic line expressing a GFP-ANAC017 fusion protein under the control of the native ANAC017 promoter. ChIP-seq was performed after induction of mitochondrial stress by spraying with AA or MT, or with water as a control treatment. Using MACS2 software for peak detection (Gaspar, 2018), the 200 most significant target genes for the AA treatment, which had an enrichment factor of at least above 7 and a −log10(q) above 42, were determined (Supplemental Data Set S13). Of these genes, 178 were also highly significantly enriched (−log10(q) <5) under MT treatment (Supplemental Data Set S13). Shown are read coverages around the promoters of associated genes for three biological replicates. AOX1A is also given for comparison as a known ANAC017 target (De Clercq et al., 2013). Green boxes indicate the full-length cDNA location and orientation at gene loci. B. Expression levels of ANAC017 target genes in two ANAC017 overexpression lines (ANAC017OE3, OE; ANAC017ΔTMOE3, ΔTM). Data were retrieved from a previously published experiment (Meng et al., 2019). C. Regulation of mitochondrial stress-responsive genes by ANAC017 and EIN3. The Venn diagram shows the overlap in the AA-responsive genes in clusters 5 and 6 (Figure 3C) whose promoters bind ANAC017 or EIN3. The target gene list of EIN3 was retrieved from a previously published ChIP-seq experiment (Chang et al., 2013). Relevant genes regulated by both TFs are indicated.
Figure 7
Figure 7
Co-ordination of retrograde signaling and growth by ANAC017, MKK9, and MPK3/6. MPK3, MPK6, and MKK9 are regulators of the mitochondrial dysfunction response (A, B, and C). The induction of genes after AA treatment is attenuated in mpk3, mpk6 (A), and mkk9 (B) mutant lines, while the apparent diminished response of these genes in the MKK9DD line (B) is based on their already elevated expression due to induction by DEX, confirming a MKK9-dependent induction of these genes (C). Seedlings were pretreated with NA-PP1 to deactivate MPK3/MPK6 function (A) or DEX to induce MKK9DD expression (B and C) 12 h before subsequent treatment with AA or water. Samples were then taken at the indicated timepoints for RNA extraction and RT–qPCR. Given are the means of the ΔΔCt ± se values (AA versus control) (B) and relative transcript abundance expressed as means of 40−ΔCt ± se values (C) of three biological replicates. D, ANAC017 directly binds to the promoters of TFs involved in the regulation of growth, senescence and stress responses. Shown are genome browser representations of ChIP-seq reads derived from a transgenic line expressing a GFP-ANAC017 fusion protein after treatment with AA, MT and water (control). Green bars indicate the position and orientation of the full-length cDNA. E, Model for the integration of retrograde signaling with plant growth by the direct action of ANAC017, an MKK9–MPK3/6 signaling cascade, and the auxin/ethylene interaction. While ANAC017 directly induces the expression of stress genes such as AOX1A, NDB2, or OGO, it also activates in parallel components of the ethylene (MKK9, ACS2, ERF8, SAMDC) and auxin (YUC5, UGT74E2, ABCB4, IAA16) pathways. EIN3 also targets AOX1A, NDB2, and MKK9, allowing for dual regulation by the two TFs, while HRE2 binds to the promoters of AOX1A and OGO. In addition, the targeting of other TF genes such as ANAC081, bZIP60, and RCD1 by ANAC017 allows for the activation of further transcriptional cascades to fine-tune and balance the acute stress response with plant growth and also a negative feedback loop via RCD1. Genes associated with steps in the pathway and directly targeted by ANAC017 are highlighted in red (ordered by the statistical significance; Supplemental Data Set S13), while genes dually targeted by ANAC017 and EIN3 or HRE2 are highlighted in blue. Reciprocal interaction of ethylene and auxin is indicated by orange arrows. See text for details.

Similar articles

Cited by

References

    1. Berkowitz O, Xu Y, Liew LC, Wang Y, Zhu Y, Hurgobin B, Lewsey MG, Whelan J (2021) RNA-seq analysis of laser microdissected Arabidopsis thaliana leaf epidermis, mesophyll and vasculature defines tissue-specific transcriptional responses to multiple stress treatments. Plant J 107: 938–955 - PubMed
    1. Bindea G, Mlecnik B, Hackl H, Charoentong P, Tosolini M, Kirilovsky A, Fridman WH, Pages F, Trajanoski Z, Galon J (2009) ClueGO: a Cytoscape plug-in to decipher functionally grouped gene ontology and pathway annotation networks. Bioinformatics 25: 1091–1093 - PMC - PubMed
    1. Binder BM, Walker JM, Gagne JM, Emborg TJ, Hemmann G, Bleecker AB, Vierstra RD (2007) The Arabidopsis EIN3 binding F-Box proteins EBF1 and EBF2 have distinct but overlapping roles in ethylene signaling. Plant Cell 19: 509–523 - PMC - PubMed
    1. Bowling SA, Guo A, Cao H, Gordon AS, Klessig DF, Dong X (1994) A mutation in Arabidopsis that leads to constitutive expression of systemic acquired resistance. Plant Cell 6: 1845–1857 - PMC - PubMed
    1. Braam J (2005) In touch: plant responses to mechanical stimuli. New Phytol 165: 373–389 - PubMed

Publication types