

doi: 10.1093/ije/dyac127.
Cohort Profile: The National Institute for Health Research Health Informatics Collaborative: Hepatitis B Virus (NIHR HIC HBV) research dataset
Affiliations
- PMID: 35708657
- PMCID: PMC9908046
- DOI: 10.1093/ije/dyac127
Item in Clipboard
Cohort Profile: The National Institute for Health Research Health Informatics Collaborative: Hepatitis B Virus (NIHR HIC HBV) research dataset
Int J Epidemiol.
.
No abstract available
Figures
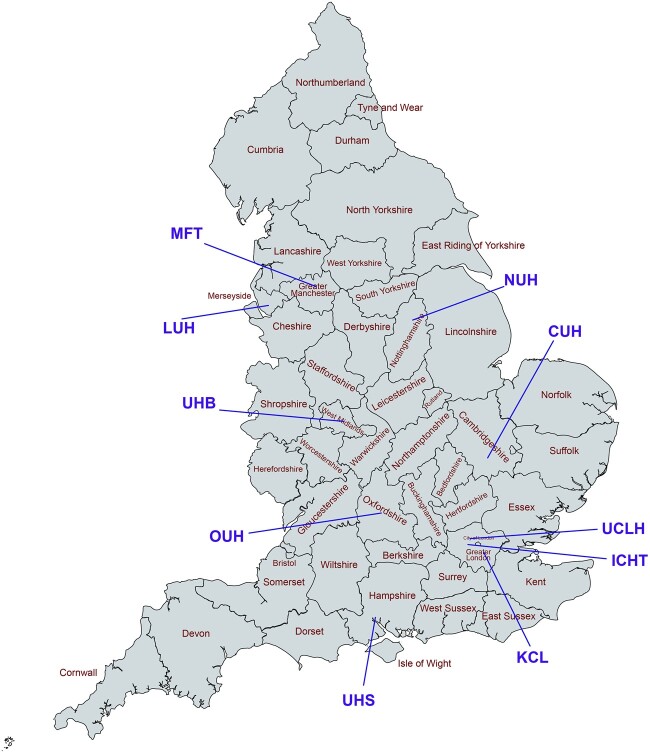
Locations of the 10 National Health Service (NHS) Trusts participating in the National Institute for Health Research (NIHR) Health Informatics Collaborative (HIC) viral hepatitis theme up to February 2022. CUH, Cambridge University Hospitals NHS Foundation Trust; ICHT, Imperial College Healthcare NHS Trust; KCL, King's College Hospital NHS Foundation Trust; LUH, Liverpool University Hospitals NHS Foundation Trust; MFT, Manchester University NHS Foundation Trust; NUH, Nottingham University Hospitals NHS Trust; OUH, Oxford University Hospitals NHS Foundation Trust; UCLH, University College London Hospitals NHS Foundation Trust; UHB, University Hospitals Birmingham NHS Foundation Trust; UHS, University Hospital Southampton NHS Foundation Trust. CUH, ICHT, KCL, OUH and UCLH were the five NHS Trusts initially included in the NIHR HIC viral hepatitis theme, with LUH, MFT, NUH, UHB and UHS joining more recently. The map was created using [https://www.mapchart.net/ ]
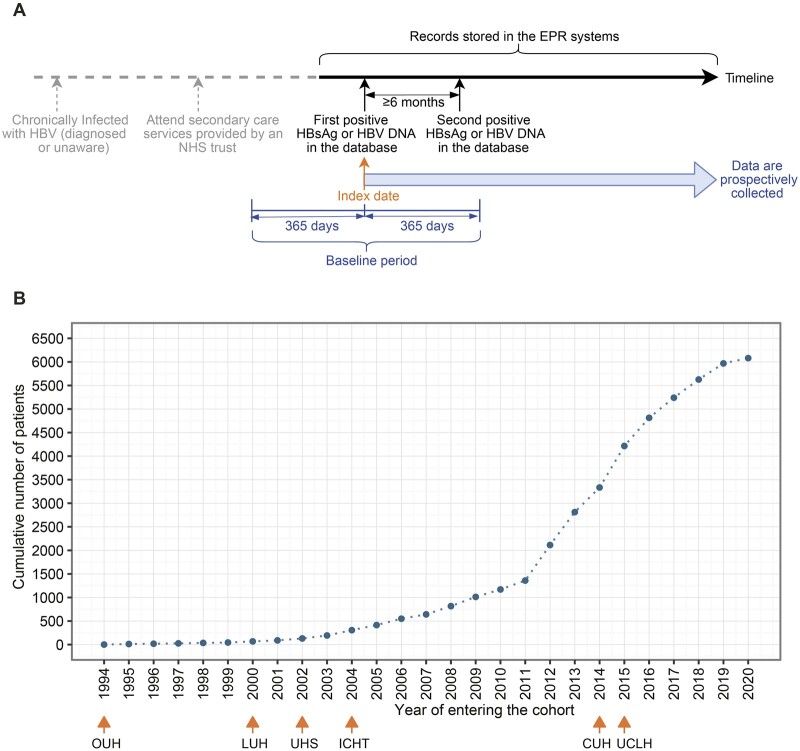
Index date and number of patients in the National Institute for Health Research (NIHR) Health Informatics Collaborative (HIC) hepatitis B virus dataset. (A) The time line and index date definition for an exemplar patient. (B) Cumulative numbers of chronic hepatitis B virus patients entering the cohort over time. In panel A, all data collected after the index date are added into the dataset, and those data before index date are also included if they are available in EPR systems. The second positive test could be within 365 days after the index date (within baseline period) or could be >365 days after the index date (outside of the baseline period). Note that the second positive test is not required for a contributing site to include patients for data submission after June 2021. In panel B, for the six sites which had submitted data, the earliest year of the included data at each site is marked. CUH, Cambridge University Hospitals NHS Foundation Trust; ICHT, Imperial College Healthcare NHS Trust; LUH, Liverpool University Hospitals NHS Foundation Trust; OUH, Oxford University Hospitals NHS Foundation Trust; UCLH, University College London Hospitals NHS Foundation Trust; UHS, University Hospital Southampton NHS Foundation Trust; EPR, electronic patient record; HBsAg, hepatitis B surface antigen; HBV, hepatitis B virus; DNA, deoxyribonucleic acid; NHS, National Health Service
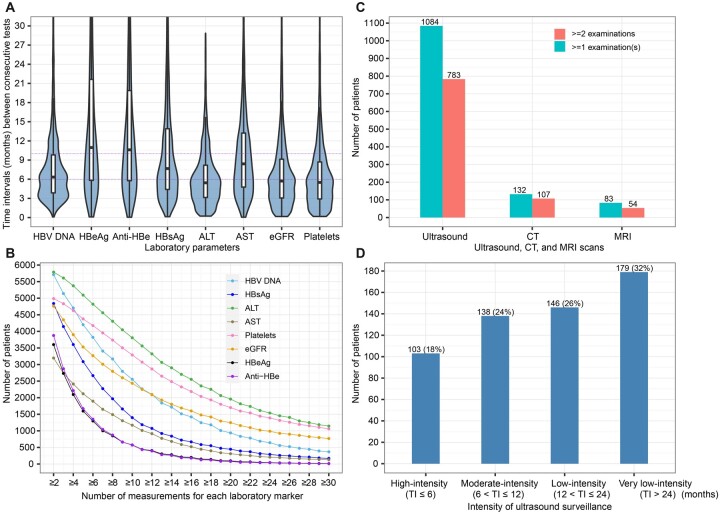
Follow-up frequency and longitudinal data availability. (A) Time intervals (months) between two consecutive tests within patients of hepatitis B virus serological and virological biomarkers, liver biochemistry parameters and renal function markers. (B) Numbers of patients who had longitudinal data (i.e. ≥ two measurements) of laboratory markers [hepatitis B virus deoxyribonucleic acid (HBV DNA), hepatitis B surface antigen (HBsAg), hepatitis B e antigen (HBeAg), antibody to HBeAg (Anti-HBe), alanine aminotransferase (ALT), aspartate aminotransferase (AST), estimated glomerular filtration rate (eGFR), platelets] during the follow-up period. (C) Patients with ultrasound, computed tomography (CT), or magnetic resonance imaging (MRI) surveillance data with various numbers of examinations. (D) Patients with differing intensity of ultrasound surveillance for those who had two or more ultrasound scans. In panel A, mean value of time intervals between every two consecutive tests for each patient was calculated, then the violin plot and boxplot were drawn based on these mean values with outliers (the observations below the 1st percentile and the observations above the 99th percentile) removed. Boxplots indicate the median and quartiles with whiskers reaching up to 1.5 times the interquartile range. The violin plot outlines illustrate kernel probability density, i.e. the width of the blue shaded area represents the proportion of the data located there. Data beyond 30 months were not shown in the plots. In panel B, the x-axis indicates the number of measurements for patients who had longitudinal data (i.e., two or more measurements) on a test. TI, time interval
References
-
- World Health Organization. Global Hepatitis Report 2017. Geneva: WHO, 2017.
-
- World Health Organization. Global Health Sector Strategy on Viral Hepatitis, 2016–2021: Towards Ending Viral Hepatitis. Geneva: WHO, 2021. https://apps.who.int/iris/handle/10665/246177 (12 November 2021, date last accessed).
-
- Campbell C, Wang T, Barnes E, Matthews PC. Baseline characteristics of a large multi-site chronic HBV electronic health record-based cohort in the UK. medRxiv 2021, Oct 25; doi.org/10.1101/2021.10.21.21265205. Preprint, not peer reviewed.
Publication types
MeSH terms
Substances
Grants and funding
LinkOut - more resources
Full Text Sources
Medical
