. 2022 Aug 1;140(8):763-770.
doi: 10.1001/jamaophthalmol.2022.1946.

Changes in Optic Nerve Head and Retinal Morphology During Spaceflight and Acute Fluid Shift Reversal

Affiliations

Changes in Optic Nerve Head and Retinal Morphology During Spaceflight and Acute Fluid Shift Reversal

Laura P Pardon et al. JAMA Ophthalmol. .

Erratum in

  • Correction to Data Points in Figure.
    [No authors listed] [No authors listed] JAMA Ophthalmol. 2022 Sep 1;140(9):912. doi: 10.1001/jamaophthalmol.2022.3302. JAMA Ophthalmol. 2022. PMID: 35951337 Free PMC article. No abstract available.

Abstract

Importance: Countermeasures that reverse the headward fluid shift experienced in weightlessness have the potential to mitigate spaceflight-associated neuro-ocular syndrome. This study investigated whether use of the countermeasure lower-body negative pressure during spaceflight was associated with changes in ocular structure.

Objective: To determine whether changes to the optic nerve head and retina during spaceflight can be mitigated by brief in-flight application of 25-mm Hg lower-body negative pressure.

Design, setting, and participants: In the National Aeronautics and Space Administration's "Fluid Shifts Study," a prospective cohort study, optical coherence tomography scans of the optic nerve head and macula were obtained from US and international crew members before flight, in-flight, and up to 180 days after return to Earth. In-flight scans were obtained both under normal weightless conditions and 10 to 20 minutes into lower-body negative pressure exposure. Preflight and postflight data were collected in the seated, supine, and head-down tilt postures. Crew members completed 6- to 12-month missions that took place on the International Space Station. Data were analyzed from 2016 to 2021.

Interventions or exposures: Spaceflight and lower-body negative pressure.

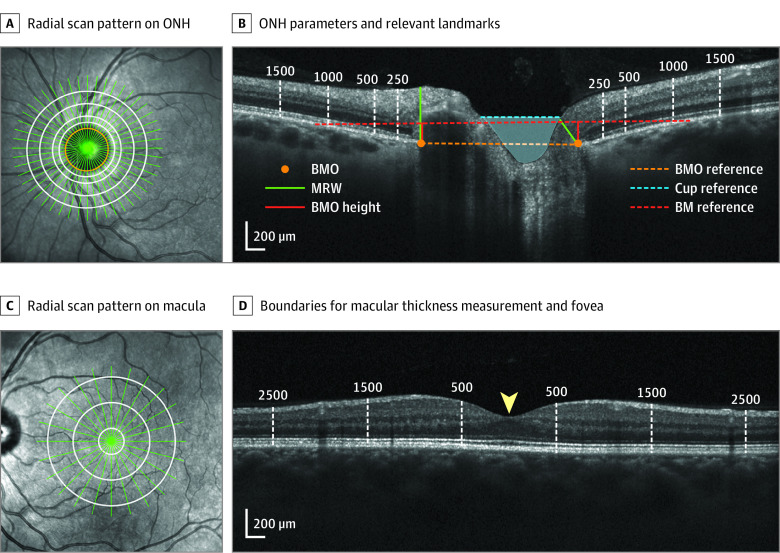
Main outcomes and measures: Changes in minimum rim width, optic cup volume, Bruch membrane opening height, peripapillary total retinal thickness, and macular thickness.

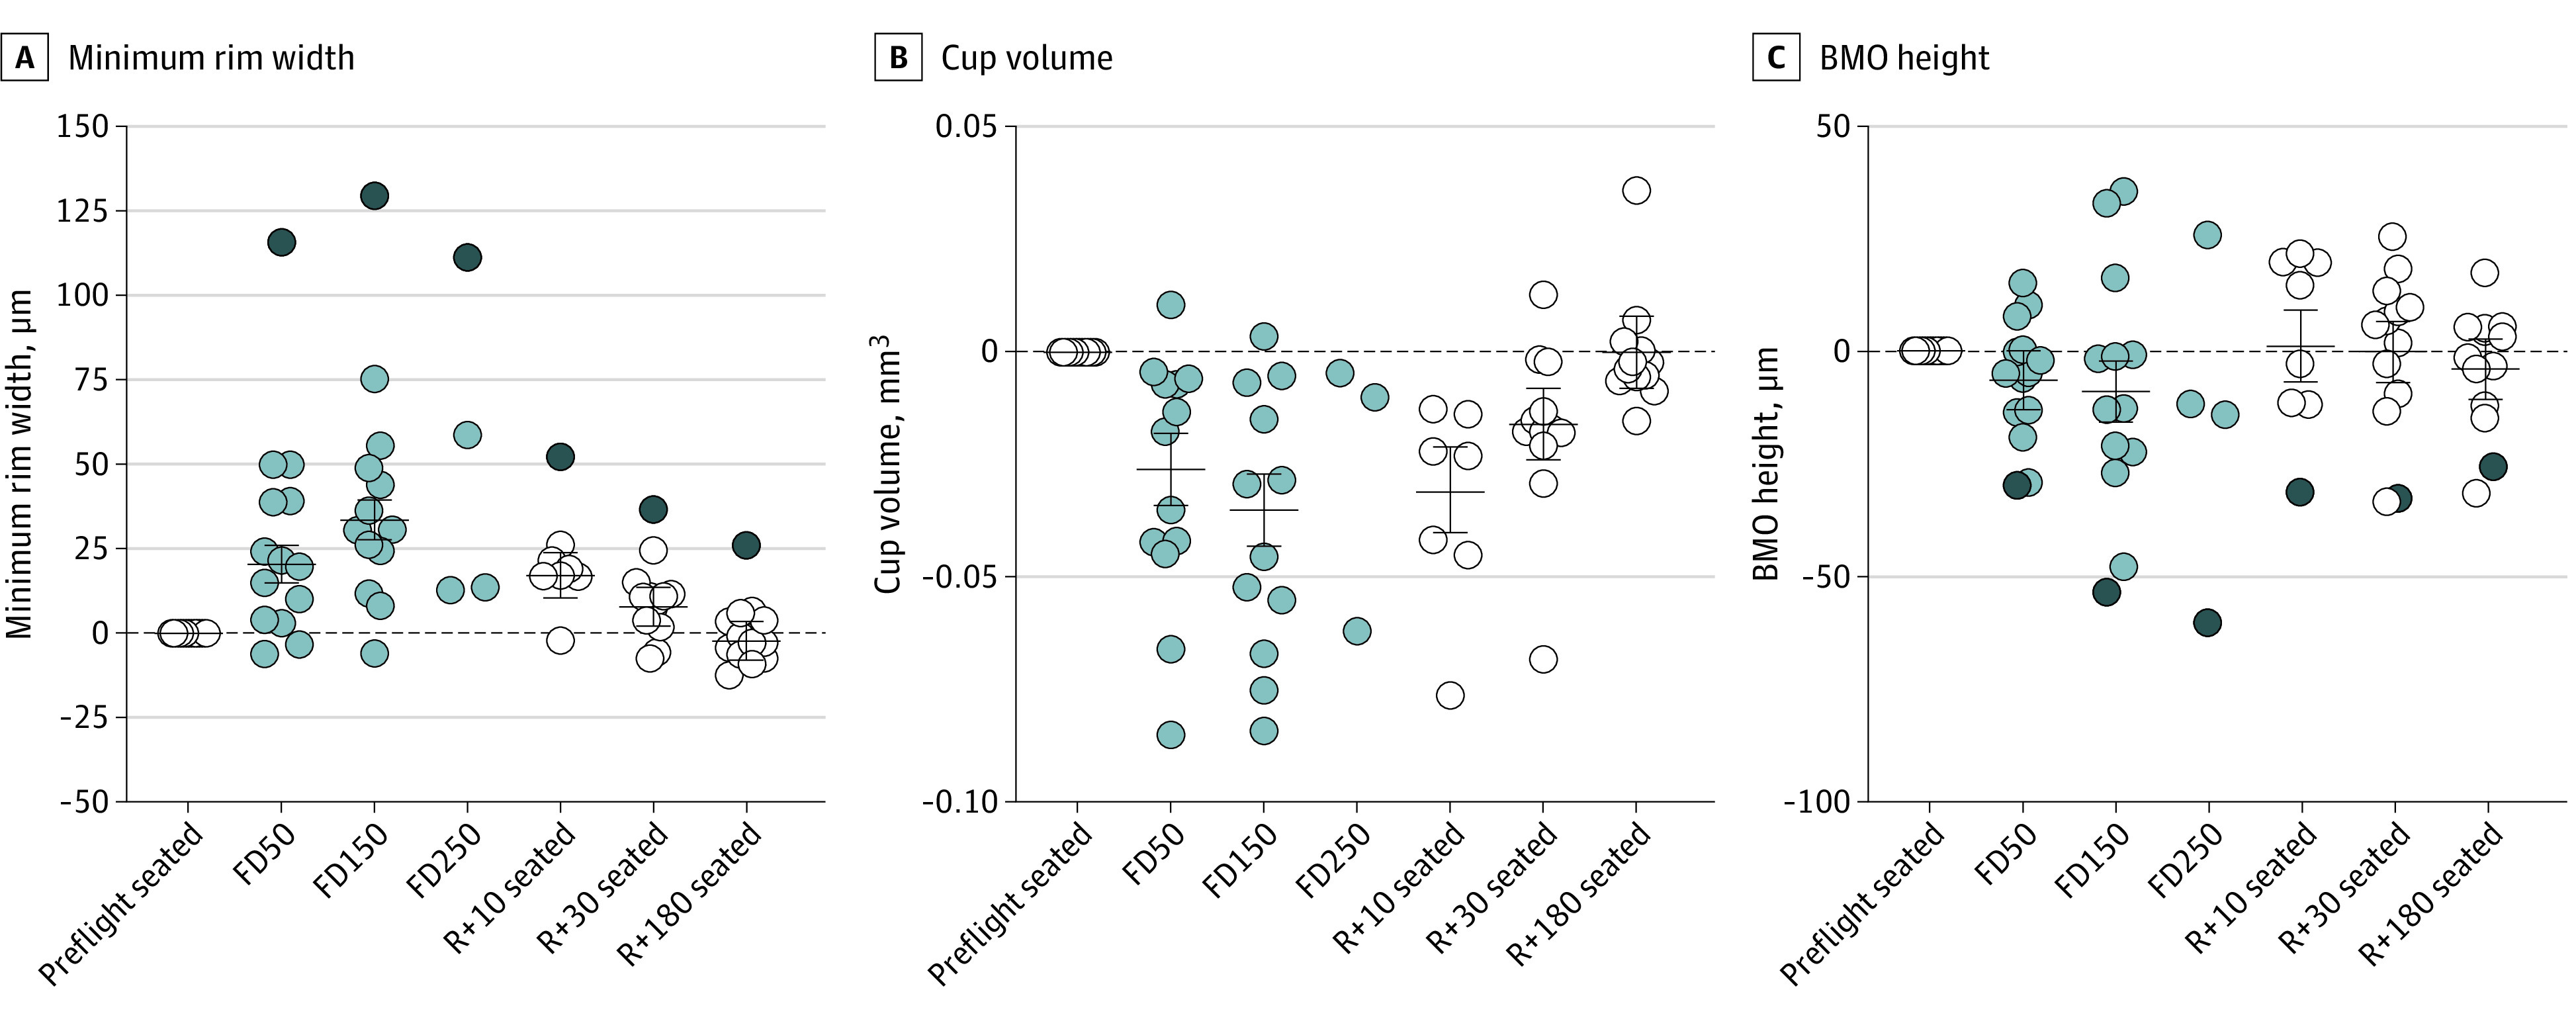
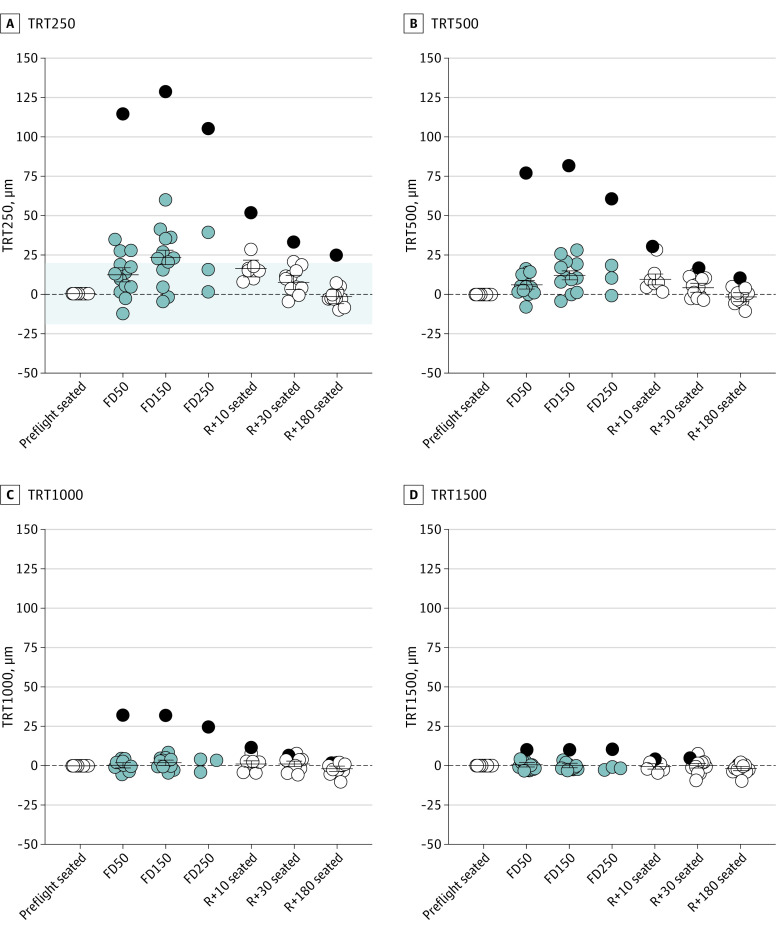
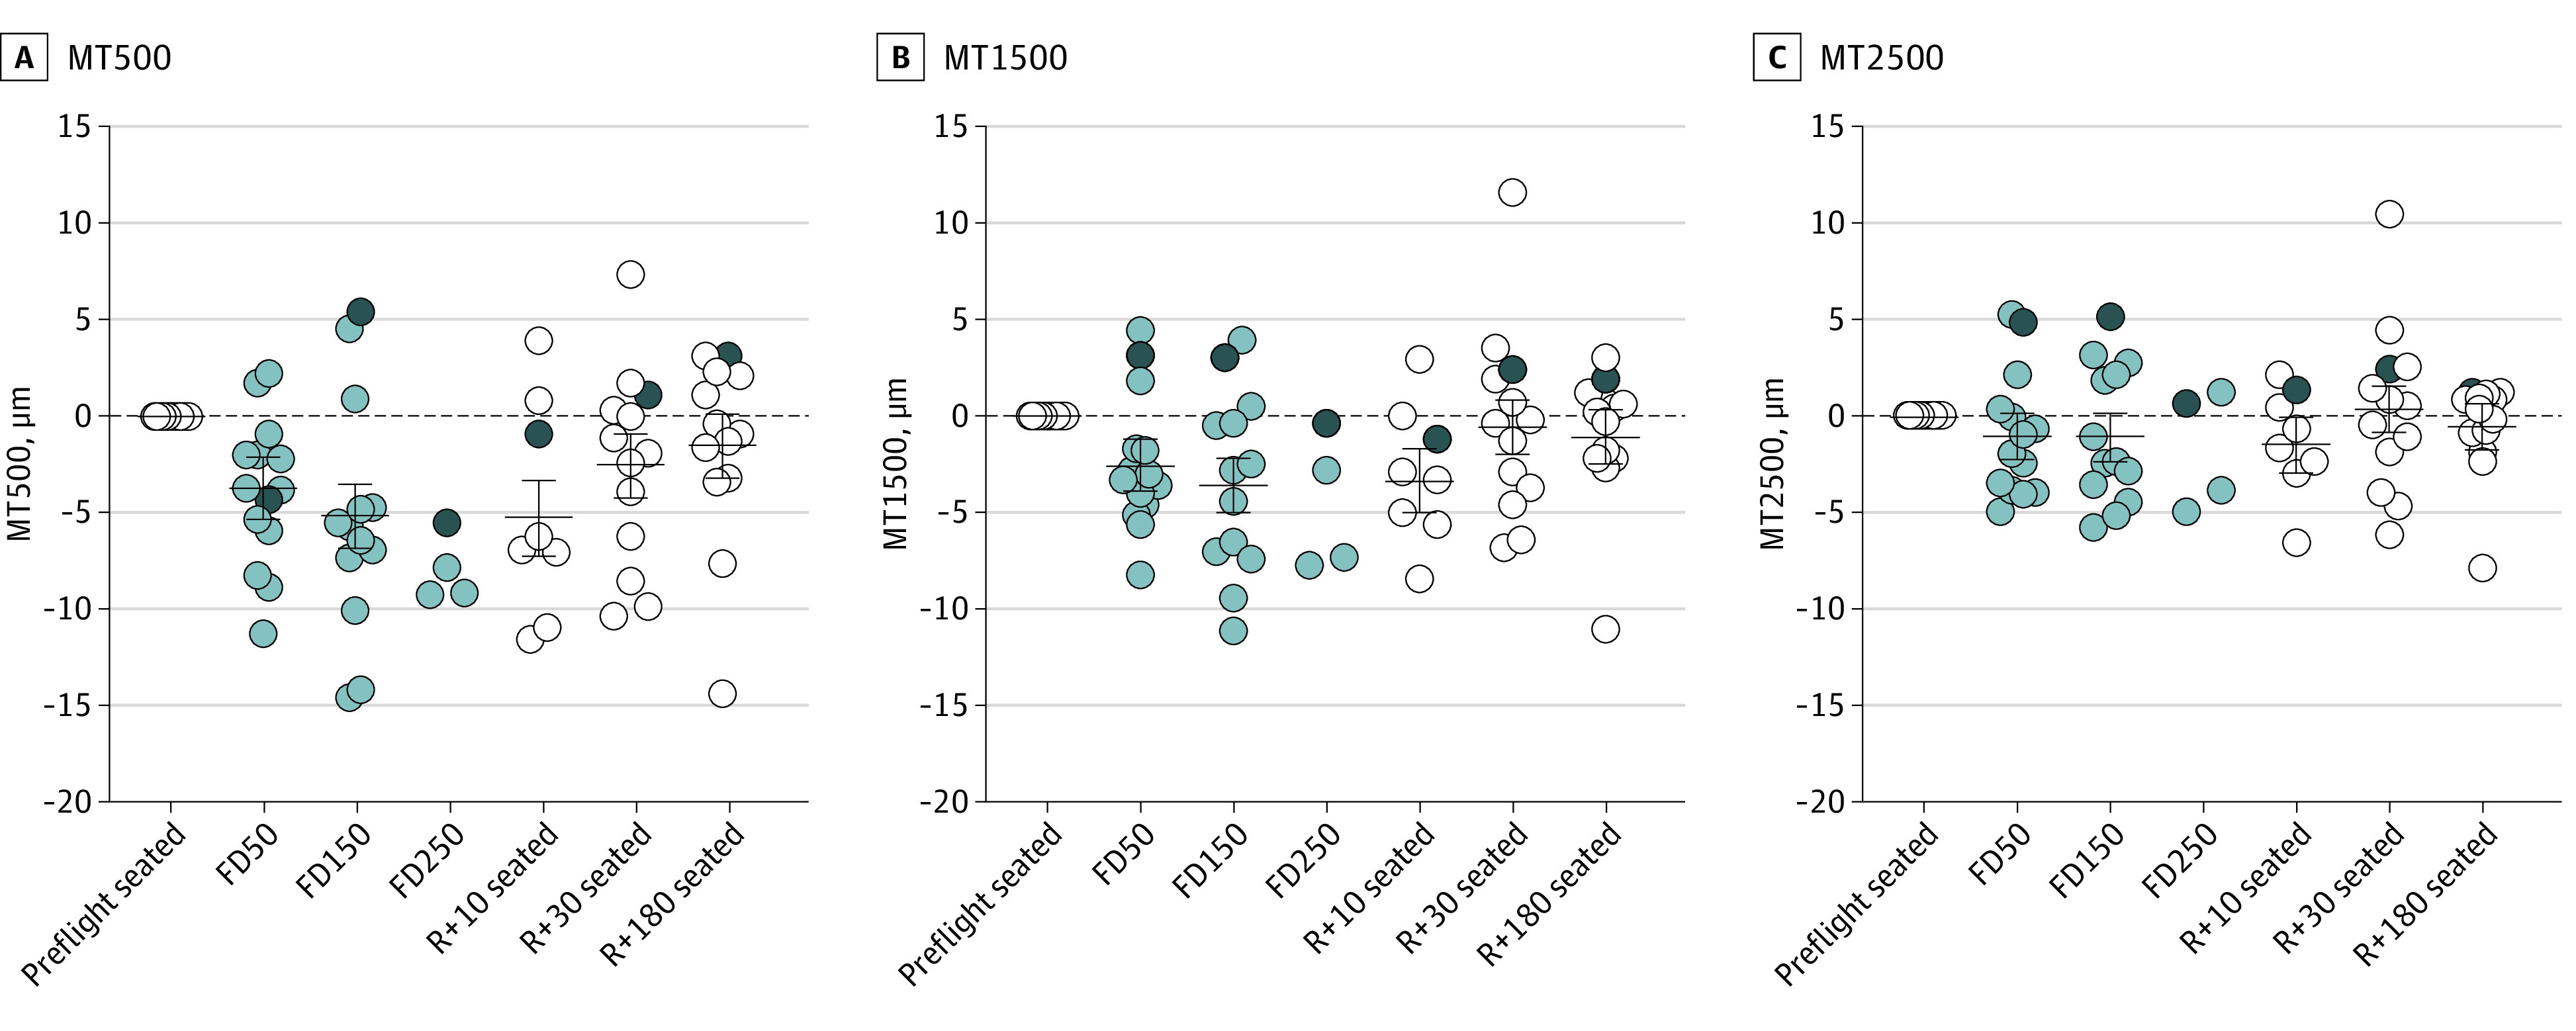
Results: Mean (SD) flight duration for the 14 crew members (mean [SD] age, 45 [6] years; 11 male crew members [79%]) was 214 (72) days. Ocular changes on flight day 150, as compared with preflight seated, included an increase in minimum rim width (33.8 μm; 95% CI, 27.9-39.7 μm; P < .001), decrease in cup volume (0.038 mm3; 95% CI, 0.030-0.046 mm3; P < .001), posterior displacement of Bruch membrane opening (-9.0 μm; 95% CI, -15.7 to -2.2 μm; P = .009), and decrease in macular thickness (fovea to 500 μm, 5.1 μm; 95% CI, 3.5-6.8 μm; P < .001). Brief exposure to lower-body negative pressure did not affect these parameters.

Conclusions and relevance: Results of this cohort study suggest that peripapillary tissue thickening, decreased cup volume, and mild central macular thinning were associated with long-duration spaceflight. Acute exposure to 25-mm Hg lower-body negative pressure did not alter optic nerve head or retinal morphology, suggesting that longer durations of a fluid shift reversal may be needed to mitigate spaceflight-induced changes and/or other factors are involved.


Conflict of interest statement

Conflict of Interest Disclosures: Drs Macias, Ebert, and Stenger reported receiving grants from the National Aeronautics and Space Administration during the conduct of the study. Dr Hargens reported receiving grants from University of California San Diego and a grant supporting the investigation of self-generated lower-body negative pressure for deep space missions during the conduct of the study. No other disclosures were reported.

Figures

Figure 1.
Figure 1.. Optic Nerve Head (ONH) and Retinal Optical Coherence Tomography Parameters
A, 30° Infrared image showing a radial scan pattern (green) centered on the ONH, best-fit Bruch membrane opening (BMO) ellipse (orange), and concentric ellipses forming the boundaries for total retinal thickness (TRT) measurement (white). B, Radial B-scan illustrating ONH parameters and relevant landmarks, including BMO, minimum rim width (MRW), BM reference, BMO height, BMO reference, cup reference, optic cup (blue shaded region), and the boundaries for TRT measurement (labeled white dashed lines). C, 30° Infrared image illustrating a radial scan pattern (green) centered on the macula and boundaries for macular thickness measurements (white). D, Radial B-scan showing the boundaries for macular thickness measurement (labeled white dashed lines) and fovea (yellow arrowhead).
Figure 2.
Figure 2.. Changes in Optic Nerve Head Morphology During Spaceflight
A, Minimum rim width increased on flight day (FD)50 and FD150 and gradually recovered after return to Earth, with no difference from the preflight baseline by return to Earth (R) + 180. B, Cup volume followed a similar timeline as minimum rim width, initially decreasing on FD50 and returning to baseline by R + 180. C, Bruch membrane opening (BMO) height was significantly reduced (ie, posteriorly displaced) on FD150 but did not differ from baseline at any other time point. Circles show all individual subject data representing data obtained on Earth (white), data obtained during spaceflight (light gray), and the participant with Frisén grade 1 disc edema (dark gray); this individual did not have a detectable optic cup and was therefore excluded from the cup volume analysis. Horizontal bars represent the estimated marginal mean values across participants, and error bars represent the 95% CIs. P values for the change relative to the preflight seated baseline value are provided in eTable 1 in the Supplement. Statistics were not performed on FD250 data owing to the small sample size (n = 4).
Figure 3.
Figure 3.. Changes in Peripapillary Total Retinal Thickness (TRT) During Spaceflight
TRT250 (A) and TRT500 (B) increased on flight day (FD) 50 and FD150 and did not return to preflight baseline values until return to Earth (R) + 180. C, TRT1000 was only significantly increased on FD150 and was slightly reduced relative to the preflight seated baseline on R + 180. D, TRT1500 did not increase during spaceflight and was also slightly reduced relative to baseline on R + 180. Circles show all individual subject data representing data obtained on Earth (white), data obtained during spaceflight (light gray), and the participant with Frisén grade 1 disc edema (dark gray). Horizontal bars represent the estimated marginal mean values across participants, and error bars represent the 95% CIs. The shaded area in panel A represents the predefined range of normal day-to-day variation in TRT250 (±19.4) μm. P values for the change relative to the preflight seated baseline value are provided in eTable 1 in the Supplement. Statistics were not performed on FD250 data owing to the small sample size (n = 4). TRT250 indicates TRT from BMO to 250 μm; TRT500, TRT from 250 to 500 μm; TRT1000, TRT from 500 to 1000 μm; TRT1500, TRT from 1000 to 1500 μm.
Figure 4.
Figure 4.. Changes in Macular Thickness During Spaceflight
A, Macular thickness (MT) 500 μm decreased on flight day (FD) 50 and FD150, and it did not return to preflight baseline values until return to Earth (R) + 180. B, MT1500 also decreased on FD50 and FD150 but returned to baseline by R + 30. C, There were no significant changes in MT2500 during or after spaceflight. Circles show all individual subject data representing data obtained on Earth (white), data obtained during spaceflight (light gray), and the participant with Frisén grade 1 disc edema (dark gray). Horizontal bars represent the estimated marginal mean values across participants, and error bars represent the 95% CI. P values for the change relative to the preflight seated baseline value are provided in eTable 1 in the Supplement. Statistics were not performed on FD250 data owing to the small sample size (n = 4). MT500 indicates MT from the fovea to 500 μm; MT1500, MT from 500 to 1500 μm; MT2500, MT from 1500 to 2500 μm.

Comment in

References

    1. Macias BR, Patel NB, Gibson CR, et al. . Association of long-duration spaceflight with anterior and posterior ocular structure changes in astronauts and their recovery. JAMA Ophthalmol. 2020;138(5):553-559. doi:10.1001/jamaophthalmol.2020.0673 - DOI - PMC - PubMed
    1. Mader TH, Gibson CR, Pass AF, et al. . Optic disc edema, globe flattening, choroidal folds, and hyperopic shifts observed in astronauts after long-duration space flight. Ophthalmology. 2011;118(10):2058-2069. doi:10.1016/j.ophtha.2011.06.021 - DOI - PubMed
    1. Lawley JS, Petersen LG, Howden EJ, et al. . Effect of gravity and microgravity on intracranial pressure. J Physiol. 2017;595(6):2115-2127. doi:10.1113/JP273557 - DOI - PMC - PubMed
    1. Zhang LF, Hargens AR. Spaceflight-induced intracranial hypertension and visual impairment: pathophysiology and countermeasures. Physiol Rev. 2018;98(1):59-87. doi:10.1152/physrev.00017.2016 - DOI - PubMed
    1. Marshall-Goebel K, Macias BR, Laurie SS, et al. . Mechanical countermeasures to headward fluid shifts. J Appl Physiol (1985). 2021;130(6):1766-1777.doi:10.1152/japplphysiol.00863.2020 - DOI - PubMed

Publication types