

Impact of COVID-19 on ambulatory blood pressure in young adults: a cross-sectional analysis investigating time since diagnosis
- PMID: 35708703
- PMCID: PMC9291414
- DOI: 10.1152/japplphysiol.00216.2022
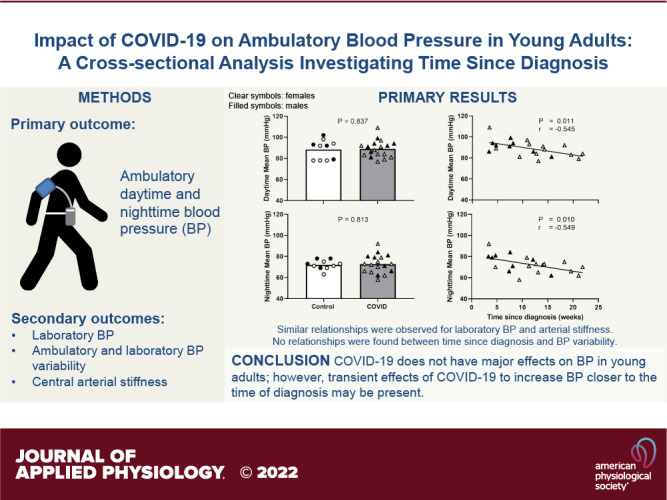
Impact of COVID-19 on ambulatory blood pressure in young adults: a cross-sectional analysis investigating time since diagnosis
Abstract
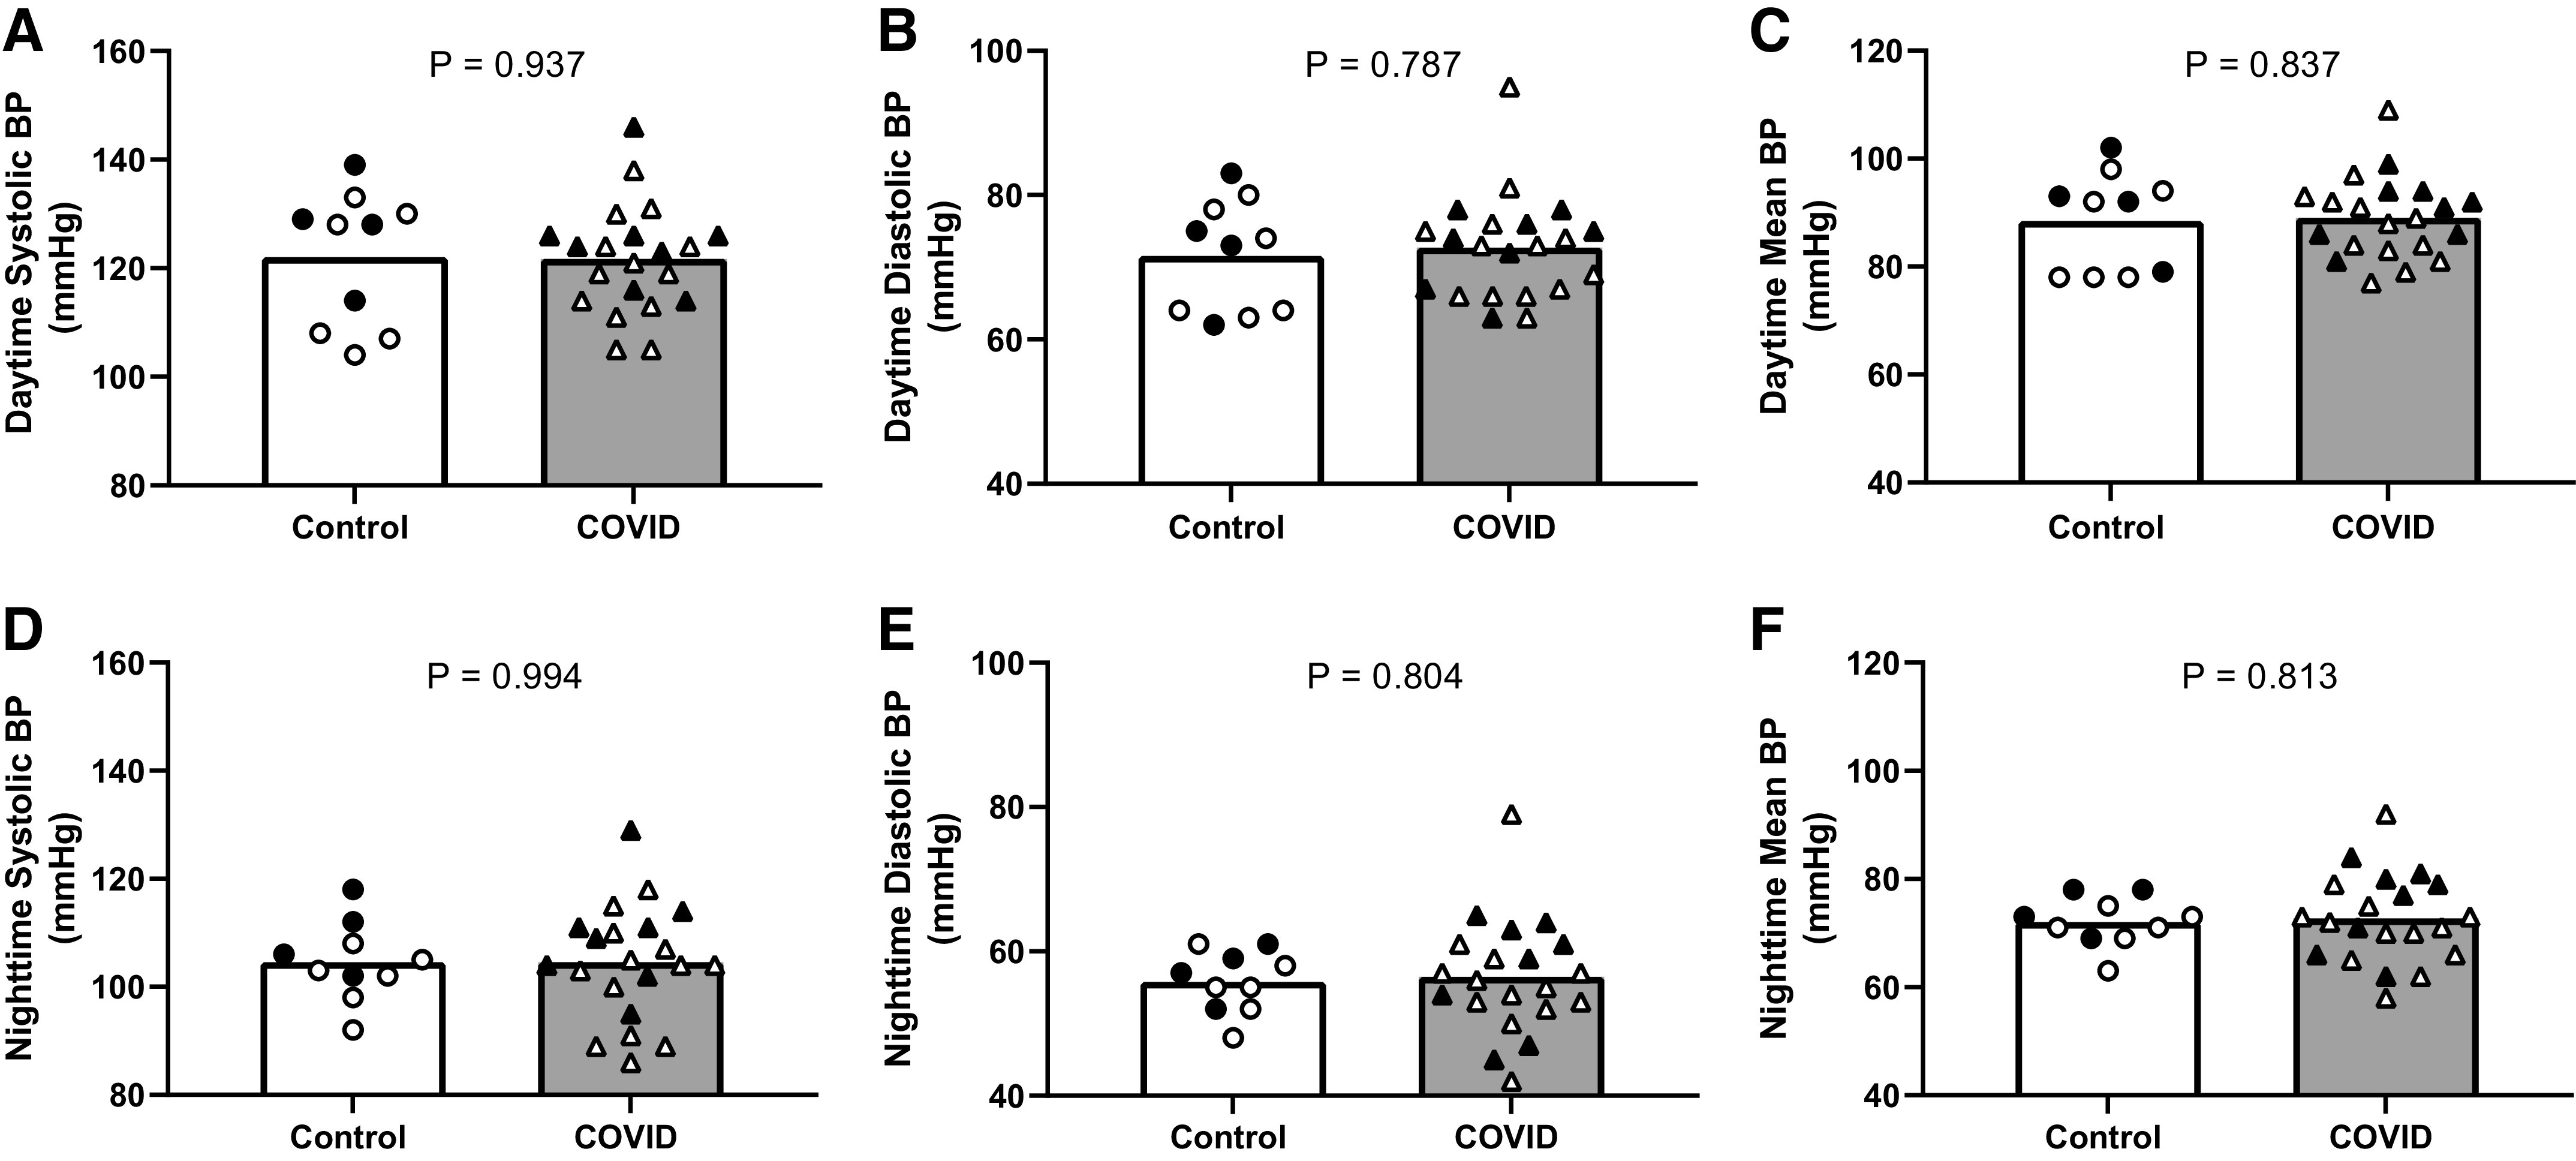
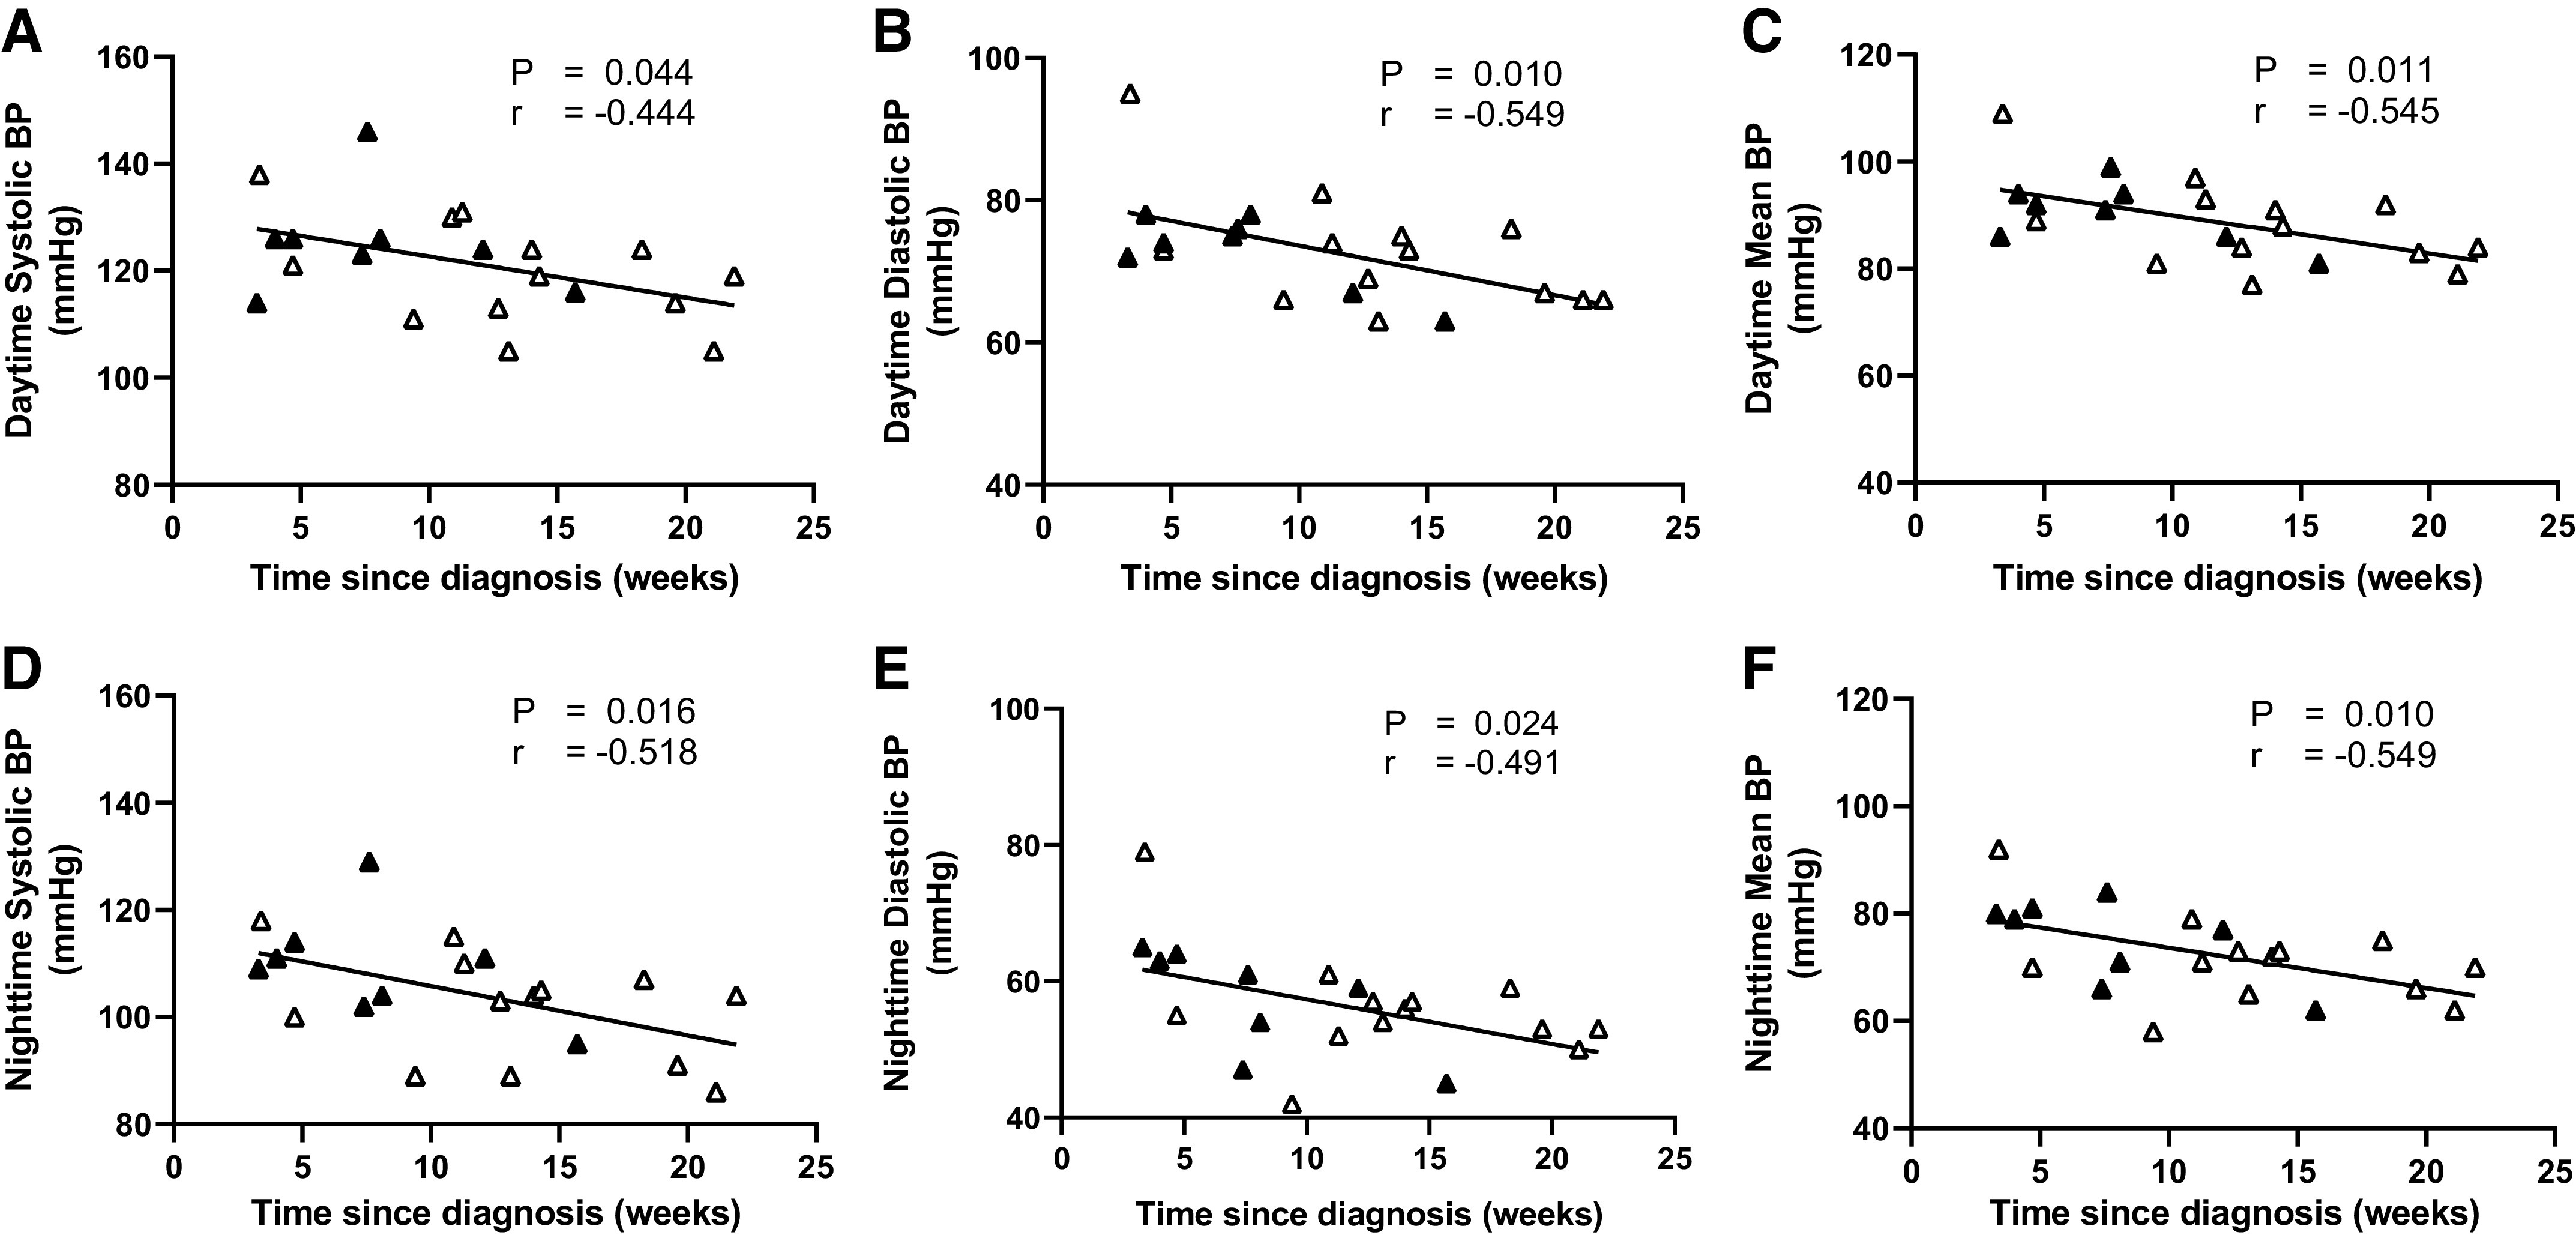
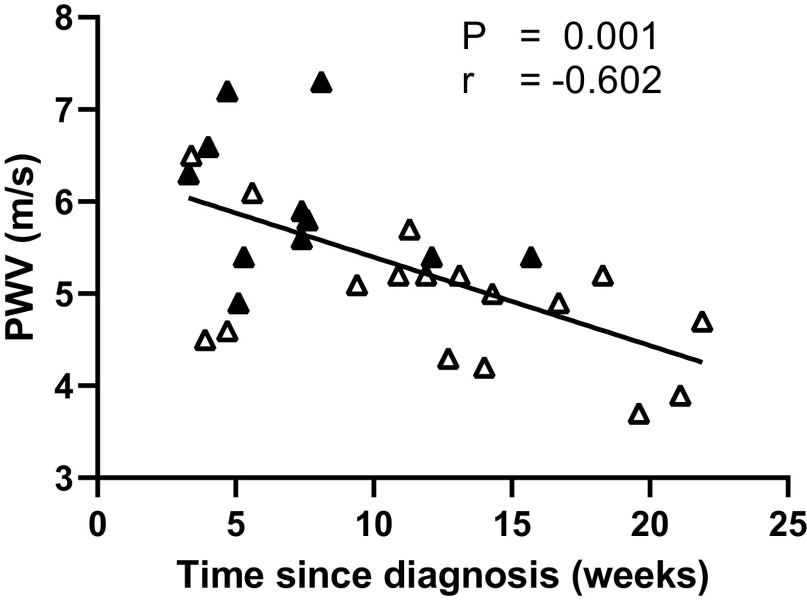
Previous studies have reported detrimental effects of COVID-19 on the peripheral vasculature. However, reports on blood pressure (BP) are inconsistent, and measurements are made only in the laboratory setting. To date, no studies have measured ambulatory BP. In addition, in previous studies, time since COVID-19 diagnosis among participants varied across a wide range, potentially contributing to the inconsistent BP results. Thus, we aimed to perform a comprehensive assessment of BP and BP variability using ambulatory and laboratory (brachial and central) measurements in young adults who had COVID-19. We hypothesized that ambulatory BP would be elevated post-COVID-19 and that measures of BP would be inversely related with time since diagnosis. Twenty-eight young adults who had COVID-19 [11 ± 6 (range 3-22) wk since diagnosis] and 10 controls were studied. Ambulatory daytime, nighttime, and 24-h systolic BP, diastolic BP, and mean BP were not different between the control and COVID groups (e.g., daytime systolic BP: control, 122 ± 12 mmHg; COVID, 122 ± 10 mmHg; P = 0.937). Similar results were observed for laboratory BPs (all P > 0.05). However, ambulatory daytime, nighttime, and 24-h BPs as well as laboratory brachial BPs were inversely correlated with time since COVID-19 diagnosis (e.g., daytime systolic BP: r = -0.444; P = 0.044, nighttime systolic BP: r = -0.518; P = 0.016). Ambulatory and laboratory-measured BP variability were not different between groups nor correlated with time since diagnosis. Collectively, these data suggest that adverse effects of COVID-19 on BP in young adults are minimal and likely transient.NEW & NOTEWORTHY We report for the first time that ambulatory daytime, nighttime, and 24-h blood pressure (BP), as well as laboratory BP, were not different between control and COVID participants. However, a significant inverse relationship with time since COVID-19 diagnosis was found (i.e., greater BP with more recent infection). Ambulatory and laboratory BP variability were unaffected and not related with diagnosis time. These findings suggest that COVID-19 may exert only short-lasting effects on BP in young adults.
Keywords: COVID-19 recovery; SARS-CoV-2; arterial stiffness; daytime blood pressure; nighttime blood pressure.
Conflict of interest statement
No conflicts of interest, financial or otherwise, are declared by the authors.
Figures
References
-
- Centers for Disease Control and Prevention. COVID Data Tracker (Online). US Department of Health and Human Services. https://covid.cdc.gov/covid-data-tracker/#datatracker-home[2022 Apr 10].
-
- Centers for Disease Control and Prevention. COVID Data Tracker (Online). US Department of Health and Human Services. https://covid.cdc.gov/covid-data-tracker/#demographics[2022 Apr 10].
Publication types
MeSH terms
Grants and funding
LinkOut - more resources
Full Text Sources
Medical
Miscellaneous