. 2022 Aug 15;132(16):e155931.
doi: 10.1172/JCI155931.

Satellite repeat RNA expression in epithelial ovarian cancer associates with a tumor-immunosuppressive phenotype

Affiliations

Satellite repeat RNA expression in epithelial ovarian cancer associates with a tumor-immunosuppressive phenotype

Rebecca L Porter et al. J Clin Invest. .

Abstract

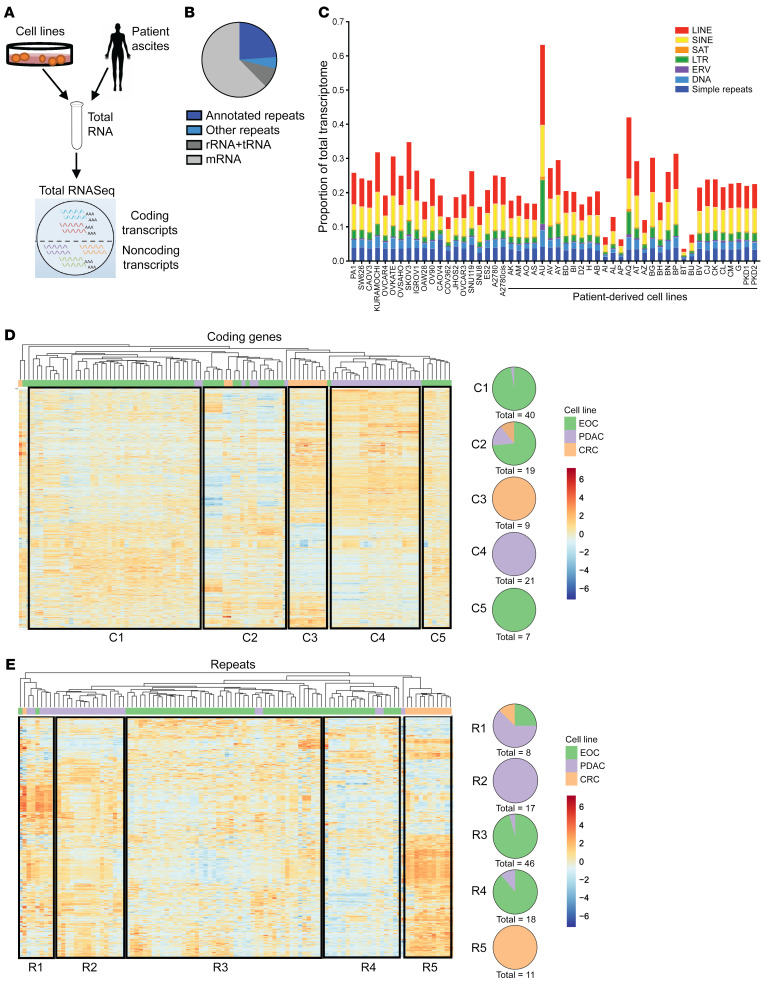
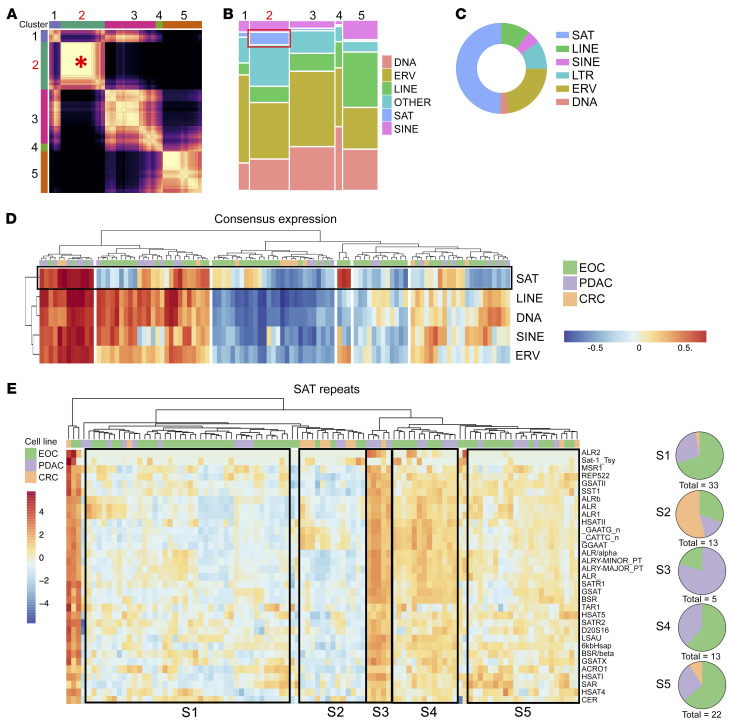
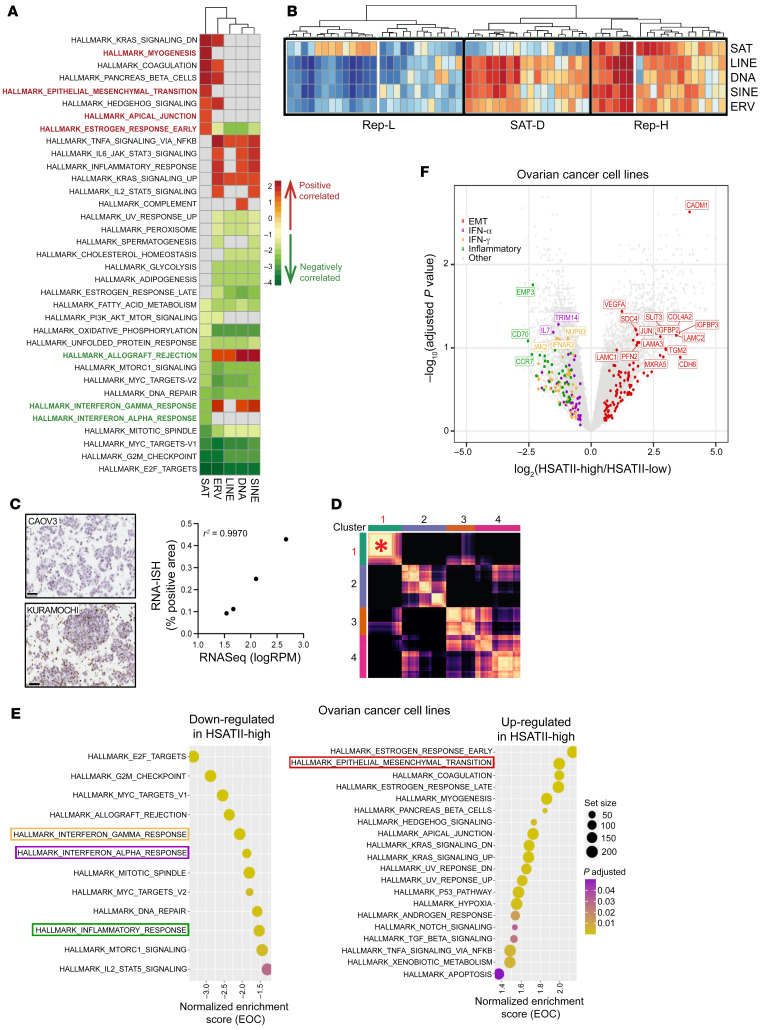
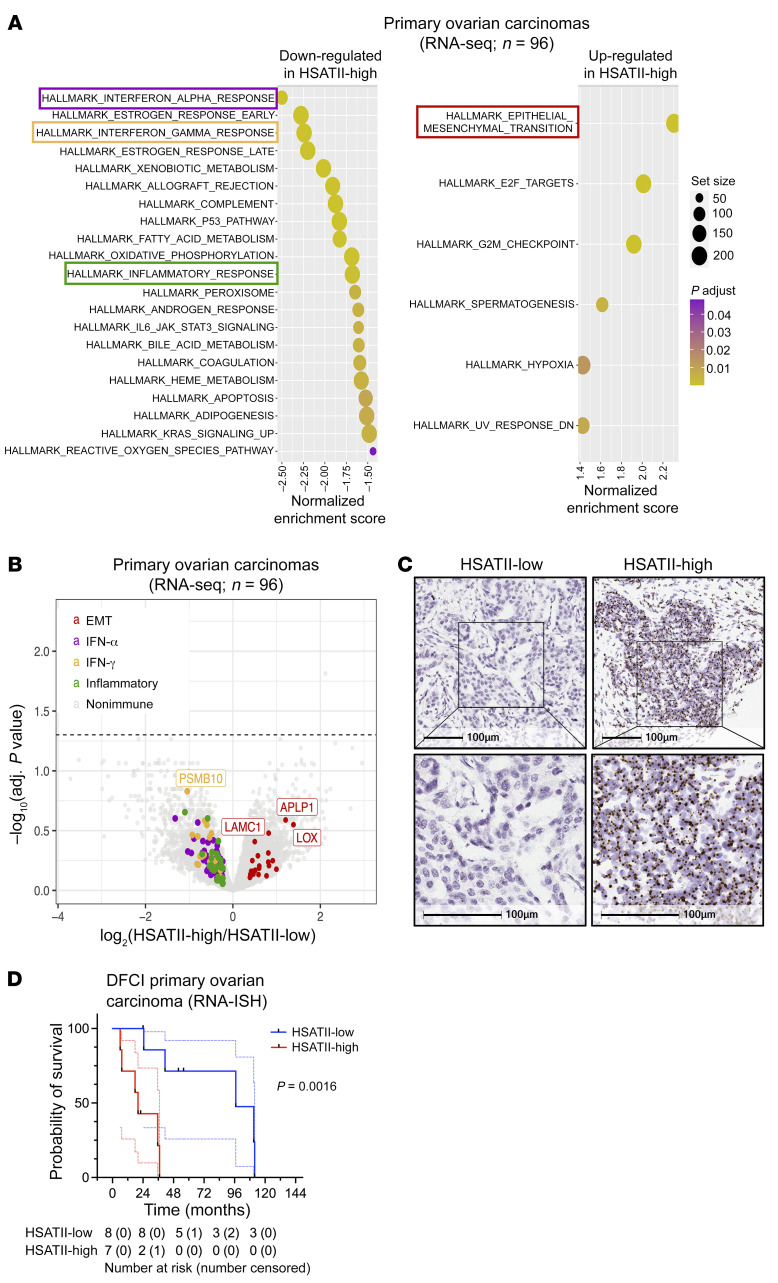
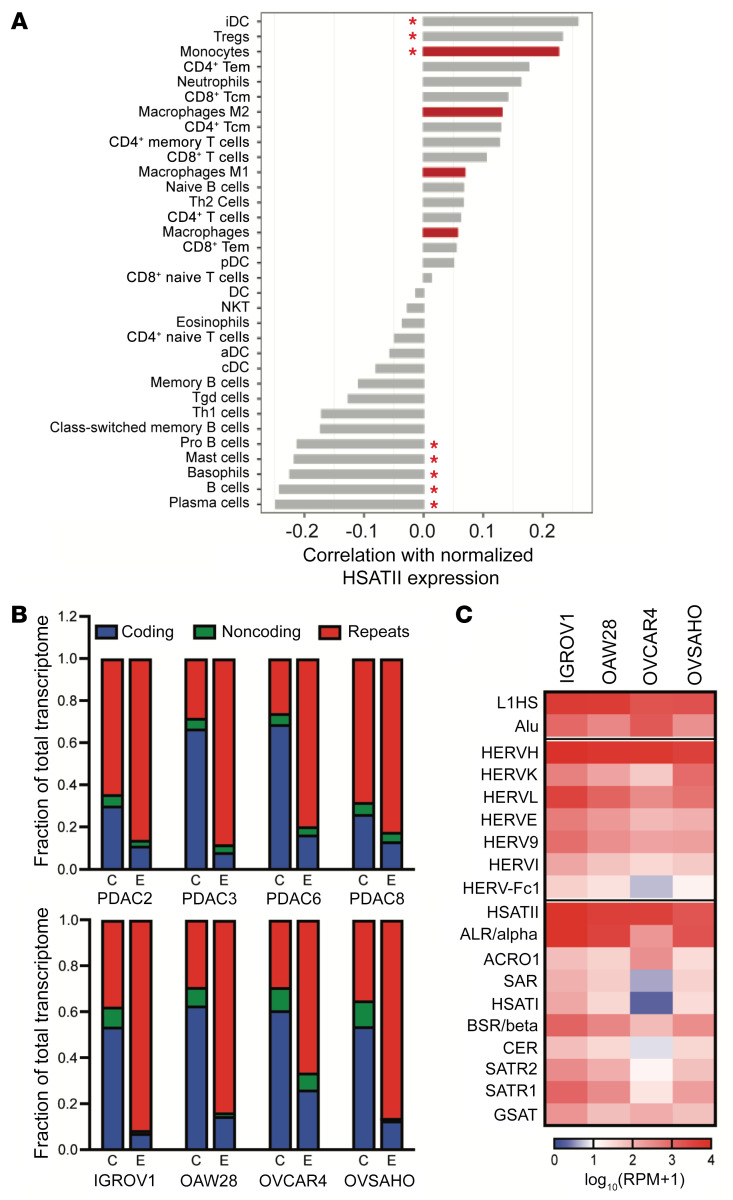
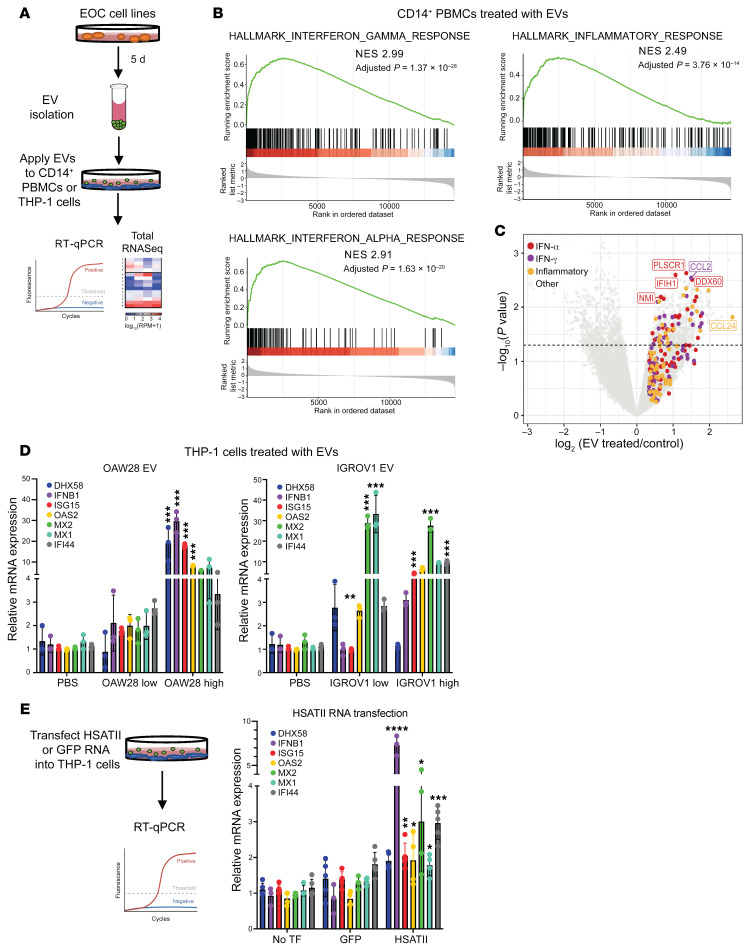
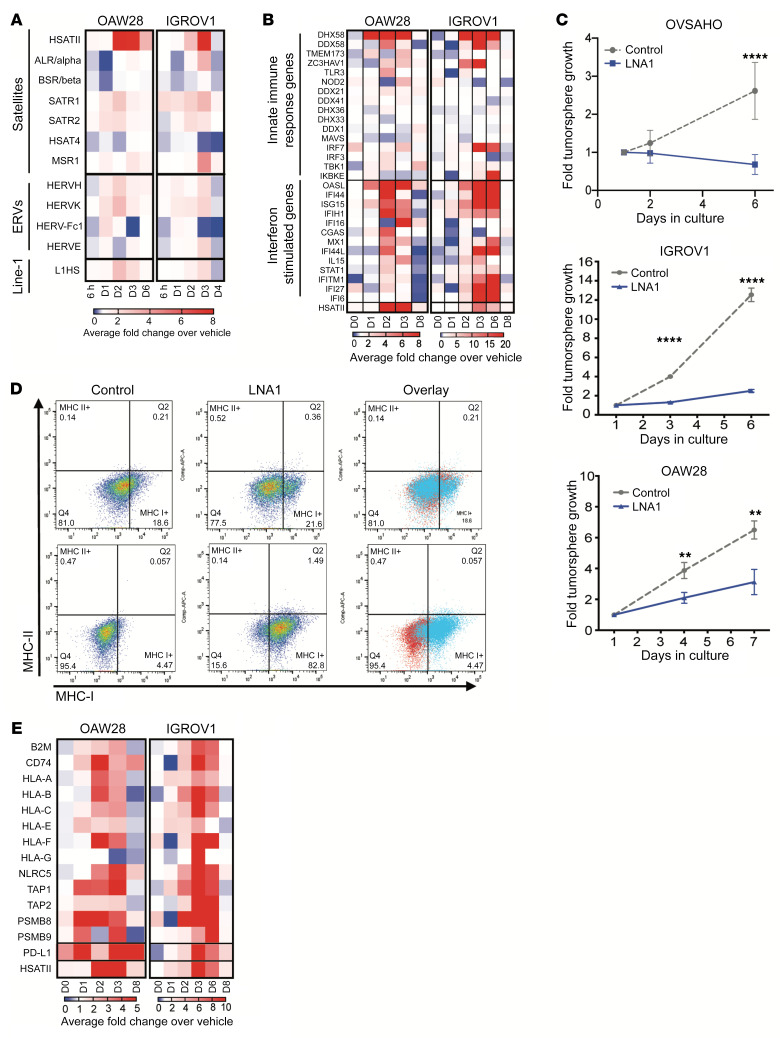
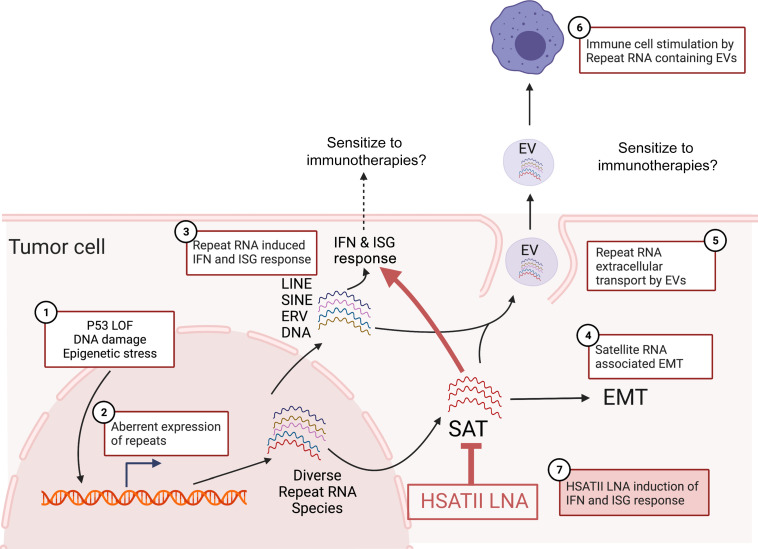
Aberrant expression of viral-like repeat elements is a common feature of epithelial cancers, and the substantial diversity of repeat species provides a distinct view of the cancer transcriptome. Repeatome profiling across ovarian, pancreatic, and colorectal cell lines identifies distinct clustering independent of tissue origin that is seen with coding gene analysis. Deeper analysis of ovarian cancer cell lines demonstrated that human satellite II (HSATII) satellite repeat expression was highly associated with epithelial-mesenchymal transition (EMT) and anticorrelated with IFN-response genes indicative of a more aggressive phenotype. SATII expression - and its correlation with EMT and anticorrelation with IFN-response genes - was also found in ovarian cancer RNA-Seq data and was associated with significantly shorter survival in a second independent cohort of patients with ovarian cancer. Repeat RNAs were enriched in tumor-derived extracellular vesicles capable of stimulating monocyte-derived macrophages, demonstrating a mechanism that alters the tumor microenvironment with these viral-like sequences. Targeting of HSATII with antisense locked nucleic acids stimulated IFN response and induced MHC I expression in ovarian cancer cell lines, highlighting a potential strategy of modulating the repeatome to reestablish antitumor cell immune surveillance.

Keywords: Cancer; Innate immunity; Noncoding RNAs; Oncology.


Figures

Figure 1
Figure 1. Diverse repeat RNA expression profiles are present in epithelial cancers and cluster tumors by tissue of origin distinctly compared with coding gene-based clustering.
(A) Graphical abstract of experimental strategy. (B) Proportion of the total transcriptome represented by mRNA, ribosomal RNA/transfer RNA (rRNA/tRNA), annotated repeats, and nonannotated repeats, averaged across all epithelial ovarian cancer (EOC) cell lines. (C) Quantification of subclasses of repeat RNAs across EOC models using total RNA-Seq expressed as proportion of total transcription, including coding and noncoding reads in each cell line or in patient-derived cells. (D) Heatmap and hierarchical clustering of EOC (green), pancreatic ductal adenocarcinoma (PDAC; purple), and colorectal cancer (CRC; gold) cell lines by coding gene expression, including all coding genes that were differentially expressed between any 2 cell lines (adjusted P < 0.05 and |log2fold change| >1). Expression is plotted as scaled log2(normalized counts per million). Pie charts C1–C5 depict the cancer-type composition of each cluster as labeled. (E) Heatmap and hierarchical clustering of EOC (green), PDAC (purple), and CRC (gold) cell lines by repeat RNA expression, including all repeat species that were differentially expressed between any 2 cell lines (adjusted P < 0.05 and |log2fold change| >1). Expression is plotted as scaled log2(normalized counts per million). Major clusters defined by similar repeat expression profiles are outlined by black boxes. Pie charts R1–R5 depict the cancer-type composition of each cluster as labeled.
Figure 2
Figure 2. Repeat RNAs are coregulated in discrete clusters, with satellite repeat RNAs exhibiting unique expression patterns in epithelial cancers.
(A) Heatmap for consensus clustering of repeat elements based on normalized expression. The red asterisk highlights satellite repeat–driven (SAT-driven) cluster 2, which has the strongest consensus correlation of the analyzed clusters. (B) Mosaic plot demonstrating relative repeat element subclass composition of each consensus cluster from A. The red box indicates SAT representation in cluster 2. (C) Proportion of total repeat expression for each subclass within the top 50 variant repeat RNAs across cell lines. (D) Hierarchical clustering of consensus expression of each repeat subclass across EOC (green), PDAC (purple), and CRC (gold) cell lines, depicting SAT consensus expression distinct from consensus expression of other repeat subclasses. (E) Heatmap and hierarchical clustering of EOC (green), PDAC (purple), and CRC (gold) cell lines by SAT RNA expression. Expression is plotted as scaled log2(normalized counts per million). Major clusters defined by similar SAT expression profiles are outlined by black boxes. Pie charts S1–S5 depict the cancer-type composition of each cluster, highlighting clusters distinct from tissue of origin.
Figure 3
Figure 3. Satellite repeat expression is associated with upregulation of epithelial-mesenchymal transition and downregulation of innate immune-response genes in EOC models.
(A) Heatmap of enriched Gene Ontology terms identified using gene set enrichment analysis (GSEA) plotted based on normalized enrichment score. GSEA was applied to a ranked gene list based on correlation with the consensus expression calculated for each repeat subclass, with the FDR set at 0.05. Positive enrichment scores (red) indicate functions that positively correlate with repeat subclass expression. Negative enrichment scores (green) indicate functions that negatively correlate with repeat expression. (B) Hierarchical clustering of consensus expression calculated for each repeat subclass in EOC cell lines. Major clusters are outlined by black boxes. (C) Representative RNA-ISH images with HSATII-specific probes in 2 EOC cell lines and correlation (Pearson’s r2) between HSATII RNA expression as determined with RNA-Seq by log(reads per million[RPM]) (as determined with RNA-Seq, with log(reads per million) as units) and percentage of tumor cells with a positive staining for HSATII by RNA-ISH. Original magnification, ×40 (D) Heatmap for consensus clustering of all repeat elements except HSATII, which was removed from analysis, based on normalized expression. The asterisk highlights SAT-driven cluster 1, which shows the highest consensus correlation of analyzed clusters, similar to clustering when HSATII was included. (E) GSEA of hallmark terms ranked on the basis log2FC of coding genes for pathways containing genes that are upregulated and downregulated in HSATII-high compared with HSATII-low ovarian cancer cell lines, based on highest (Q4) and lowest (Q1) quantile (see Supplemental Figure 3C). Colored boxes represent the pathways indicated in F. Circle size represents gene set size, and circle color represents adjusted P value. (F) Volcano plot depicting differentially expressed coding genes between HSATII-high and HSATII-low EOC cell lines. EMT, IFN-α, IFN-γ, and inflammatory hallmark pathways are highlighted.
Figure 4
Figure 4. High satellite repeat expression is linked with upregulation of epithelial-mesenchymal transition, suppressed immune response, and worsened clinical outcomes in primary human EOC.
(A) GSEA results ranked by normalized enrichment score for pathways containing genes that are upregulated (right) and downregulated (left) in HSATII-high compared with HSATII-low early-stage human ovarian carcinoma samples (n = 96). Colored boxes represent the pathways indicated in B. Circle size represents gene set size, and circle color represents adjusted P value. (B) Volcano plot depicting differentially expressed coding genes between HSATII-high and HSATII-low early-stage human ovarian carcinoma samples (n = 96). Genes driving the enrichment of EMT, IFN-α, IFN-γ, and inflammatory Hallmark pathways are highlighted. (C) Representative images of RNA-ISH with an HSATII-specific probe, depicting an example of an HSATII-low (left) and HSATII-high (right) primary human EOC tumor. Scale bar: 100 μm. (D) Kaplan-Meier survival curves for HSATII-high (red) and HSATII-low (blue) in a cohort of 16 primary human EOC tumors using quantified RNA-ISH. All data points and 95% CI are shown (dotted lines). Number at risk is number of patients in the analysis at that time point. Number censored are those who did not experience an event but had their last data point at that time interval. Log-rank, P = 0.0016.
Figure 5
Figure 5. Repeat RNAs enriched in tumor cell–derived extracellular vesicles can induce changes in the tumor immune microenvironment.
(A) Pearson’s correlation coefficients between normalized HSATII expression and the relative frequency of immune cell types in 96 human early-stage ovarian carcinoma tumor samples as identified by the xCell algorithm. Red asterisks indicate correlations with Q < 0.1. *P < 0.05. (B) RNA content of tumor cells (C) and tumor cell–derived extracellular vesicles (E) in PDAC (top) and EOC (bottom) cell lines, as determined by total RNA-Seq and plotted as a fraction of the total transcriptome. (C) Expression heatmap of representative repetitive elements in extracellular vesicles released by EOC cell lines.
Figure 6
Figure 6. Repeat RNA-enriched extracellular vesicles can induce changes in the tumor immune microenvironment.
(A) Schema of experimental design relating to data in BE. (B) Gene set enrichment analysis of IFN-response signatures and inflammatory response in extracellular vesicle–treated (EV-treated) versus untreated samples. NES, normalized enrichment score. (C) Volcano plot depicting the differential expression of coding genes between EV-treated and untreated EOC cell lines. Genes driving the enrichment in IFN-α, IFN-γ, and inflammatory hallmark pathways are noted. (D) Quantitative RT-PCR of IFN-response genes from THP-1 monocyte cell line treated with high-dose or low-dose EVs from ovarian cell lines, OAW28 (left) and IGROV1 (right). (E) Schema of THP-1 cells treated with HSATII or GFP RNA transfection and quantitative RT-PCR of IFN-response genes without transfection (TF) or with transfection of GFP RNA or HSATII RNA. For RT-PCR, all data points are shown as mean ± SD. One-way ANOVA analysis was performed with Tukey’s multiple comparisons test; significance is shown between EV treatment and PBS or HSATII and GFP RNA. *P < 0.05, **P < 0.01, ***P < 0.001, ****P < 0.0001.
Figure 7
Figure 7. Modulation of HSATII RNA with LNA is cytotoxic, induces IFN response, and increases MHC class I expression.
(A) Expression levels of HSATII and other repeat RNAs in EOC cell lines transfected with HSATII-specific LNA relative to scramble control LNA over time, plotted as fold change over control on days 0 through 6 after transfection. (B) Expression heatmap depicting relative expression of innate immune-response genes and IFN-stimulated genes (ISGs) in EOC cell lines transfected with HSATII-specific LNA relative to scramble control LNA over time. (C) Effect of HSATII-specific LNA (LNA1) on tumorsphere growth in EOC cell lines, as determined by 3D CellTiter-Glo viability assays. Plots represent 4 separate experiments for each cell line, with 2-tailed unpaired t test performed at each time point. **P < 0.01, ****P < 0.0001. (D) Flow cytometric analysis of MHC-I and MHC-II cell surface protein expression on EOC cell lines transfected with LNA1 compared with control LNA. (E) Expression heatmap depicting relative expression of MHC class I genes and PD-L1 in EOC cell lines transfected with HSATII-specific LNA relative to scramble control LNA over time.
Figure 8
Figure 8. Working model of potential biologic and therapeutic implications of SAT RNA expression in epithelial tumor cells.
Working model depicting the reported and hypothesized tumor cell autonomous and tumor microenvironmental effects of aberrant SAT RNA expression. Various genetic and/or epigenetic alterations (1) can lead to aberrant expression of repeat RNAs (2) in cancer cells. Certain subclasses of repeat RNAs can trigger an IFN response (3) and may sensitize tumors to immunotherapies. Other repeat species, like SAT, can preferentially stimulate EMT (4). Repeat RNAs can also leave the cell in exosomes (5) and thereby stimulate immune cells in the tumor microenvironment (6), which may also sensitize to immunotherapies. These pathways can be modulated by applying LNA to specifically target SAT RNA species like HSATII (7). This model highlights the potential utility of SAT repeat RNAs as biomarkers and therapeutic targets in EOC. LOF, loss of function.

Comment in

References

    1. Britten RJ, Kohne DE. Repeated sequences in DNA. Hundreds of thousands of copies of DNA sequences have been incorporated into the genomes of higher organisms. Science. 1968;161(3841):529–540. doi: 10.1126/science.161.3841.529. - DOI - PubMed
    1. Lander ES, et al. Initial sequencing and analysis of the human genome. Nature. 2001;409(6822):860–921. doi: 10.1038/35057062. - DOI - PubMed
    1. Ting DT, et al. Aberrant overexpression of satellite repeats in pancreatic and other epithelial cancers. Science. 2011;331(6017):593–596. doi: 10.1126/science.1200801. - DOI - PMC - PubMed
    1. Rodic N, et al. Long interspersed element-1 protein expression is a hallmark of many human cancers. Am J Pathol. 2014;184(5):1280–1286. doi: 10.1016/j.ajpath.2014.01.007. - DOI - PMC - PubMed
    1. Rooney MS, et al. Molecular and genetic properties of tumors associated with local immune cytolytic activity. Cell. 2015;160(1–2):48–61. - PMC - PubMed

Publication types