. 2022 Aug 1;132(15):e150517.
doi: 10.1172/JCI150517.

MERTK activation drives osimertinib resistance in EGFR-mutant non-small cell lung cancer

Affiliations

MERTK activation drives osimertinib resistance in EGFR-mutant non-small cell lung cancer

Dan Yan et al. J Clin Invest. .

Abstract

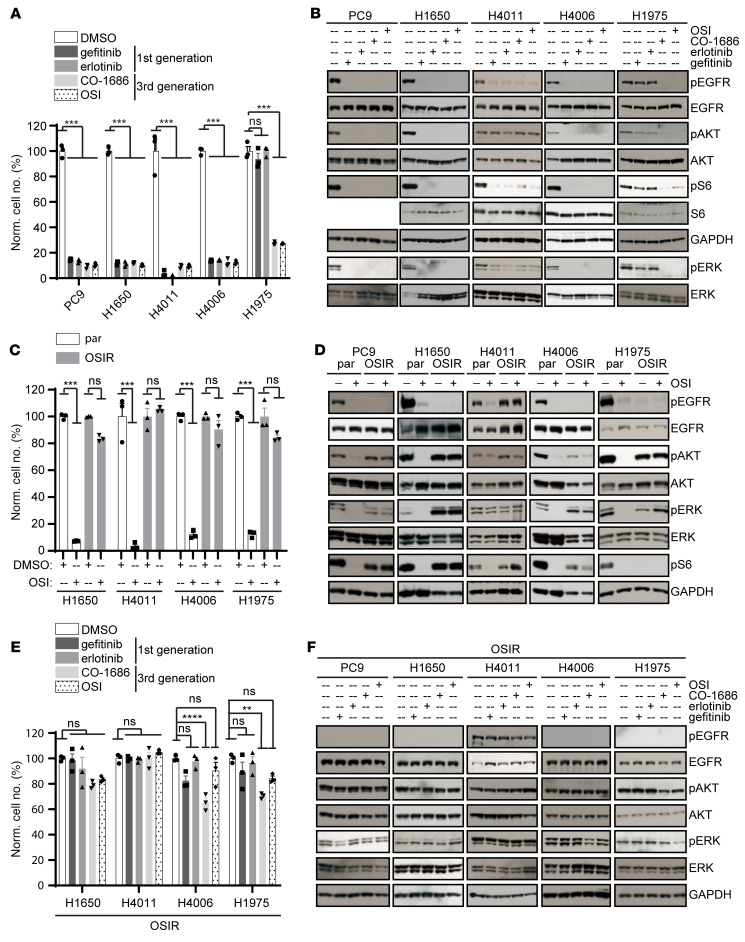
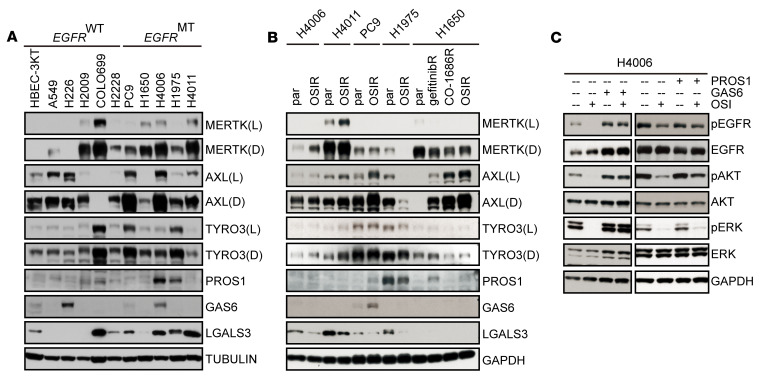
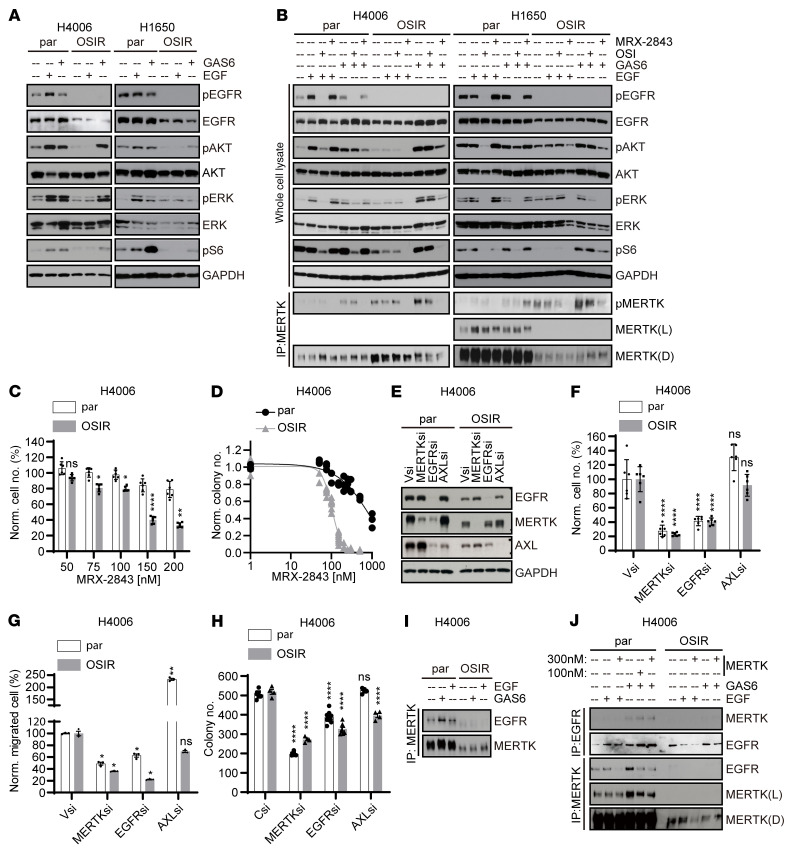
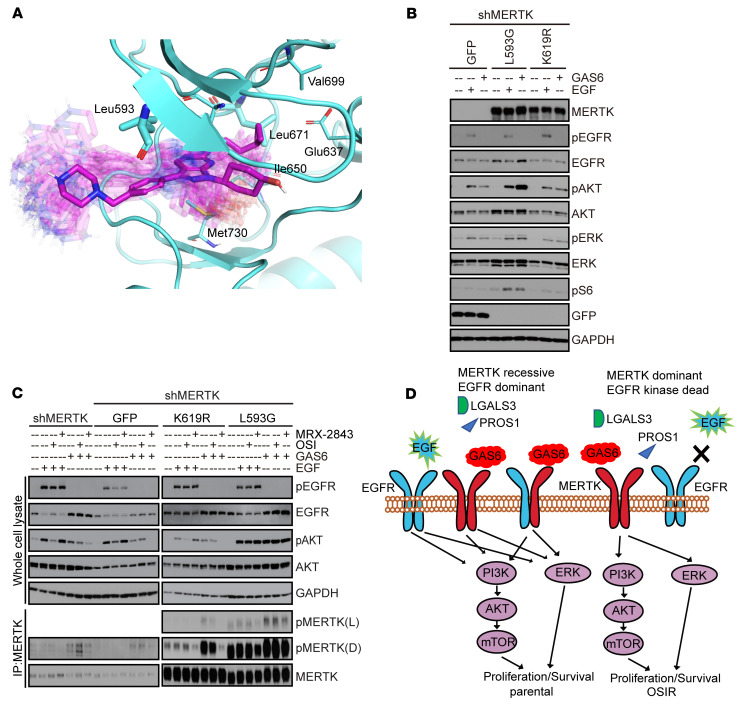
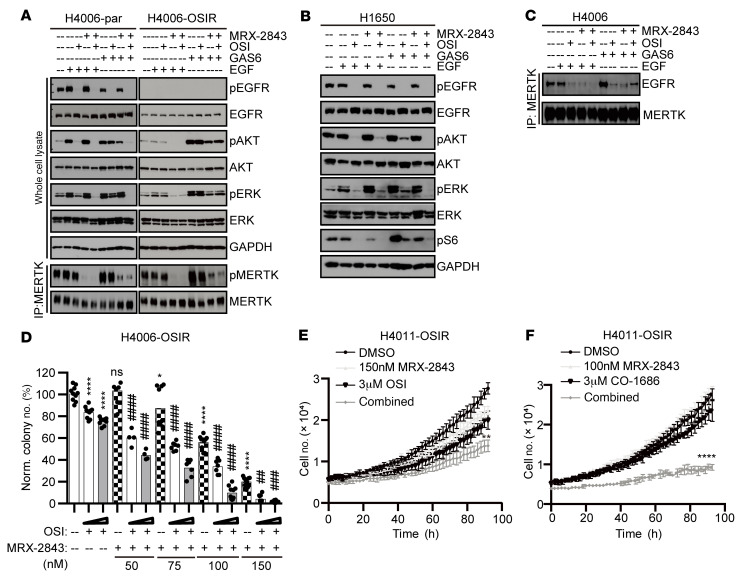
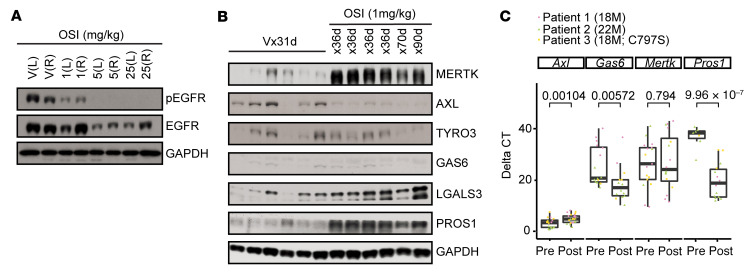
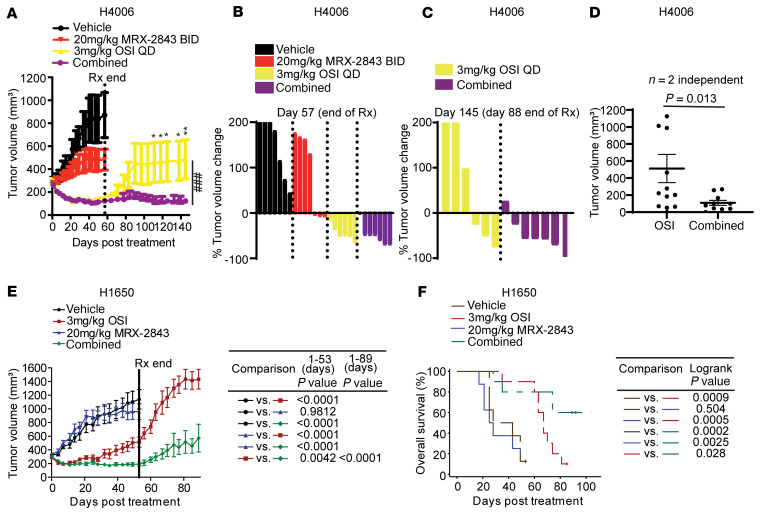
Acquired resistance is inevitable in non-small cell lung cancers (NSCLCs) treated with osimertinib (OSI), and the mechanisms are not well defined. The MERTK ligand GAS6 promoted downstream oncogenic signaling in EGFR-mutated (EGFRMT) NSCLC cells treated with OSI, suggesting a role for MERTK activation in OSI resistance. Indeed, treatment with MRX-2843, a first-in-class MERTK kinase inhibitor, resensitized GAS6-treated NSCLC cells to OSI. Both GAS6 and EGF stimulated downstream PI3K/AKT and MAPK/ERK signaling in parental cells, but only GAS6 activated these pathways in OSI-resistant (OSIR) derivative cell lines. Functionally, OSIR cells were more sensitive to MRX-2843 than parental cells, suggesting acquired dependence on MERTK signaling. Furthermore, MERTK and/or its ligands were dramatically upregulated in EGFRMT tumors after treatment with OSI in both xenograft models and patient samples, consistent with induction of autocrine/paracrine MERTK activation. Moreover, treatment with MRX-2843 in combination with OSI, but not OSI alone, provided durable suppression of tumor growth in vivo, even after treatment was stopped. These data identify MERTK as a driver of bypass signaling in treatment-naive and EGFRMT-OSIR NSCLC cells and predict that MRX-2843 and OSI combination therapy will provide clinical benefit in patients with EGFRMT NSCLC.

Keywords: Cell Biology; Drug therapy; Lung cancer; Oncology; Protein kinases.


Figures

Figure 1
Figure 1. Activation of PI3K/AKT and MAPK/ERK pathways is independent of EGFR activation in OSIR cell-line derivatives with cross resistance to other EGFR TKIs.
(A, C, and E) Nuclight Red–labeled EGFRMT NSCLC cell lines and OSIR derivatives were treated with 1 μM of gefitinib, erlotinib, CO-1686, or OSI for 3 to 4 days, and cell numbers relative to vehicle-treated control (DMSO) were determined using the Incucyte ZOOM Live Cell Imaging System. Mean values and standard errors derived from 3 independent experiments are shown.**P < 0.01; ***P < 0.001, ****P < 0.0001; 1-way ANOVA; Norm= cell numbers were normalized to cells treated with DMSO. (B, D, and F) Cells were serum starved overnight and then treated with 1 μM of EGFR TKIs or DMSO for 2 hours and phosphorylated (denoted by p); total proteins were assessed by immunoblot. Images shown are representative of 3 independent experiments. See complete unedited blots in the supplemental material.
Figure 2
Figure 2. MERTK drives oncogenic signaling in the presence of OSI.
(A and B) Cell lysates were prepared from the indicated cell lines and TAM receptors, and their ligands were assessed by immunoblot. (A) EGFRWT, EGFRMT, and HBEC-3KT immortalized normal human bronchial epithelial cell lines. (B) OSIR, parental, gefitinib-resistant (gefitinibR), and CO-1686–resistant (CO-1686R) cell lines. (C) H4006 cells were serum starved overnight and then treated with DMSO or 100 nM OSI in serum-free medium for 2 hours followed by 10 minutes of stimulation with 50 nM GAS6, 50 nM PROS1, or vehicle and phosphorylated; total proteins were detected by immunoblot. Images shown are representative of 3 independent experiments. See complete unedited blots in the supplemental material.
Figure 3
Figure 3. MERTK drives oncogenic signaling in OSIR cells and associates with EGFR in parental but not OSIR cells.
(A and B) OSIR or parental cells were serum starved overnight and then stimulated with GAS6 or EGF ligands for 10 minutes. Phosphorylated and total proteins were assessed by immunoblot. (B) Cultures were treated with 1 μM OSI or 300 nM MRX-2843 for 2 hours before ligand stimulation. MERTK was detected after immunoprecipitation. (C) Nuclight Red–expressing H4006-par or H4006-OSIR cells were treated with MRX-2843 for approximately 100 hours, and cell numbers were counted using the Incucyte ZOOm Live Cell Imaging System. Cell numbers relative to vehicle are shown (n = 6). (D) H4006-par and H4006-OSIR cells were cultured at low density and treated with MRX-2843 for 7 to 8 days before colonies were stained and counted. Colony numbers relative to vehicle are shown. The sigmoid shown was derived using a 4-parameter variable-slope nonlinear regression model. (EH) Nuclight Red–expressing H4006-par or H4006-OSIR cells were transfected with siRNA against MERTK, EGFR, or AXL or with nontargeting siRNA (Vsi) for 24 hours and then cultured for assessment of (F) cell expansion over 80 to 90 hours, (G) chemotaxis, and (H) colony formation. (E) Protein levels were determined by immunoblot 24 hours after transfection to confirm target knockdown. (I and J) Serum-starved H4006-par and H4006-OSIR cells were stimulated with GAS6 or EGF ligand for 10 minutes and treated with pervanadate; then MERTK or EGFR was immunoprecipitated from cell lysates and EGFR and MERTK proteins were detected by immunoblot. (J) Cultures were treated with MRX-2843 or vehicle for 2 hours before ligand stimulation. Representative immunoblots from 3 independent experiments are shown. Mean values and standard errors were derived from 3 to 8 independent experiments. *P < 0.05; **P < 0.01; ****P < 0.0001, 1-way ANOVA. See complete unedited blots in the supplemental material.
Figure 4
Figure 4. MERTK mediates downstream oncogenic signaling in NSCLC cells.
(A) MERTK (cyan) in complex with MRX-2843 (magenta sticks). Representative conformations of the inhibitor sampled from MD simulations are shown in semitransparent rendering. Eight residues considered as potential mutation sites to block MRX-2843 binding yet preserve kinase activity and 6 visible residues are highlighted and rendered as cyan sticks. (B and C) 633 cells with shRNA-mediated inhibition of endogenous MERTK and ectopic expression of MERTK-L593G or MERTK-K619R mutant proteins or GFP control were serum starved overnight and then stimulated with GAS6 or EGF for 10 minutes. Phosphorylated and total proteins were detected by immunoblot. Images shown are representative of 3 independent experiments. (C) Cells were treated with 300 nM MRX-2843 or 1 μM OSI for 2 hours before stimulation with GAS6 or EGF. MERTK was detected following immunoprecipitation. (D) Model summarizing the proposed mechanisms by which MERTK shifts from its recessive role in OSI-sensitive EGFRMT NSCLC cells to a dominant role in OSIR EGFRMT NSCLC cells through differential interplay with EGFR.See complete unedited blots in the supplemental material.
Figure 5
Figure 5. MRX-2843 sensitizes OSIR cell lines to EGFR TKIs.
(AC) Cells were serum starved overnight and then treated with 1 μM OSI and/or 100 nM MRX-2843 for 2 hours before stimulation with GAS6 or EGF for 10 minutes. Phosphorylated and total proteins were assessed by immunoblot. (A and C) Cultures were treated with pervanadate prior to preparation of cell lysates, and MERTK was immunoprecipitated before immunoblot. (D) H4006-OSIR cells were cultured at low density in the presence of the indicated concentrations of MRX-2843 and/or OSI (1 μM or 2 μM) or vehicle for 8 days before colonies were stained and counted. *P < 0.05 versus vehicle; ****P < 0.0001 versus vehicle; ##P < 0.01 versus single agents; ###P < 0.001 versus single agents; ####P < 0.0001 versus single agents, 1-way ANOVA. (E and F) Nuclight Red–expressing H4011-OSIR cells were treated with MRX-2843, CO-1686, or OSI alone or combined, and cell numbers were determined at 2-hour intervals using the Incucyte ZOOM Live Cell Imaging System. Images shown are representative of 3 independent experiments. **P < 0.01; ****P < 0.0001, 1-way ANOVA. Mean values and standard errors were derived from 4 to 10 (D) or 3 (E and F) independent experiments. See complete unedited blots in the supplemental material.
Figure 6
Figure 6. MERTK and/or MERTK ligands are upregulated in EGFRMT NSCLCs treated with OSI tumor xenografts and patient samples.
(A and B) 24- to 30-week-old male or female athymic Nude-Foxn1nu mice with established s.c. H4006 xenograft tumors (200–450 mm3) were treated with the indicated dose of OSI or vehicle (V) once daily. (A) Treatment was administered for 3 days. Tumors were dissected 3 hours after the last administration of OSI, and phosphorylated and total EGFR were detected by immunoblot. L, left; R, right. (B) Treatment was administered for the indicated number of days. Tumors were dissected and TAM receptors and ligands were assessed by immunoblot. (C) Three sets of paired pre- and posttreatment tumor biopsies from patients with EGFRMT NSCLC treated with OSI were obtained, and expression of genes encoding TAM receptors (AXL and MERTK) and their ligands (GAS6 and PROS1) was determined by quantitative reverse-transcription PCR. Median ΔCt values and standard errors are shown. Significant differences in gene expression after treatment (P < 0.05) were determined using LMM. See complete unedited blots in the supplemental material.
Figure 7
Figure 7. OSI and MRX-2843 combination therapy provides sustained inhibition of EGFRMT tumor growth in vivo.
Mice with s.c. H4006 tumors (AD, 200–450 mm3) or H1650 tumors (E and F, 200–450 mm3) were treated with once daily (QD) OSI or twice daily (BID) MRX-2843, OSI and MRX-2843 combined, or vehicle only. Tumors were measured twice weekly during treatment and once weekly after treatment. (A) Mean values and standard deviations are shown. *P < 0.05; **P < 0.01; unpaired t test 1-way ANOVA; n = 6 for 3 mg/kg OSI, n=7 for vehicle and OSI and MRX-2843 combined, and n=8 for 20 mg/kg MRX-2843. ###P < 0.001, 2-way ANOVA. (B and C) Waterfall plots showing percentage change in tumor volume at end of treatment (day 57) or 88 days after treatment was stopped (day 145). The y axes are truncated at 200%. (D) Mean tumor volumes and standard deviations from 2 independent experiments 88 day after treatment was stopped. (E) Mean values and standard deviations are shown (n = 8–10, LMM). (F) Mice with tumor volume greater than 1500 mm3 or significant tumor ulceration were removed from study and differences in survival were determined. Plus signs indicate censored mice.

References

    1. Siegel RL, et al. Cancer statistics, 2021. CA Cancer J Clin. 2021;71(1):7–33. doi: 10.3322/caac.21654. - DOI - PubMed
    1. Mitsudomi T, et al. Mutations of the epidermal growth factor receptor gene predict prolonged survival after gefitinib treatment in patients with non-small-cell lung cancer with postoperative recurrence. J Clin Oncol. 2005;23(11):2513–2520. doi: 10.1200/JCO.2005.00.992. - DOI - PubMed
    1. Shigematsu H, et al. Clinical and biological features associated with epidermal growth factor receptor gene mutations in lung cancers. J Natl Cancer Inst. 2005;97(5):339–346. doi: 10.1093/jnci/dji055. - DOI - PubMed
    1. Mok TS, et al. Gefitinib or carboplatin-paclitaxel in pulmonary adenocarcinoma. N Engl J Med. 2009;361(10):947–957. doi: 10.1056/NEJMoa0810699. - DOI - PubMed
    1. Rosell R, et al. Screening for epidermal growth factor receptor mutations in lung cancer. N Engl J Med. 2009;361(10):958–967. doi: 10.1056/NEJMoa0904554. - DOI - PubMed

Publication types

MeSH terms