. 2022 Jun 16;20(6):e3001649.
doi: 10.1371/journal.pbio.3001649. eCollection 2022 Jun.

The connecting cilium inner scaffold provides a structural foundation that protects against retinal degeneration

Affiliations

The connecting cilium inner scaffold provides a structural foundation that protects against retinal degeneration

Olivier Mercey et al. PLoS Biol. .

Abstract

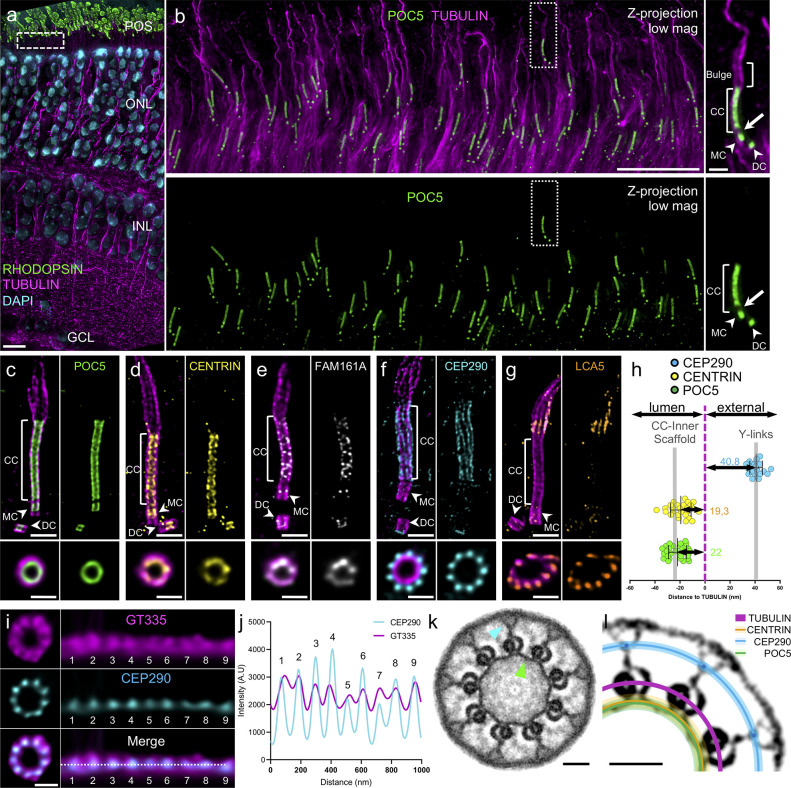
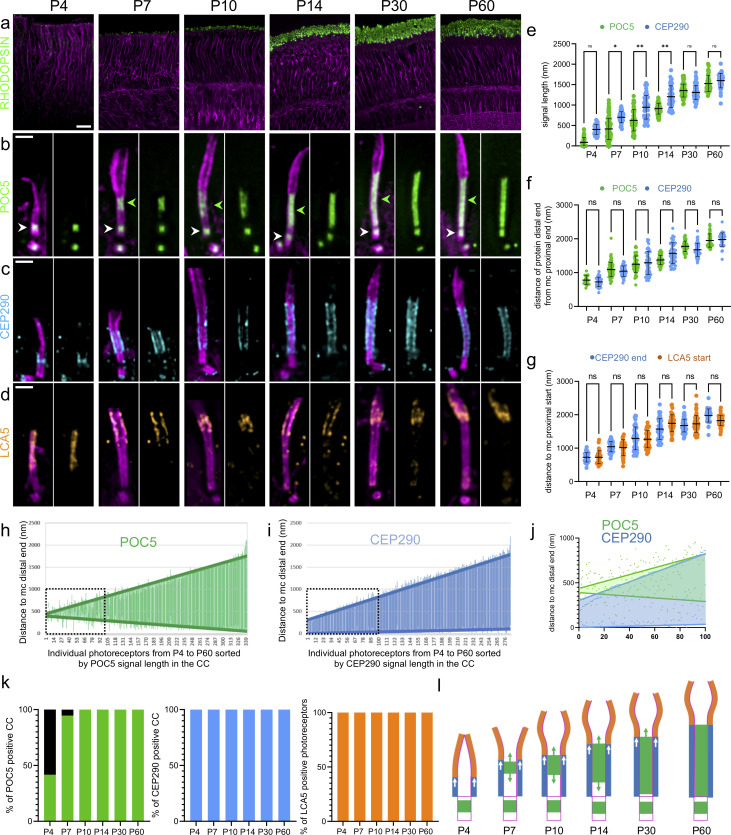
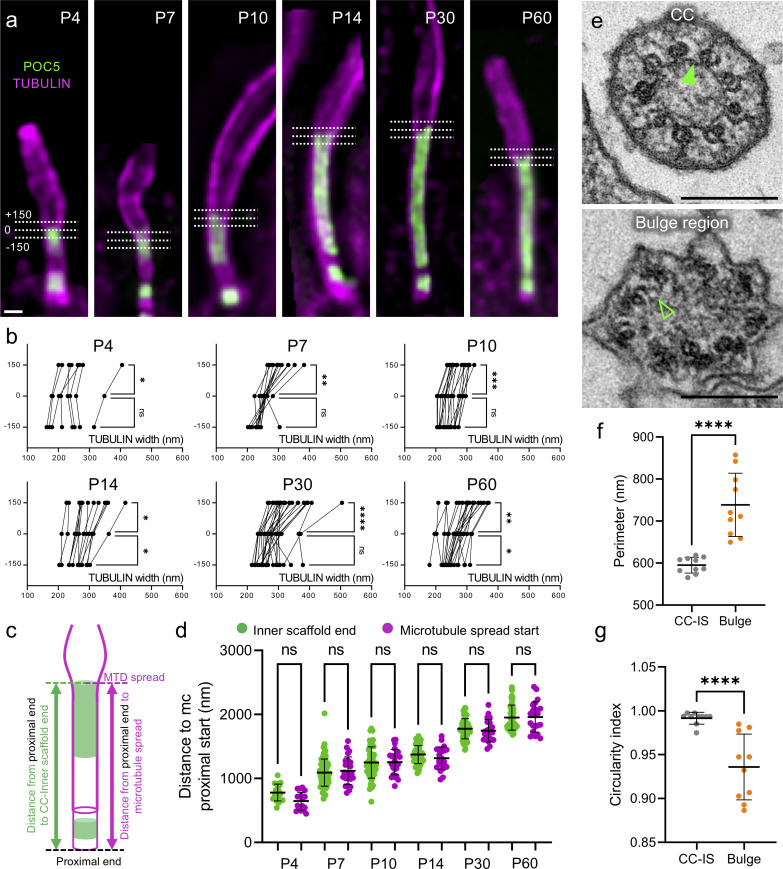
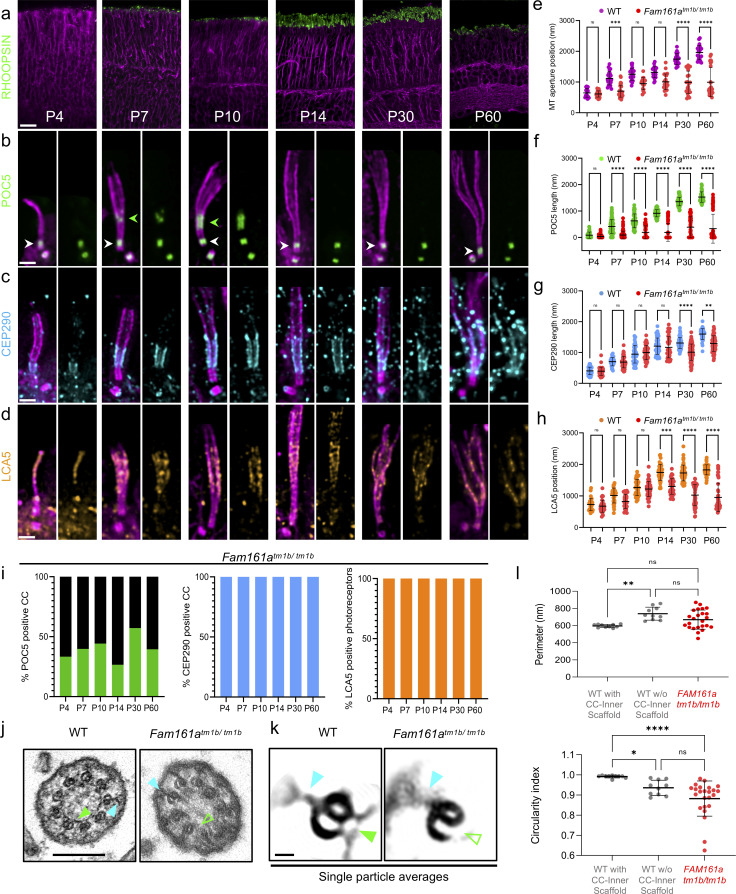
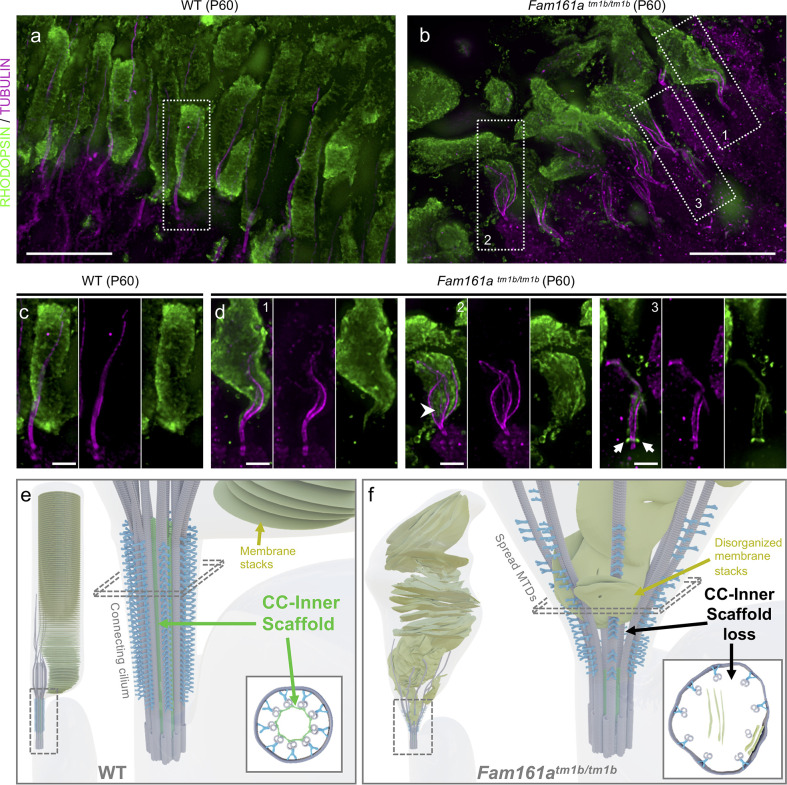
Inherited retinal degeneration due to loss of photoreceptor cells is a leading cause of human blindness. These cells possess a photosensitive outer segment linked to the cell body through the connecting cilium (CC). While structural defects of the CC have been associated with retinal degeneration, its nanoscale molecular composition, assembly, and function are barely known. Here, using expansion microscopy and electron microscopy, we reveal the molecular architecture of the CC and demonstrate that microtubules are linked together by a CC inner scaffold containing POC5, CENTRIN, and FAM161A. Dissecting CC inner scaffold assembly during photoreceptor development in mouse revealed that it acts as a structural zipper, progressively bridging microtubule doublets and straightening the CC. Furthermore, we show that Fam161a disruption in mouse leads to specific CC inner scaffold loss and triggers microtubule doublet spreading, prior to outer segment collapse and photoreceptor degeneration, suggesting a molecular mechanism for a subtype of retinitis pigmentosa.


Conflict of interest statement

Authors declare no competing interests.

Figures

Fig 1
Fig 1. Molecular mapping of the mammalian photoreceptor connecting cilium.
(a) Low magnification U-ExM image of a P14 mouse retina highlighting the preservation of the different retina layers. Note that the RPE layer is removed with the dissection. Scale bar: 10 μm. (b) Expanded P14 photoreceptor layer (equivalent region to the white dashed line depicted in (a)). Inset shows details of 1 photoreceptor cell. Arrowheads indicate centrioles. Arrow depicts the gap between centriole and CC POC5 signals. Scale bar: 5 μm (inset: 500 nm). (c–g) Confocal U-ExM images of adult photoreceptors stained for tubulin (magenta) and POC5 (c: green) or CENTRIN (d: yellow), FAM161A (e: gray), CEP290 (f: cyan), and LCA5 (g: orange). Lower panels show transversal views of the CC for each staining. Arrowheads indicate centrioles. Scale bars: side view = 500 nm; transversal view = 200 nm. (h) Distances between the maximum intensity of POC5 (green), CENTRIN (dark yellow), and CEP290 (cyan) compared to tubulin (magenta) calculated from transversal view images. Gray bars indicate the values obtained from the simulation in S4 Fig. n ≥ 2 animals per staining. See S1 Table. (i) Transversal view (left) and polar transform (right) of GT335 (magenta) and CEP290 (cyan) signals revealing overlapping 9-fold symmetry. Scale bar: 200 nm. (j) Plot profiles of CEP290 (cyan) and GT335 (magenta) polar transform of (i). (k) Symmetrized EM image of a P14 CC transversal section revealing an inner ring decorating MTDs (green arrowhead) and Y-links bridging MTDs to the membrane (blue arrowhead). Scale bar: 50 nm. (l) Model representing relative positions calculated in (h) and (j) of POC5 (green line), CENTRIN (dark yellow line), CEP290 (cyan dot and line) to tubulin (magenta) on a contrasted symmetrized EM picture of a CC. Light color lines represent the SD for each protein. Scale bar: 50 nm. The data underlying all the graphs shown in the figure are included in the S1 Data file. CC, connecting cilium; DC, daughter centriole; GCL, ganglion cells layer; IPL, inner nuclear layer; MC, mother centriole; MTD, microtubule doublet; ONL, outer nuclear layer; POS, photoreceptor outer segment.
Fig 2
Fig 2. Photoreceptor CC inner scaffold assembly.
(a) Low magnification of expanded retinas showing rod OS formation from P4 to P60 stained with RHODOPSIN (green) and tubulin (magenta). Scale bar: 20 μm. (b–d) Expanded photoreceptors stained for tubulin (magenta) and POC5 (green, b), CEP290 (cyan, c), or LCA5 (orange, d) from P4 to P60. Note that CEP290 also caps the daughter centriole. Green arrowheads = CC inner scaffold; white arrowheads = centriole inner scaffold. Scale bar: 500 nm. (e) Quantification of POC5 (green) and CEP290 (cyan) signal length inside the CC over time; ≥3 animals per time point. (f) Quantification of the distance of POC5 (green) and CEP290 (cyan) signal distal ends in the CC to the mother centriole proximal end from P4 to P60; ≥3 animals per time point. (g) Distance of CEP290 signal distal end (cyan) and LCA5 signal start (orange) to the mother centriole proximal end; ≥3 animals per time point. Note that CEP290 measurements are the same as in (f). (h, i) Length and position of POC5 (h: green) or CEP290 (i: cyan) signal within the CC. Note that signals are sorted by length and distances are compared to MC distal end (measurements from P4 to P60). Thick green (POC5) and cyan (CEP290) lines represent linear regression curves. Black dashed square represents the inset highlighted in (j); ≥3 animals per time point. (j) Comparison of the 100 shortest CC reveals bidirectional POC5 (green) and unidirectional CEP290 (cyan) growth. (k) Percentage of CC positive for POC5 (green), CEP290 (cyan), and LCA5 (orange) from P4 to P60; ≥3 animals per time point. (l) Model showing inner scaffold (green) and CEP290 (cyan) growth over time, dictating the final length of the CC and the starting point of the bulge region (orange). Means, percentage, and standard deviations are listed in S1 Table. The data underlying all the graphs shown in the figure are included in the S1 Data file. CC, connecting cilium; OS, outer segment.
Fig 3
Fig 3. The CC inner scaffold acts as a structural zipper maintaining MTDs cohesion.
(a) Expanded photoreceptors illustrating the measurements of tubulin width at 3 locations relative to the POC5 signal. 0: distal end of the CC inner scaffold; +150: 150 nm distally to the CC inner scaffold end; −150: 150 nm proximally to the CC inner scaffold end. Scale bar: 200 nm. (b) Tubulin width measurements of the photoreceptor at the 3 locations depicted in (a) (−150 nm, 0 nm, +150 nm) from P4 to P60; ≥3 animals per time point. (c) Scheme describing the measurements of the distances between mother centriole proximal end and CC inner scaffold signal end (green) or MTDs spread (magenta) used in (d). (d) Comparison of the position of the CC inner scaffold end (POC5) or microtubule spread start relative to the centriole’s proximal end, from P4 to P60; ≥3 animals per time point. Note that inner scaffold measurements correspond to the POC5 data presented in Fig 2F. (e) EM transversal sections at the CC (top) or at the bulge region (bottom). Filled green arrowhead points to the CC inner scaffold; empty green arrowhead reveals the absence of the CC inner scaffold. Scale bar: 200 nm. (f, g) Distribution of the perimeter (f) or circularity (g) of the MTDs from transversal sections of photoreceptor CC (gray) or bulge (orange). N = 1 animal. Means and standard deviations are listed in S1 Table. The data underlying all the graphs shown in the figure are included in the S1 Data file. CC, connecting cilium; EM, electron microscopy; MTD, microtubule doublet.
Fig 4
Fig 4. Fam161a mutation leads to the specific loss of the CC inner scaffold.
(a) Low magnification of expanded Fam161atm1b/tm1b retinas stained for RHODOPSIN (green) and tubulin (magenta) from P4 to P60. Scale bar: 20 μm. (b–d) Expanded Fam161atm1b/tm1b photoreceptors stained for POC5 (green, b), CEP290 (cyan, c), and LCA5 (orange, d) from P4 to P60. Note the transitory appearance of the CC inner scaffold between P7 and P10 (green arrowheads) followed by its collapse, paralleling microtubule spread. In contrast, centriole inner scaffold (white arrowheads) is retained over time. Scale bar: 500 nm. (e) Comparison of the microtubule enlargement position relative to MC proximal end between WT (magenta) and Fam161atm1b/tm1b (red) photoreceptors; ≥3 animals per time point. (f–h) Impact of the Fam161atm1b/tm1b mutant on CC inner scaffold length (POC5 staining, f), CEP290 length (g), or LCA5 start position (h); ≥3 animals per time point. (i) Percentage of CC positive for POC5 (green), CEP290 (cyan), and photoreceptor positive for LCA5 (orange) from P4 to P60 in Fam161atm1b/tm1b photoreceptors; ≥3 animals per time point. Note that the heterogeneity is found between animals and not within a single animal. (j) EM micrographs of WT (left) or Fam161atm1b/tm1b (right) CC transversal sections. Scale bar: 200 nm. (k) single particle averages of WT or Fam161atm1b/tm1b MTDs. Note that Y-links are present in both conditions (cyan arrowheads), whereas CC inner scaffold is present in WT (full green arrowhead) but absent in Fam161atm1b/tm1b (empty green arrowhead). Scale bar: 20 nm. (l) Comparison of the perimeter or the circularity of the microtubule axoneme from transversal sections of WT (gray) or Fam161atm1b/tm1b (red) photoreceptors. Note that in panels e–h and l, WT measurements are the same as presented in Fig 2E–2G and Fig 3D, 3F and 3G. Means, percentage, and standard deviations are listed in S1 Table. The data underlying all the graphs shown in the figure are included in the S1 Data file. CC, connecting cilium; EM, electron microscopy; MTD, microtubule doublet; WT, wild type.
Fig 5
Fig 5. Loss of the CC inner scaffold causes photoreceptor degeneration.
(a, b) Low magnification of expanded WT (a) or Fam161atm1b/tm1b (b) retinas stained for RHODOPSIN (green) and tubulin (magenta) at P60. Note the microtubule defects in the mutant, accompanied by outer segment collapse. Dashed lines represent the insets (1, 2, and 3) depicted in (c) and (d). Scale bar: 5 μm. (c, d) Insets from WT (c) or Fam161atm1b/tm1b (d) retinas depicted in (a) and (b), respectively. Arrowhead shows the RHODOPSIN signal entering inside the microtubules. Arrows depict the accumulation of the RHODOPSIN at the base of the CC. Scale bar: 1 μm. (e, f) Model representing mature WT (e) or Fam161atm1b/tm1b (f) photoreceptor with the CC region highlighted. Schemes representing transversal sections are depicted in the bottom right of each panel. CC, connecting cilium; WT, wild type.

Comment in

References

    1. Ramamurthy V, Cayouette M. Development and disease of the photoreceptor cilium. Clin Genet. 2009;76:137–45. doi: 10.1111/j.1399-0004.2009.01240.x - DOI - PubMed
    1. Molday RS, Moritz OL. Photoreceptors at a glance. J Cell Sci. 2015;128:4039–45. doi: 10.1242/jcs.175687 - DOI - PMC - PubMed
    1. Obata S, Usukura J. Morphogenesis of the photoreceptor outer segment during postnatal development in the mouse (BALB/c) retina. Cell Tissue Res. 1992;269:39–48. doi: 10.1007/BF00384724 - DOI - PubMed
    1. Daiger SP, Sullivan LS, Bowne SJ. Genes and mutations causing retinitis pigmentosa. Clin Genet. 2013;84:132–41. doi: 10.1111/cge.12203 - DOI - PMC - PubMed
    1. Rose AM, Sergouniotis P, Alfano G, Muspratt-Tucker N, Barton S, Moore AT, et al.. Diverse clinical phenotypes associated with a nonsense mutation in FAM161A. Eye. 2015;29:1226–32. doi: 10.1038/eye.2015.93 - DOI - PMC - PubMed

Publication types

LinkOut - more resources