. 2022 Jul 8;377(6602):eabg9302.
doi: 10.1126/science.abg9302. Epub 2022 Jul 8.

Interleukin-17 governs hypoxic adaptation of injured epithelium

Affiliations

Interleukin-17 governs hypoxic adaptation of injured epithelium

Piotr Konieczny et al. Science. .

Abstract

Mammalian cells autonomously activate hypoxia-inducible transcription factors (HIFs) to ensure survival in low-oxygen environments. We report here that injury-induced hypoxia is insufficient to trigger HIF1α in damaged epithelium. Instead, multimodal single-cell and spatial transcriptomics analyses and functional studies reveal that retinoic acid-related orphan receptor γt+ (RORγt+) γδ T cell-derived interleukin-17A (IL-17A) is necessary and sufficient to activate HIF1α. Protein kinase B (AKT) and extracellular signal-regulated kinase 1/2 (ERK1/2) signaling proximal of IL-17 receptor C (IL-17RC) activates mammalian target of rapamycin (mTOR) and consequently HIF1α. The IL-17A-HIF1α axis drives glycolysis in wound front epithelia. Epithelial-specific loss of IL-17RC, HIF1α, or blockade of glycolysis derails repair. Our findings underscore the coupling of inflammatory, metabolic, and migratory programs to expedite epithelial healing and illuminate the immune cell-derived inputs in cellular adaptation to hypoxic stress during repair.


Figures

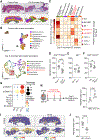
Fig. 1.
Fig. 1.. Skin-resident RORγt cells direct wound re-epithelialization.
(A) UMAP visualization of individual samples (control, n = 1443 cells; D3, n = 1997 cells; D5, n = 1486 cells). (B) Dot plot of cytokine expression in control and wounded lymphocytes. Shown is the frequency of cells expressing gene (percentage) and average expression per cluster (average). RORγt+ cells (yellow) are enriched at the edge of human (C) (n = 3, N = 1) and murine (D) (n ≥ 4, N = 3) acute wounds. Magenta, keratin (K)14; cyan, DAPI nuclei. White arrows mark RORγt cells. (E) Impaired re-epithelialization in RORγt-deficient (GFP-KI) compared with WT animals. Shown are images and quantifications of integrin α5+ (green), K14+ (red) migrating epidermal tongue from full-thickness silicone-splinted (top) and unsplinted (bottom) D3 wounds. The dashed lines and arrows mark the beginning and end of migrating tongue, respectively. White, EdU; blue, DAPI nuclei; w.b., wound bed (n ≥ 7, N = 3). (F) Wound lymphocytes have a higher frequency (percentage) and expression of proliferation genes (Mki67, Cdk1, and Top2a than control skin. (G) Wound RORγt cells actively proliferate. Shown is an immunofluorescence image of D3 wounded Rorc-EGFPTg mice after a 24-hour EdU pulse. White, EdU; blue, DAPI nuclei; green, RORγt+ cells; red, keratin (K)14 (n = 3, N = 3). (H) FTY720 treatment does not alter wound re-epithelialization (n ≥ 7, N = 3). In (C), (D), and (G), white dashed lines denote dermo-epidermal borders and yellow boxes define magnified areas. Scale bars in (C), (D), and (E), 100 μm; scale bar in (G), 50 μm. Significance was determined using a two-tailed t test and a 95% confidence interval.
Fig. 2.
Fig. 2.. RORγt+ γδT cells drive re-epithelialization through epidermal IL-17RC.
(A) Hematoxylin and eosin–stained tissue image (top) and ST plot of microarray spots (bottom) of unwounded and D3 wounded skin (unwounded, n = 1; wounded, n = 2). Scale bars, 200 μm. (B) UMAP plot and cluster annotation of ST spots based on marker genes in fig. S5. (C) γδ T/MAIT clusters are enriched in wound edge epithelium. P-value score table from MIA of D3 wounded ST clusters and CITE-seq effector lymphocyte clusters. Integrin α5+, K14+ migrating epidermal tongue length in unsplinted D3 wounds from TcrdCreER;Rorcfl/fl and Rorcfl/fl (D) (n ≥ 7, N = 3). Mr1−/− and Mr1Het (E) (n ≥ 4, N = 3). Cd4Cre/−; Rorcfl/fl and Cd4Cre/− (F) (n = 5, N = 3). (G) γδ T/MAIT cell clusters dominantly express Il17a and Il17f. Dot plot of genes from D3 wounded skin CITE-seq analysis. Frequency of cells expressing stated gene (percent) and average expression per cluster (average). (H) rmIL-17A administration augments the re-epithelialization in GFP-KI mice. Experimental schematic (left) and quantification of D3 migrating tongue length of GFP-KI skin intradermally injected with rmIL-17A or PBS (right) (n = 4, N = 2). (I) Spatial plots of Il17rc and Il17ra reveal an up-regulation of these receptors at the wound’s edge. (J) IL-17RC expression on epithelial cells drives re-epithelialization. Quantification of migrating tongue length from splinted D3 wounds Krt14Cre; Il17rcfl/fl mice (n ≥ 5, N = 2). Significance was determined using a two-tailed t test and a 95% confidence interval.
Fig. 3.
Fig. 3.. RORγt+ cells control wound edge epithelial HIF1α.
ST spots (A) and UMAP plot (B) of annotated clusters (marker genes in fig. S7) from WT and GFP-KI D3 wounded skin samples (WT, n = 2; GFP-KI, n = 3). (C) KEGG pathways enriched in WT versus GFP-KI cluster 7 spots. (D) Spatial plots of Hif1a expression in D3 WT and GFP-KI wounds. (E) WT migrating tongues have higher HIF1α expression than GFP-KI migrating tongues. Red, top, K14; yellow, top, HIF1α (pseudocolor fire, bottom); cyan, top, DAPI nuclei. Quantification of HIF1α in integrin α5+ cells from GFP-KI and WT D3 wounds (n = 6, N = 3). (F) Quantification of HIF1α in integrin α5+cells from WT and Krt14Cre; Il17rcfl/fl D3 wounds (n = 5, N = 2). (G) Pseudocolor fire view images and quantification of PIM staining in D3 WT and GFP-KI wounds (n = 4, N = 2). (H) Fiber probe measurement of unwounded and D3 wounded tissue oxygen (n ≥ 3, N = 2). (I) Impaired re-epithelialization in epithelial HIF1α-deficient animals (Hif1aEKO) compared with WT. Confocal images and corresponding quantifications of integrin α5+ (yellow), K14+ (red) migrating epidermal tongue from splinted D3 wounds. The dashed line and arrows mark the beginning and end of migrating tongue, respectively. Cyan, DAPI nuclei; w.b., wound bed (n ≥ 5, N = 3). Scale bars in (E), 50 μm; scale bars in (G) and (I), 100 μm. For (E), (G), and (I), two-tailed t test at a 95% confidence interval was used. For (H), one-way ANOVA multiple-comparisons test was used.
Fig. 4.
Fig. 4.. IL-17A induces HIF1α through epidermal IL-17RC.
(A) Intradermal injection of rmIL-17A in unwounded skin induces epidermal hyperplasia and HIF1α. Magenta, K14; yellow, HIF1α; cyan, DAPI nuclei (n = 5, N = 3). (B) Epidermal organoids cultured for 6 days at 21% O2, ± rmIL-17A stimulation for 5 days (see experimental schematic in fig. S10C) robustly up-regulate HIF1α. Quantification of HIF1α staining normalized to controls. Red, K14; green, HIF1α; white, phalloidin F actin; blue, DAPI nuclei (n = 3, N = 3). (C) rmIL-17A induced nuclear HIF1α in WT mice but not epidermal IL-17RC–deficient (Il17rcEKO) mice (n = 3, N = 2). Staining and color scheme are the same as in (A). (D) IL-17A–induced HIF1α in organoids is dependent on epidermal IL-17RC (n = 4, N = 2). (E) Epidermal response to rmIL-17A is accompanied by increased phosphorylation of S6 (p-S6Ser240/244, green) (n = 3, N = 2). (F) rmIL-17A–induced p-S6Ser240/244 (green) requires epidermal IL-17RC (n = 3, N = 2). In (E) and (F), blue, DAPI nuclei. In (A) and (C), white asterisks label autofluorescence. In (A) to (C) and (E) and (F), white dashed lines demarcate dermo-epidermal junction or organoid boundaries. Scale bars, 50 μm. For (A) to (C), two-tailed t test at a 95% confidence interval was used. For (D), two-way ANOVA multiple-comparisons test was used.
Fig. 5.
Fig. 5.. ERK/AKT signaling downstream of IL-17RC controls mTOR and HIF1α.
(A) Experimental schematic of inhibitor treatment in control and rmIL-17A–stimulated organoids. (B) rmIL-17A–treated organoids (D5) have increased pmTORS2448, p-S6KT389, and p-S6S240/244 that is diminished after 12 hours of rapamycin (Rapa) treatment. Vehicle (Veh), N = 2. (C) Rapamycin abrogates rmIL-17A–mediated HIF1α expression in normoxia (21% O2). Quantification of HIF1α staining normalized to controls (n ≥ 5, N = 4). (D) IL-17A up-regulates Hif1a transcripts through mTOR (n = 5, N = 2). (E) Inhibiting AKT (MK-2206) and/or ERK (U0126) for 3 hours blocks rmIL-17A–induced p-S6KT389, p-S6S240/244, and HIF1α (N = 2). (F) IL-17A stimulates p-S6S240/244 and HIF1α in organoids cultured under normoxic or hypoxic (2% O2) conditions (N = 3). (G) Rapamycin abrogates IL-17A–mediated HIF1α expression in hypoxia (n = 4, N = 3). (H) Schematic of proposed mechanism illustrating that AKT and ERK activation proximal of IL-17RC induces mTOR and HIFα. Chronic hypoxia inhibits mTOR and consequently HIF1α. Significance was determined using a two-way ANOVA multiple-comparisons test. In (B), (E), (F), and (G), protein quantifications are relative to the presented internal β-actin controls.
Fig. 6.
Fig. 6.. IL-17A–HIF1α-mediated metabolic reprograming fuels re-epithelialization.
(A) ST plots of hk2, Pgk1, and Slc2a1 expression in GFP-KI (n = 3) and WT (n = 2) wounds. (B) Increased expression of glycolytic enzymes after rmIL-17A treatment (normalized to control) (n = 6, N = 4). (C) rmIL-17A stimulation results in functional enhancement of glycolysis. Representative ECAR of organoids cultured in the presence or absence of rmIL-17A. There were 22 technical replicates. (D and E) IL-17A–induced expression of glycolytic enzymes is abrogated in rapamycin-treated (D) and Hif1aEKO (E) organoids (n ≥ 5, N = 2). (F and G) pseudocolor fire images and quantifications of glucose transporter 1 staining in D3 WT and Il17rcEKO (n ≥ 5, N = 2) (F) and WT and Hif1aEKO (n ≥ 4, N = 2) (G) migrating tongue. Scale bars, 100 μm. (H) Inhibition of HIF1α (BAY872243) and glycolysis (2-DG) impairs the migration of primary human keratinocytes in the presence and absence of rhIL-17A. Yellow dashed line marks scratch wound edges. Scratched areas were quantified as a percentage relative to the start area at 0 hours (n = 5, N = 3). Scale bars, 500 μm. In (B), (C), (F), and (G), two-tailed t test at a 95% confidence interval was used. In (D) and (E), two-way ANOVA multiple-comparisons test was used. In (H), one-way ANOVA was used.

Comment in

References

    1. Chovatiya R, Medzhitov R, Stress, inflammation, and defense of homeostasis. Mol. Cell 54, 281–288 (2014). doi: 10.1016/j.molcel.2014.03.030; - DOI - PMC - PubMed
    1. Eming SA, Martin P, Tomic-Canic M, Wound repair and regeneration: Mechanisms, signaling, and translation. Sci. Transl. Med 6, 265sr6 (2014). doi: 10.1126/scitranslmed.3009337; - DOI - PMC - PubMed
    1. Belkaid Y, Harrison OJ, Homeostatic immunity and the microbiota. Immunity 46, 562–576 (2017). doi: 10.1016/j.immuni.2017.04.008; - DOI - PMC - PubMed
    1. Harrison OJ et al., Commensal-specific T cell plasticity promotes rapid tissue adaptation to injury. Science 363, eaat6280 (2019). doi: 10.1126/science.aat6280; - DOI - PMC - PubMed
    1. Naik S, Larsen SB, Cowley CJ, Fuchs E, Two to Tango: Dialog between Immunity and Stem Cells in Health and Disease. Cell 175, 908–920 (2018). doi: 10.1016/j.cell.2018.08.071; - DOI - PMC - PubMed

Substances