. 2022 Jun 21;119(25):e2026733119.
doi: 10.1073/pnas.2026733119. Epub 2022 Jun 16.

High exposure of global tree diversity to human pressure

Affiliations

High exposure of global tree diversity to human pressure

Wen-Yong Guo et al. Proc Natl Acad Sci U S A. .

Abstract

Safeguarding Earth's tree diversity is a conservation priority due to the importance of trees for biodiversity and ecosystem functions and services such as carbon sequestration. Here, we improve the foundation for effective conservation of global tree diversity by analyzing a recently developed database of tree species covering 46,752 species. We quantify range protection and anthropogenic pressures for each species and develop conservation priorities across taxonomic, phylogenetic, and functional diversity dimensions. We also assess the effectiveness of several influential proposed conservation prioritization frameworks to protect the top 17% and top 50% of tree priority areas. We find that an average of 50.2% of a tree species' range occurs in 110-km grid cells without any protected areas (PAs), with 6,377 small-range tree species fully unprotected, and that 83% of tree species experience nonnegligible human pressure across their range on average. Protecting high-priority areas for the top 17% and 50% priority thresholds would increase the average protected proportion of each tree species' range to 65.5% and 82.6%, respectively, leaving many fewer species (2,151 and 2,010) completely unprotected. The priority areas identified for trees match well to the Global 200 Ecoregions framework, revealing that priority areas for trees would in large part also optimize protection for terrestrial biodiversity overall. Based on range estimates for >46,000 tree species, our findings show that a large proportion of tree species receive limited protection by current PAs and are under substantial human pressure. Improved protection of biodiversity overall would also strongly benefit global tree diversity.

Keywords: biodiversity; conservation frameworks; land use; protected areas; tree species.


Conflict of interest statement

The authors declare no competing interest.

Figures

Fig. 1.
Fig. 1.
Current protection status and pressures on tree species’ ranges for all (A) and small-range tree species (B) (the first range size quantile). Protected proportions show the proportion of each tree species‘ range within existing PAs; HMI indicates the mean Human Modification Index within a tree species’ range, overall, or just the range part within or outside PAs. Mean and median values are indicated by white and black solid lines in the violin density plots, respectively. Colored panes in yellow, pink, and purple, respectively, indicate low (0 ≤ HMI ≤ 0.1), moderate (0.1 < HMI ≤ 0.4), and high to very high (0.4 < HMI ≤ 1.0) levels of human modification (61). SI Appendix, Table S2 lists the mean, median, and first and third quantiles for each variable.
Fig. 2.
Fig. 2.
Top 17% and top 50% priority areas (A and C) according to species taxonomic, phylogenetic, and functional diversity dimensions defined by the Zonation prioritization. The Venn diagrams show overlapping and unique areas for prioritizations for the 17% target (B) and 50% target (D) based on either taxonomic, phylogenetic, or functional diversity dimensions. Colors indicate overlap between combinations of two of the three dimensions (green), between all three dimensions (yellow), or no overlap (purple).
Fig. 3.
Fig. 3.
Proportional changes in the number of tree species with (A) a certain proportion of the species range protected and (B) a certain level of human influence within the protected species range, computed for existing PAs, the top 17% priority areas, and between the top 17% and top 50% priority areas. The prioritization jointly considers taxonomic, phylogenetic, and functional diversity; results for prioritizations for taxonomic, phylogenetic, and functional diversity separately are shown in SI Appendix, Fig. S3. Ribbons represent proportional flows of species in terms of changing scores (i.e., either protection coverage [A] or human influence level [B]) between two consecutive grouping bars. (A) Protection percentage categories indicate the proportion of a species’ range inside 110-km grid cells overlapping current PAs or the top 17% or top 50% priority areas, respectively. Red dashed lines indicate mean protection percentages for all tree species, with exact values given in SI Appendix, Table S4. (B) HMI categories based on the mean HMI value for the proportion of each species’ range overlapping with existing PAs or the top 17% or top 50% priority areas. HMI values were divided into three categories following ref. representing low (0 ≤ HMI ≤ 0.1), moderate (0.1 < HMI ≤ 0.4), and high to very high (0.4 < HMI ≤ 1.0) degrees of human modification. The y axis and dashed red lines (Right) show the average HMI values across all tree species’ range proportions overlapping with either existing PAs or the top 17% or top 50% priority areas, respectively. SI Appendix, Table S4 provides exact values.
Fig. 4.
Fig. 4.
Overlap between current PAs, top-priority areas for 17% and 50% targets, and the HMI. The priority areas for tree conservation are jointly defined according to taxonomic, phylogenetic, and functional diversity. HMI is categorized into low (0 ≤ HMI ≤ 0.1), moderate (0.1 < HMI ≤ 0.4), and high to very high (0.4 < HMI ≤ 1.0) levels(61). The HMI layer is shown at a resolution of 1 km2.
Fig. 5.
Fig. 5.
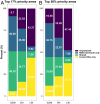
Percentages of the (A) top 17% and (B) top 50% priority areas for tree diversity covered by existing PAs or by each NGO framework (G200, BH, and LW) for global biodiversity conservation. Colors indicate overlaps between combinations. Unprotected: areas not overlapping with either PAs or a conservation priority framework; NGO framework only: areas overlapping only with the considered NGO framework; shared: areas overlapping with both PAs and a given NGO framework; current PAs only: areas only overlapping with PAs. Priority areas for tree conservation are jointly defined according to taxonomic, phylogenetic, and functional diversity.

References

    1. Pan Y., et al. , A large and persistent carbon sink in the world’s forests. Science 333, 988–993 (2011). - PubMed
    1. Enquist B. J., Abraham A. J., Harfoot M. B. J., Malhi Y., Doughty C. E., The megabiota are disproportionately important for biosphere functioning. Nat. Commun. 11, 699 (2020). - PMC - PubMed
    1. Bastin J. F., et al. , The global tree restoration potential. Science 365, 76–79 (2019). - PubMed
    1. Brockerhoff E. G., et al. , Forest biodiversity, ecosystem functioning and the provision of ecosystem services. Biodivers. Conserv. 26, 3005–3035 (2017).
    1. Gibson L., et al. , Primary forests are irreplaceable for sustaining tropical biodiversity. Nature 478, 378–381 (2011). - PubMed

Publication types