. 2022 Nov 17;140(20):2127-2141.
doi: 10.1182/blood.2022016040.

Single-cell multiomics reveal the scale of multilayered adaptations enabling CLL relapse during venetoclax therapy

Affiliations

Single-cell multiomics reveal the scale of multilayered adaptations enabling CLL relapse during venetoclax therapy

Rachel Thijssen et al. Blood. .

Abstract

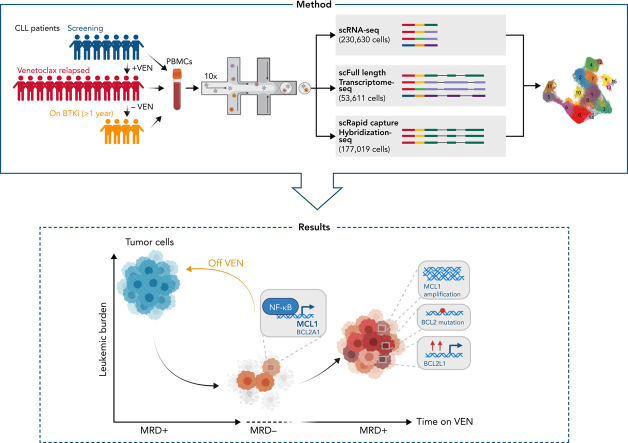
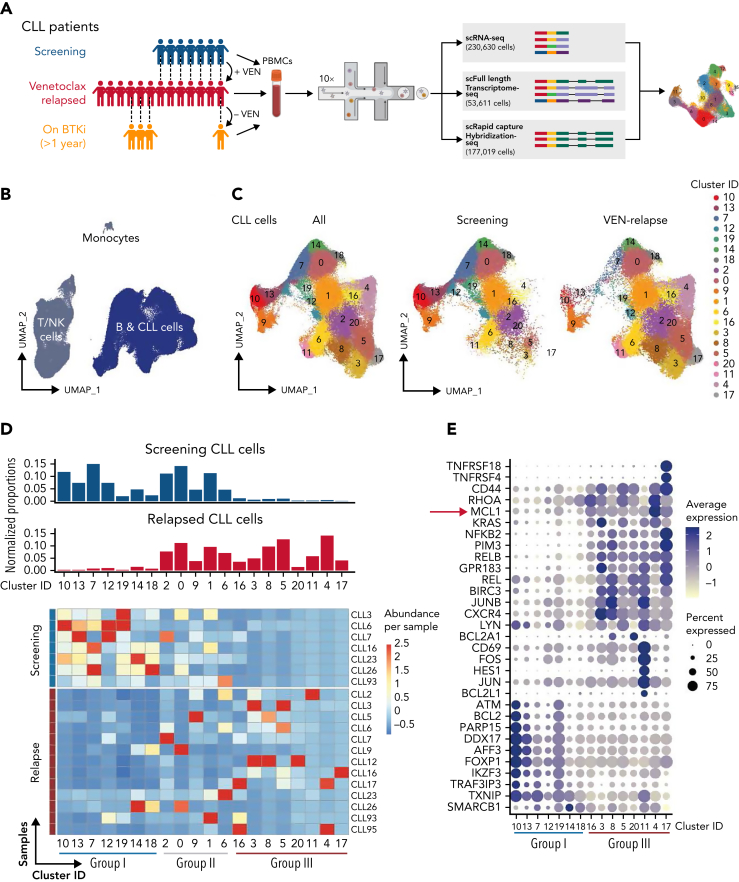
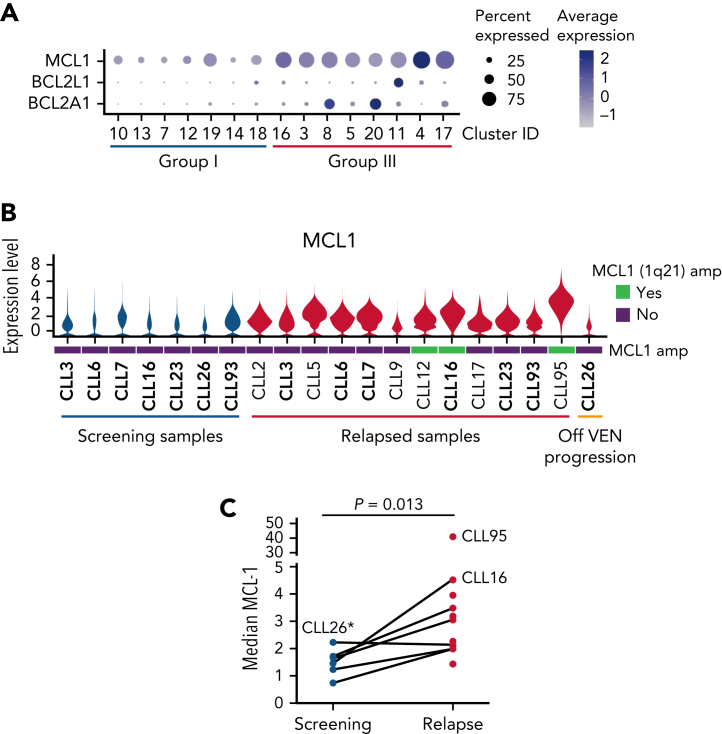
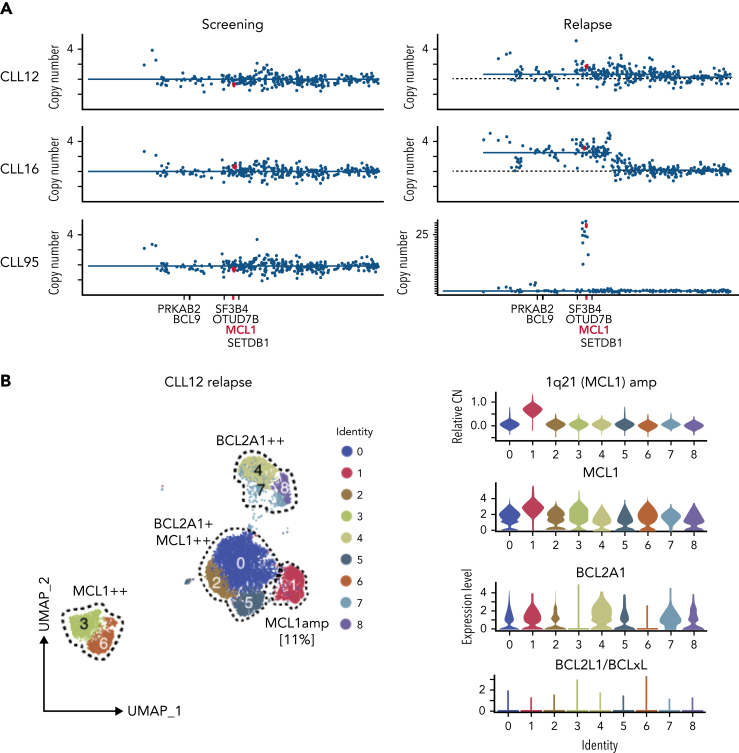
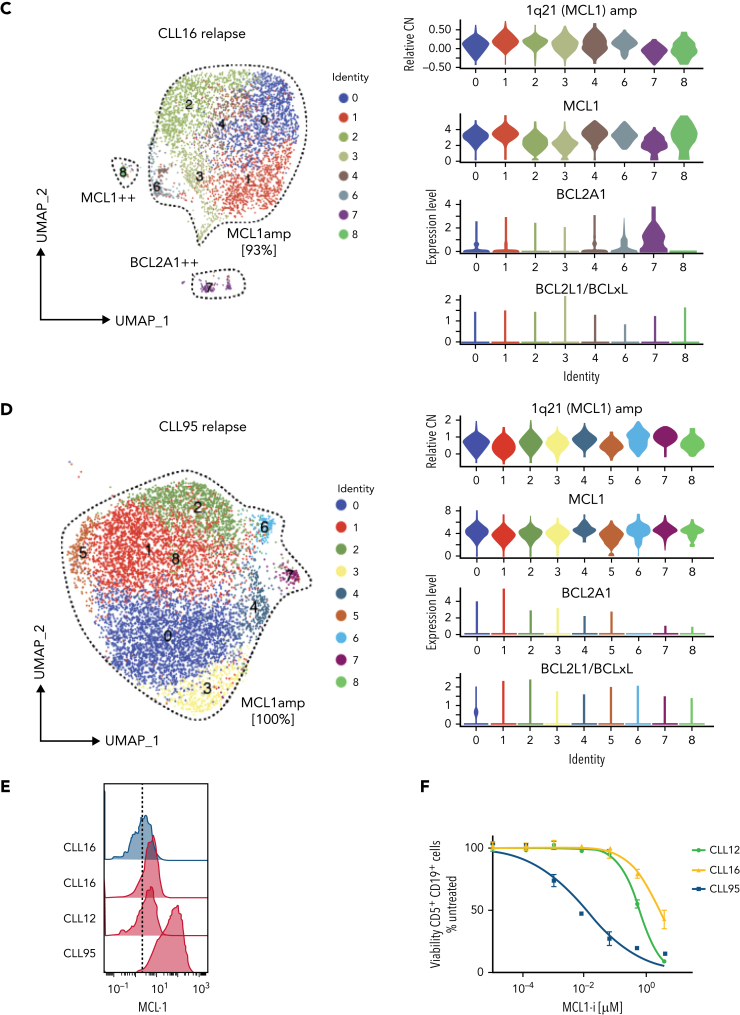
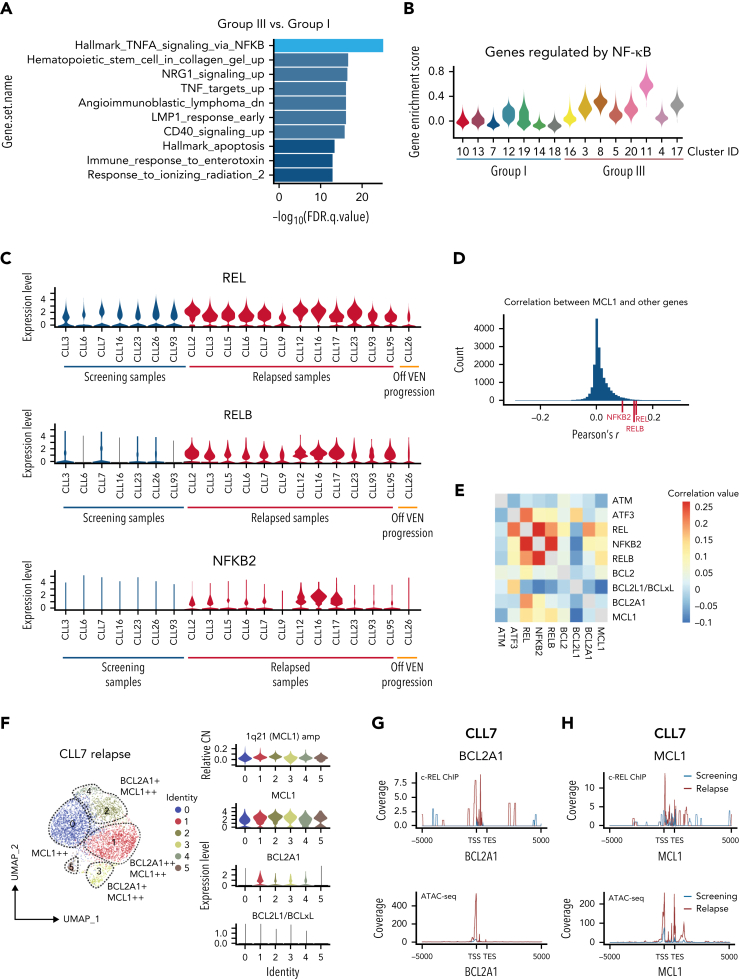
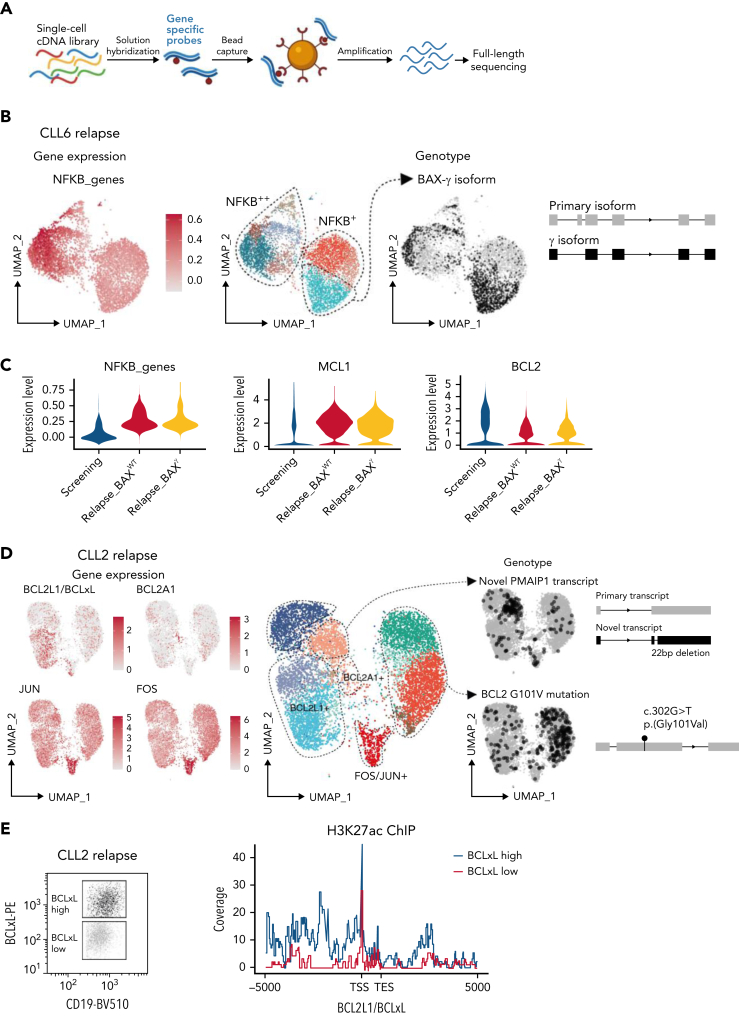
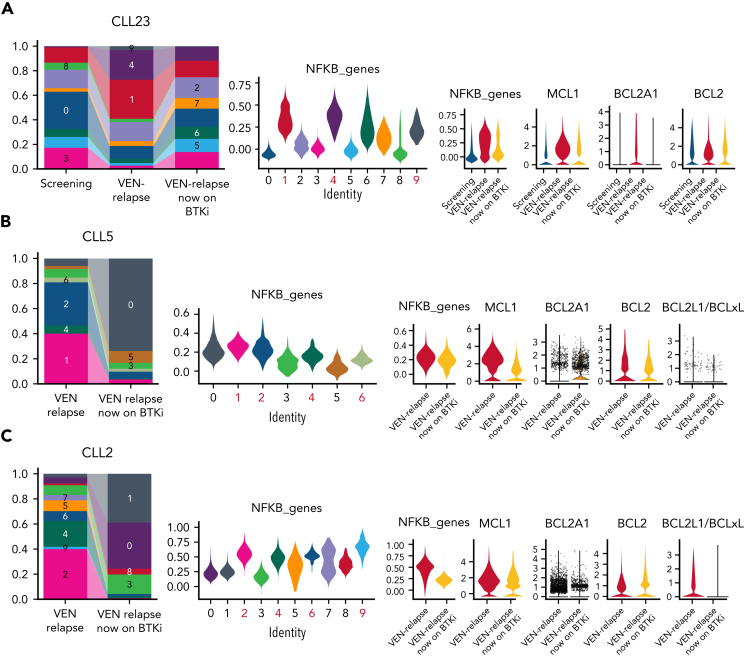
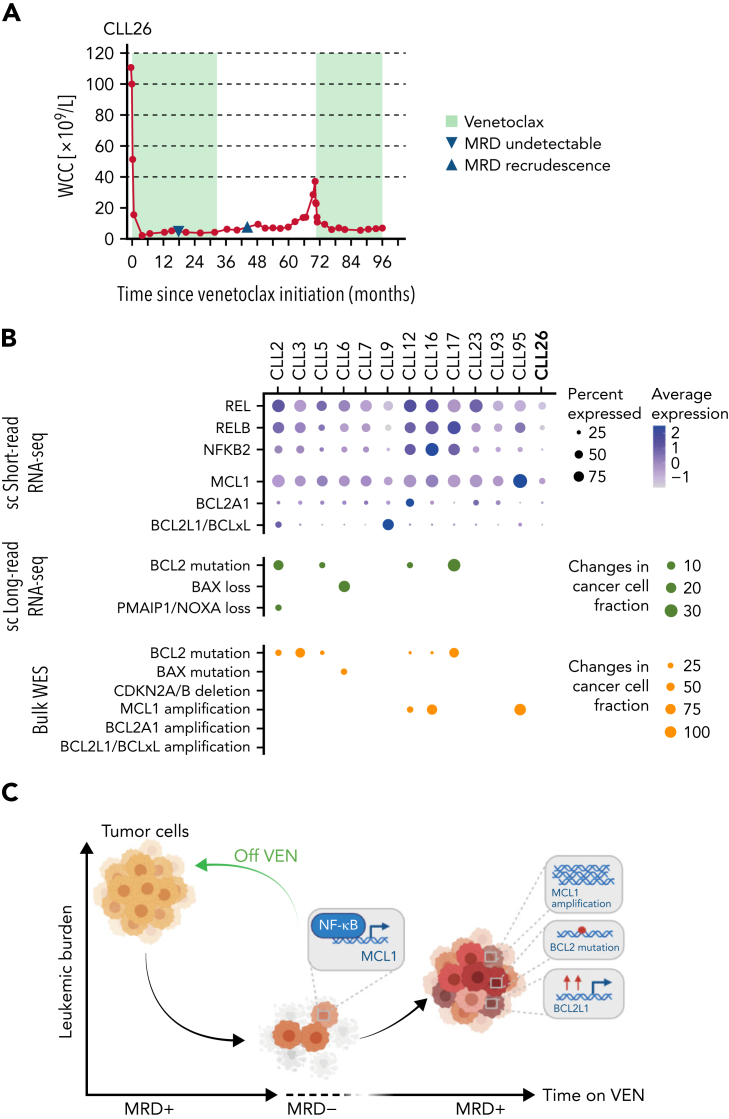
Venetoclax (VEN) inhibits the prosurvival protein BCL2 to induce apoptosis and is a standard therapy for chronic lymphocytic leukemia (CLL), delivering high complete remission rates and prolonged progression-free survival in relapsed CLL but with eventual loss of efficacy. A spectrum of subclonal genetic changes associated with VEN resistance has now been described. To fully understand clinical resistance to VEN, we combined single-cell short- and long-read RNA-sequencing to reveal the previously unappreciated scale of genetic and epigenetic changes underpinning acquired VEN resistance. These appear to be multilayered. One layer comprises changes in the BCL2 family of apoptosis regulators, especially the prosurvival family members. This includes previously described mutations in BCL2 and amplification of the MCL1 gene but is heterogeneous across and within individual patient leukemias. Changes in the proapoptotic genes are notably uncommon, except for single cases with subclonal losses of BAX or NOXA. Much more prominent was universal MCL1 gene upregulation. This was driven by an overlying layer of emergent NF-κB (nuclear factor kappa B) activation, which persisted in circulating cells during VEN therapy. We discovered that MCL1 could be a direct transcriptional target of NF-κB. Both the switch to alternative prosurvival factors and NF-κB activation largely dissipate following VEN discontinuation. Our studies reveal the extent of plasticity of CLL cells in their ability to evade VEN-induced apoptosis. Importantly, these findings pinpoint new approaches to circumvent VEN resistance and provide a specific biological justification for the strategy of VEN discontinuation once a maximal response is achieved rather than maintaining long-term selective pressure with the drug.


Conflict of interest statement

Conflict-of-interest disclosure: R.T., L.T., M.A.A., C.F., A.J., A.L.G., J.S.J., H.P., C.E.T., Q.G., A.G., T.T., T.M.D., D.H.D.G., I.J.M., M.E.R., A.W.R., and D.C.S.H. are employees of the Walter and Eliza Hall Institute, which receives milestone and royalty payments related to venetoclax. M.A.A. has received honorarium from AbbVie. C.S.T. receives research funding and honorarium from both AbbVie and Roche. J.F.S. has received research funding from AbbVie and Genentech and is a consultant and member of advisory boards for both companies. D.H.D.G. has received research funding from Servier. A.W.R. has received research funding from AbbVie. The remaining authors declare no competing financial interests.

The current affiliation for L.T. is the Broad Institute of Harvard and the Massachusetts Institute of Technology, Cambridge, MA.

The current affiliation for T.M.D. is the Hudson Institute of Medical Research, Melbourne, Australia.

The current affiliation for C.S.T. is the Alfred Hospital, Melbourne, Australia.

Figures

None
Graphical abstract
Figure 1.
Figure 1.
Single-cell multiomics reveals altered gene expression upon acquisition of VEN resistance. (A) Schematic of single-cell multiomics approach. The details of the patients are provided in supplemental Figure 1A-B. Samples taken at different time points from the same patient are connected with dotted lines. (B) UMAP projection of PBMCs (n = 230 360 cells) collected from patients or healthy donors (control samples). (C) UMAP projection specifically of the CLL cells (n = 161 499 cells) collected from patients at screening or after VEN relapse. (D) Upper: bar graphs of normalized proportions of all screening (blue) or relapsed (red) CLL cells from each cluster. Lower: heatmap portrays the abundance of CLL cells per sample (rows) in individual clusters (columns). Blue line: clusters predominantly represented in screening samples (“Group I”); red line: clusters representative of relapsed samples (“Group III”). (E) Dot plots showing a curated list of marker genes unique to the Group I screening-representative clusters or Group III relapse-representative clusters. Color intensity reflects the relative degree of gene expression and the size of the dot indicates the fraction of cells expressing that gene in that cluster, as exemplified by the higher expression of MCL1 present in more cells of the Group III clusters.
Figure 2.
Figure 2.
VEN-resistant cells display altered survival signaling. (A) Dot plots showing relative expression of prosurvival genes across Group I (predominantly cells from screening samples) and Group III (predominantly VEN-relapsed samples) clusters. (B) Violin plots showing MCL1 expression across the individual patient samples, including 3 with 1q21 (MCL1) amplification (marked as green bars). The height of the violins indicates the relative degree of MCL1 gene expression, and the width indicates the proportion of cells in a sample with increased MCL1 expression. (C) Mass cytometric analysis of MCL1 protein expression in viable (cisplatinlo) CD5+veCD19+ve CLL cells among PBMCs from screening (blue, n = 6) or relapsed samples (red, n = 11). The median expression for each sample was calculated by FlowJo. P value is from a 2-sided paired t test. Paired patient samples are joined by dotted lines. ∗Patient (CLL26) relapsed while off VEN.
Figure 3.
Figure 3.
Increased MCL1 expression at VEN relapse is only partially explained by amplification of the MCL1 gene. (A) Representation of the gained genomic regions in the 1q locus across the screening and relapsed samples from CLL12, CLL16, and CLL95 analyzed by WES. MCL1 is highlighted in red. Gray dotted lines indicate CN of 2. Blue lines indicate CN inferred from WES data. (B-D) UMAP projections (left) of CLL cells from (B) CLL12, (C) CLL16, and (D) CLL95 at relapse, with violin plots (right panels) showing inferred CN variation of 1q21 (MCL1) or relative expression of indicated prosurvival genes across the individual clusters. (E) Histograms showing mass cytometric analysis of MCL1 protein expression in viable (cisplatinlo) CD5+veCD19+ve PBMCs from screening samples from CLL16 (blue), relapsed samples from CLL16, CLL12, and CLL95 (all red). (F) PBMCs prepared at VEN-relapse were incubated in vitro for 24 hours with 0 to 4 μM S63845 (MCL1i). Viability (PI-ve) was measured in CLL cells (CD5+veCD19+ve), and data points represent the mean ± standard deviation of triplicate measurements in single experiments. CLL95 displayed marked sensitivity to MCL1i (LC50 10nM), while CLL12 and CLL16 had modest sensitivity (LC50s ∼600nM and ∼2700nM, respectively).
Figure 3.
Figure 3.
Increased MCL1 expression at VEN relapse is only partially explained by amplification of the MCL1 gene. (A) Representation of the gained genomic regions in the 1q locus across the screening and relapsed samples from CLL12, CLL16, and CLL95 analyzed by WES. MCL1 is highlighted in red. Gray dotted lines indicate CN of 2. Blue lines indicate CN inferred from WES data. (B-D) UMAP projections (left) of CLL cells from (B) CLL12, (C) CLL16, and (D) CLL95 at relapse, with violin plots (right panels) showing inferred CN variation of 1q21 (MCL1) or relative expression of indicated prosurvival genes across the individual clusters. (E) Histograms showing mass cytometric analysis of MCL1 protein expression in viable (cisplatinlo) CD5+veCD19+ve PBMCs from screening samples from CLL16 (blue), relapsed samples from CLL16, CLL12, and CLL95 (all red). (F) PBMCs prepared at VEN-relapse were incubated in vitro for 24 hours with 0 to 4 μM S63845 (MCL1i). Viability (PI-ve) was measured in CLL cells (CD5+veCD19+ve), and data points represent the mean ± standard deviation of triplicate measurements in single experiments. CLL95 displayed marked sensitivity to MCL1i (LC50 10nM), while CLL12 and CLL16 had modest sensitivity (LC50s ∼600nM and ∼2700nM, respectively).
Figure 4.
Figure 4.
Increased MCL1 expression driven by NF-κB at VEN relapse. (A) Bar plots showing pathway enrichment analysis in clusters from Group III (predominantly cells from VEN-relapsed samples) vs clusters in Group I (predominantly cells from screening samples). (B) Violin plots showing NF-κB pathway gene enrichment in Group III relapsed clusters. (C) Relative expression of REL, RELB, and NFKB2 in screening (n = 7; on left) or relapse (n = 13) samples; 1 patient (CLL26; on right) progressed while off VEN. (D) Pearson correlation coefficients were calculated between MCL1 and all other genes. The r score between MCL1 and REL, RELB, or NFKB2 are indicated with red ticks at the bottom. (E) Heatmap showing the correlation in expression between the indicated genes in the relapsed samples. Red shades indicate stronger positive correlations. (F) UMAP projections (left) of CLL cells from CLL7 at relapse, with violin plots (right panels) showing inferred CN variation of 1q21 (MCL1) or relative expression of indicated prosurvival genes across the individual clusters. (G-H) c-REL ChIP and chromatin accessibility at the BCL2A1 (G) and MCL1 (H) loci 5000 kb upstream of the transcriptional start site (TSS) or 5000 kb downstream of the transcriptional end site (TES) in purified CLL cells from screening (blue) or relapsed (red) samples from CLL7.
Figure 5.
Figure 5.
Multiple mechanisms drive VEN resistance even within a patient. (A) Schematic of RaCH-seq workflow. (B) CLL cells from CLL6 at relapse with altered gene expression (left), cluster assignments (middle), and BAXγ isoform (right). (C) Violin plots showing expression of NF-κB genes (left), MCL1 (middle), and BCL2 (right) for CLL6 screening or at relapse, with or without BAXγ. (D) CLL cells from CLL2 at relapse showing expression for the indicated genes (left, in red), with cluster assignments (middle), and RaCH-seq data for variants of interest (right, in black). (E) H3K27ac ChIP at the BCLxL locus in flow-sorted (left) CD19+veCD5+ve BCLxLhi (blue) or BCLxLlo (red) cells from CLL2; data representative of 2 independent experiments.
Figure 6.
Figure 6.
Altered transcriptional profiles at relapse dissipate after cessation of VEN therapy. (A) Bar plots (left) showing the proportion of CLL cells for each cluster (supplemental Figure 9A) from CLL23 samples collected at screening, after relapse while on VEN, and after subsequently switching to BTKi. Violin plots (middle; NF-κB high clusters marked in red) showing the expression of NF-κB genes for each cluster are shown on the left. Violin plots (right) showing NFKB genes, MCL1, BCL2A1, or BCL2 expression at different treatment stages for CLL23. (B-C) Bar plots (left) showing the proportion of CLL cells for each cluster (supplemental Figure 9B-C) from (B) CLL5 or (C) CLL2 samples collected at relapse while on VEN and after subsequently switching to BTKi. Violin plots (middle) showing the expression of NF-κB genes for each cluster are shown on the left. Violin plots (right) showing NFKB genes, MCL1, BCL2A1, BCL2, or BCLxL expression at different treatment stages for (B) CLL5 or (C) CLL2.
Figure 7.
Figure 7.
Single-cell multiomics approach reveals multilayered changes driving VEN resistance. (A) PB white cell counts of CLL26 during VEN treatment, following VEN discontinuation, and subsequent VEN retreatment when CLL recurred. MRD undetectable: first confirmation of PB undetectable MRD (CLL cells <0.01% of leukocytes), MRD recrudescence: first confirmation of MRD positivity in PB (CLL cells ≥0.01% of leukocytes). MRD, measurable residual disease. (B) Dot plots summarizing the single-cell RNA-seq, single-cell long-read sequencing, and WES changes observed in patient samples at VEN-relapse. For the single-cell short-read RNA-sequencing, color indicates relative degrees of gene expression, and the size of the dot indicates the proportion of cells with altered expression in a patient sample. For single-cell long-read RNA-seq and WES, the size of the dot indicates the fraction of cells harboring the mutation in a patient sample; no dots: not detected. (C) Schematic illustration of the study highlights.

Comment in

References

    1. Leverson JD, Sampath D, Souers AJ, et al. Found in translation: how preclinical research is guiding the clinical development of the BCL2-selective inhibitor venetoclax. Cancer Discov. 2017;7(12):1376–1393. - PMC - PubMed
    1. Roberts AW, Wei AH, Huang DCS. BCL2 and MCL1 inhibitors for hematologic malignancies. Blood. 2021;138(13):1120–1136. - PubMed
    1. Diepstraten ST, Anderson MA, Czabotar PE, Lessene G, Strasser A, Kelly GL. The manipulation of apoptosis for cancer therapy using BH3-mimetic drugs. Nat Rev Cancer. 2022;22(1):45–64. - PubMed
    1. Souers AJ, Leverson JD, Boghaert ER, et al. ABT-199, a potent and selective BCL-2 inhibitor, achieves antitumor activity while sparing platelets. Nat Med. 2013;19(2):202–208. - PubMed
    1. Roberts AW, Davids MS, Pagel JM, et al. Targeting BCL2 with venetoclax in relapsed chronic lymphocytic leukemia. N Engl J Med. 2016;374(4):311–322. - PMC - PubMed

Publication types

MeSH terms

Substances