. 2022 Aug 25;140(8):875-888.
doi: 10.1182/blood.2021015325.

Aberrant EVI1 splicing contributes to EVI1-rearranged leukemia

Affiliations

Aberrant EVI1 splicing contributes to EVI1-rearranged leukemia

Atsushi Tanaka et al. Blood. .

Abstract

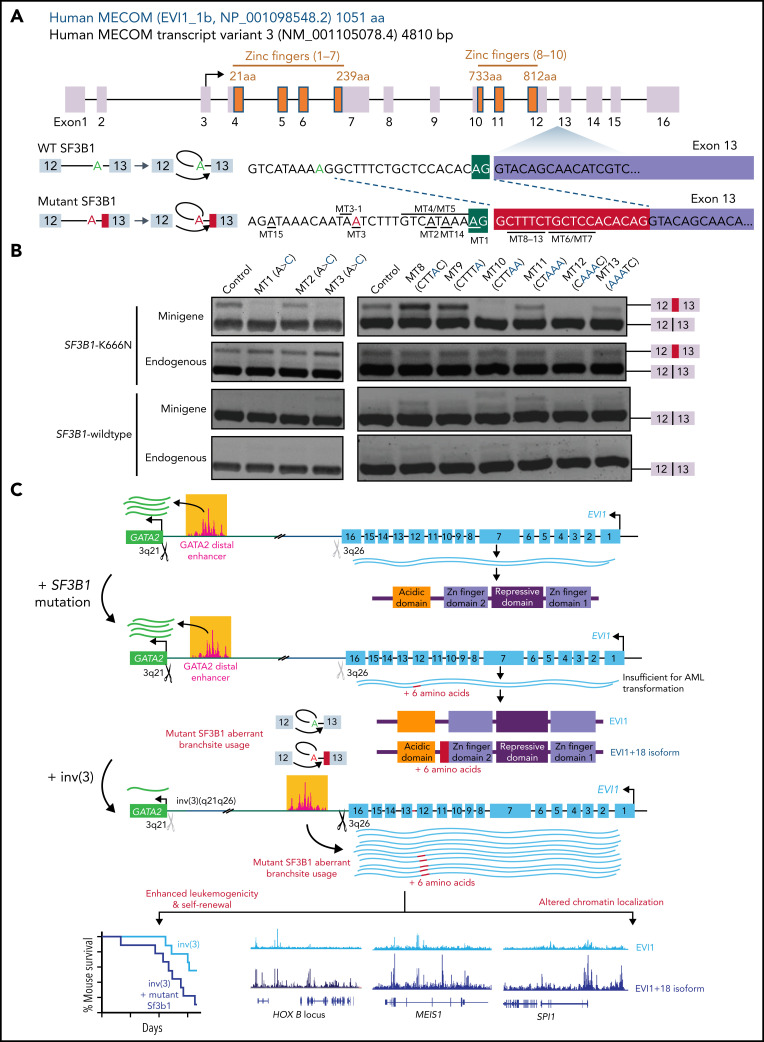
Detailed genomic and epigenomic analyses of MECOM (the MDS1 and EVI1 complex locus) have revealed that inversion or translocation of chromosome 3 drives inv(3)/t(3;3) myeloid leukemias via structural rearrangement of an enhancer that upregulates transcription of EVI1. Here, we identify a novel, previously unannotated oncogenic RNA-splicing derived isoform of EVI1 that is frequently present in inv(3)/t(3;3) acute myeloid leukemia (AML) and directly contributes to leukemic transformation. This EVI1 isoform is generated by oncogenic mutations in the core RNA splicing factor SF3B1, which is mutated in >30% of inv(3)/t(3;3) myeloid neoplasm patients and thereby represents the single most commonly cooccurring genomic alteration in inv(3)/t(3;3) patients. SF3B1 mutations are statistically uniquely enriched in inv(3)/t(3;3) myeloid neoplasm patients and patient-derived cell lines compared with other forms of AML and promote mis-splicing of EVI1 generating an in-frame insertion of 6 amino acids at the 3' end of the second zinc finger domain of EVI1. Expression of this EVI1 splice variant enhanced the self-renewal of hematopoietic stem cells, and introduction of mutant SF3B1 in mice bearing the humanized inv(3)(q21q26) allele resulted in generation of this novel EVI1 isoform in mice and hastened leukemogenesis in vivo. The mutant SF3B1 spliceosome depends upon an exonic splicing enhancer within EVI1 exon 13 to promote usage of a cryptic branch point and aberrant 3' splice site within intron 12 resulting in the generation of this isoform. These data provide a mechanistic basis for the frequent cooccurrence of SF3B1 mutations as well as new insights into the pathogenesis of myeloid leukemias harboring inv(3)/t(3;3).


Figures

None
Graphical abstract
Figure 1.
Figure 1.
Frequent cooccurrence of SF3B1 mutations in myeloid malignancies with inv(3)(q21q26) or t(3;3)(q21q26). (A) Oncoprint of recurrently mutated genes in 109 patients with EVI1-rearranged (EVI1-r) myeloid neoplasms. Horizontal bars show the mutational frequency of each gene. Gray color indicates data not available. (B) Frequency (indicated by bubble size) and statistical enrichment (indicated by color gradient) of mutations (x-axis) across AML (y-axis; inv(3)/t(3;3) patients from panel A, n = 109; BeatAML study, n = 622; TCGA AML study, n = 200). P values of Fisher's exact test are color-coded. (C) VAF of mutations in SF3B1 and RAS-associated genes relative to mutations in transcriptional factors, chromatin modifiers, RNA splicing factors in patients with EVI1-r myeloid neoplasm. (D) Oncoprint of recurrently mutated genes in EVI1-r leukemia cell lines.
Figure 2.
Figure 2.
SF3B1 mutations enhance the leukemogenicity of hematopoietic cells expressing the inv(3)(q21q26) allele. (A) Schema of generation of CD45.2 Mx1-cre inv(3) Sf3b1K700E/WT mice (left) and schema of in vitro and in vivo analyses of hematopoiesis from these mice and single-mutant controls. (B) Number of myeloid colonies on first to fifth plating of Mx1-cre inv(3) Sf3b1K700E/WT mice and controls. (C) Box-and-whisker plots of white blood cell count (WBC), hemoglobin, and mean corpuscular volume (MCV) from CD45.1 recipient mice following 8.5 months of transplantation of CD45.2 mice from panel A. For box-and-whiskers plots throughout, bar indicates median, box edges first and third quartile values, and whisker edges minimum and maximum values. (D) Representative fluorescence-activated cell sorter plots of CD45.2+ LSK (lineage-negative Sca1+ and c-Kit+) and LK (lineage-negative Sca1 and c-Kit+) cells from BM of CD45.1 recipient mice at 4 months posttransplant. % of cells within gate is shown. (E) Box-and-whisker plots of percentage of BM CD45.2+ LSK, multipotent progenitor cells 2 and 3 (MPP2 and MPP3, respectively), and common myeloid progenitor (CMP) cells. (F) % of CD11b+Gr1+ and B220+ cells among CD45.2+ cells in peripheral blood over time following transplantation. Mean ± standard deviation are shown. (G) Representative hematoxylin-and-eosin stain (original magnification ×100) of spleen of CD45.1 primary recipient mice. Scale bars, 400 μm. (H) Kaplan-Meier survival curve of primary CD45.1 recipient mice. P values were calculated by log-rank test. (I) Kaplan-Meier survival curve of secondarily transplanted CD45.1 recipient mice following sublethal irradiation (4.5 Gy). P values were calculated by 2-sided Student t test or log-rank test. *P < .05, **P < .01, ***P < .001, and ****P < .0001. chr., chromosome.
Figure 3.
Figure 3.
Combined impact of mutations in SF3B1 and inv(3)/t(3;3) on gene expression and RNA splicing. (A) Similarity matrix and hierarchical clustering of 4 groups (Mx1-Cre control, Mx1-Cre inv(3), Mx1-Cre Sf3b1K700E/WT, and Mx1-Cre inv(3) Sf3b1K700E/WT) by differential gene expression. Three samples were independently collected in each group. (B) Principal component (PC) analysis of gene expression from 12 samples (4 groups, biologically triplicated). (C) Overlap of differentially expressed genes compared with Mx1-Cre control. (D) Significantly dysregulated pathways. P values are color-coded. (E) Significantly dysregulated pathways. Number of genes and statistical significance (−log10FDR) were shown. The impact of SF3B1 mutation on gene expression was analyzed under the condition with or without EVI1 rearrangement. (F) Overlap of differentially spliced genes compared with AML without SF3B1 mutation or EVI1 rearrangement. (G) Aberrant splicing detected in AML with EVI1 rearrangement and SF3B1 mutations. x-axis and y-axis indicate the percent spliced in (ψ) of each splicing event in the presence/absence of genetic alterations. Alternate splice sites, mutually exclusive exons, retained introns, or cassette exons are shown when P < .01. Red and blue dots represent individual splicing events or coding genes that are promoted or repressed in each condition; green dots are shown when the difference in percent spliced is <10%. The number of aberrantly spliced genes is indicated in blue or red.
Figure 4.
Figure 4.
SF3B1 mutations promote expression of a novel EVI1 isoform that enhances EVI1’s self-renewal capacity. (A) Schematic of EVI1 protein with 6 amino acid insertion (top) and representative RNA-seq coverage plot of SF3B1 WT and mutated inv(3) AML (bottom). (B) Fraction of the novel transcript (EVI1+18) compared with normal transcript in SF3B1 WT and SF3B1 mutated EVI1-rearranged AML. (C) RT-PCR illustrating the inclusion of intronic sequences in SF3B1 K700E-transduced MEL270 cells (top, red) and endogenously SF3B1 K700E harboring leukemia cells (bottom, red). (D) Sanger sequencing of complementary DNA (cDNA) arising from the top band in panel C. The nucleotide sequences and corresponding amino acids are indicated. (E) RT-PCR of human EVI1 and mouse Gapdh using cDNA derived from peripheral blood of 4 murine models. (F) Number of myeloid colonies on first to fourth plating of c-Kit+ BM cells transduced with empty vector (control), EVI1 (WT), or EVI1+18 cDNA (left). Representative images (right) of the sixth colony. (G) Genomic distribution of anti-EVI1 ChIP-seq peaks. (H) Coverage tracks showing EVI1 ChIP-seq occupancy at the indicated genomic loci. P values were calculated by 2-sided Student t test. *P < .05, **P < .01, ***P < .001, and ****P < .0001.
Figure 5.
Figure 5.
Cis elements within EVI1 required for generation of the EVI1+18 bp splice variant by mutant SF3B1. (A) EVI1 gene structure and protein domains (top). Inset illustrates the transcripts when +18 nucleotides (red rectangle) are excluded (top) or included (bottom). Green A and red A indicate the branchpoint for canonical and aberrant transcripts, respectively. Single underlining indicates sequence motifs that were subsequently mutated in the minigene assay (each individual minigene construct is named “MT1” to “MT13”). aa, amino acid. (B) RT-PCR analysis of the +18 nucleotides inclusion in a minigene (top) or endogenous (bottom) context following transfection of minigenes with the illustrated mutations into SF3B1-K666N knocked-in K562 cells and SF3B1-WT K562 cells. (C) Schematic of the model proposed by which EVI1 rearrangements and SF3B1 mutations promote leukemia development. As previously demonstrated, structural rearrangements at chromosome 3q reposition the GATA2 distal enhancer to upregulate EVI1 expression while simultaneously downregulating GATA2. As shown in this study, approximately one-third of patients with EVI1 rearrangements harbor concomitant change-of-function mutations in SF3B1, which promote use of an aberrant intron-proximal branch site within intron 12 of EVI1. This splicing alteration generates a stable unannotated transcript of EVI1 (“EVI1+18”), which is translated to express an EVI1 protein with insertion of 6 amino acids at the C-terminal end of the second ZF domain of EVI1. The EVI1+18 isoform is expressed whenever any recurrent cancer hotspot mutations in SF3B1 is present in cells with human EVI1 expression. Although EVI1+18 is not sufficient for leukemia transformation on its own, EVI1+18 enhances leukemogenicity in the setting of the EVI1 rearrangement and alters the chromatin localization of EVI1 to loci well known to be involved in leukemia development (such as MEIS1 and the HOXB locus).

Comment in

References

    1. Sun J, Konoplev SN, Wang X, et al. . De novo acute myeloid leukemia with inv(3)(q21q26.2) or t(3;3)(q21;q26.2): a clinicopathologic and cytogenetic study of an entity recently added to the WHO classification. Mod Pathol. 2011;24(3): 384-389. - PubMed
    1. Lugthart S, Gröschel S, Beverloo HB, et al. . Clinical, molecular, and prognostic significance of WHO type inv(3)(q21q26.2)/t(3;3)(q21;q26.2) and various other 3q abnormalities in acute myeloid leukemia. J Clin Oncol. 2010;28(24):3890-3898. - PubMed
    1. Cui W, Sun J, Cotta CV, Medeiros LJ, Lin P. Myelodysplastic syndrome with inv(3)(q21q26.2) or t(3;3)(q21;q26.2) has a high risk for progression to acute myeloid leukemia. Am J Clin Pathol. 2011;136(2): 282-288. - PubMed
    1. Rogers HJ, Vardiman JW, Anastasi J, et al. . Complex or monosomal karyotype and not blast percentage is associated with poor survival in acute myeloid leukemia and myelodysplastic syndrome patients with inv(3)(q21q26.2)/t(3;3)(q21;q26.2): a Bone Marrow Pathology Group study. Haematologica. 2014;99(5):821-829. - PMC - PubMed
    1. Gröschel S, Lugthart S, Schlenk RF, et al. . High EVI1 expression predicts outcome in younger adult patients with acute myeloid leukemia and is associated with distinct cytogenetic abnormalities. J Clin Oncol. 2010;28(12):2101-2107. - PubMed

Publication types

Substances