. 2022 Jul 6;3(4):330-345.
doi: 10.1158/2643-3230.BCD-21-0155.

Convergent Clonal Evolution of Signaling Gene Mutations Is a Hallmark of Myelodysplastic Syndrome Progression

Affiliations

Convergent Clonal Evolution of Signaling Gene Mutations Is a Hallmark of Myelodysplastic Syndrome Progression

Andrew J Menssen et al. Blood Cancer Discov. .

Abstract

Progression from myelodysplastic syndromes (MDS) to secondary acute myeloid leukemia (AML) is associated with the acquisition and expansion of subclones. Our understanding of subclone evolution during progression, including the frequency and preferred order of gene mutation acquisition, remains incomplete. Sequencing of 43 paired MDS and secondary AML samples identified at least one signaling gene mutation in 44% of MDS and 60% of secondary AML samples, often below the level of standard sequencing detection. In addition, 19% of MDS and 47% of secondary AML patients harbored more than one signaling gene mutation, almost always in separate, coexisting subclones. Signaling gene mutations demonstrated diverse patterns of clonal evolution during disease progression, including acquisition, expansion, persistence, and loss of mutations, with multiple patterns often coexisting in the same patient. Multivariate analysis revealed that MDS patients who had a signaling gene mutation had a higher risk of AML progression, potentially providing a biomarker for progression.

Significance: Subclone expansion is a hallmark of progression from MDS to secondary AML. Subclonal signaling gene mutations are common at MDS (often at low levels), show complex and convergent patterns of clonal evolution, and are associated with future progression to secondary AML. See related article by Guess et al., p. 316 (33). See related commentary by Romine and van Galen, p. 270. This article is highlighted in the In This Issue feature, p. 265.


Figures

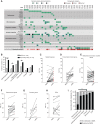
Figure 1. Signaling gene mutations are significantly enriched at secondary AML compared with MDS using paired samples. A, Heat map representation of predicted protein-altering mutations recurrent in myeloid malignancies among 44 secondary AML (sAML) samples detected using standard sequencing. Each column represents an individual patient and each row a gene, gene mutations are indicated by colored cells, and gene categories are on the left. Cytogenetic status is indicated in the bottom row. Mutations detected in Tyr kinase genes: EPHA10, TYK2, CSF1R; RAS pathway genes: NRAS, NF1, CBL, PTPN11, and PTPRN; Cohesin genes: SMC1A, SMC3, STAG2, RAD21. B, The percentage of unpaired MDS (white) or secondary AML (black) samples with a mutation in each functional gene category (categories defined in A with each gene assigned to only one category) detected using standard sequencing. C–H, Gene mutations identified in 44 secondary AML samples using standard sequencing were sequenced in the paired, antecedent 44 MDS samples using error-corrected sequencing. Each data point represents one mutation. Secondary AML mutations not detected at MDS are indicated by a red dot. I, Summary of the secondary AML mutations that were detected in MDS samples using error-corrected sequencing based on gene category. UPN, unique patient number. Fisher exact test; *, P < 0.05; ****, P < 0.0001.
Figure 1.
Signaling gene mutations are significantly enriched at secondary AML compared with MDS using paired samples. A, Heat map representation of predicted protein-altering mutations recurrent in myeloid malignancies among 43 secondary AML (sAML) samples detected using standard sequencing. Each column represents an individual patient and each row a gene, gene mutations are indicated by colored cells, and gene categories are on the left. Cytogenetic status is indicated in the bottom row. Mutations detected in Tyr kinase genes: TYK2, CSF1R; RAS pathway genes: NRAS, NF1, CBL, PTPN11, and PTPRN; Cohesin genes: SMC1A, SMC3, STAG2, RAD21. B, The percentage of unpaired MDS (white) or secondary AML (black) samples with a mutation in each functional gene category (categories defined in A and Supplementary Table S2 with each gene assigned to only one category) detected using standard sequencing. C–H, Gene mutations identified in 43 secondary AML samples using standard sequencing were sequenced in the paired, antecedent MDS samples using error-corrected sequencing. Each data point represents one mutation. Secondary AML mutations not detected at MDS are indicated by a red dot. I, Summary of the secondary AML mutations that were detected in MDS samples using error-corrected sequencing based on gene category. UPN, unique patient number. Fisher exact test; *, P < 0.05; **, P < 0.01; ****, P < 0.0001.
Figure 2. Whole-genome sequencing reveals the temporal acquisition of transcription factor and signaling gene mutations in subclones. A–C, Clonal analysis of enhanced whole-genome sequencing (whole-genome sequencing with additional sequencing coverage of coding bases; i.e., exome) results from 12 paired MDS and secondary AML (sAML) samples, and validation sequencing at serial time points, identifies that both transcription factor (e.g., RUNX1 and CEBPA) and signaling gene (e.g., NRAS, PTPN11, and FLT3) mutations typically occur in subclones derived from the founding clone (green). Gene names listed more than once had multiple unique mutations detected, either in the same clone or separate clones as indicated by the color. Left, each point on the plot represents one detected mutation and the VAF of each mutation is plotted at MDS and sAML and clustering of individual mutations define clones that are indicated by a different color. Mutations present in the founding clone (green) are present in subclones derived from the founding clone. Right, clonal evolution from MDS to sAML is imputed from the clustering of mutation VAFs over time. The distance between the dashed lines is proportional to 100% of the bone marrow cells. When transcription factor and signaling gene mutations coexist in the same patient, the transcription factor gene mutation is typically acquired prior to the signaling gene mutation (A, B). D, The percentage of mutations acquired in a subclone (gray) based on whole-genome sequencing is shown for the six commonly mutated gene categories, with signaling genes occurring in subclones (n = 12 patients; 36 total subclones). E, Subclonal transcription factor and signaling gene mutations typically expand during progression from MDS to secondary AML. Each point represents an individual mutation. F, The percentage of bone marrow cells (calculated as twice the VAF for heterozygous mutations) harboring founding clone and subclone mutations at MDS and secondary AML for 12 patients with paired whole-genome sequencing. Up to five subclones were detected in at least one sample and were numbered based on the order of acquisition. The size of the founding clone does not significantly change during disease progression (green). However, the initial subclone (orange) that is often detectable at MDS presentation expands during disease progression. Additional subclones (purple) that are acquired after MDS presentation expand significantly during disease progression and typically contain signaling gene mutations. Clonal assignments were performed using sciClone and ClonEvol software packages. Error bars, SD. VAF, variant allele frequency; D, day number of the banked sample relative to first banking (D0). UPN, unique patient number.
Figure 2.
Whole-genome sequencing reveals the temporal acquisition of transcription factor and signaling gene mutations in subclones. A–C, Clonal analysis of enhanced whole-genome sequencing (whole-genome sequencing with additional sequencing coverage of coding bases; i.e., exome) results from 12 paired MDS and secondary AML (sAML) samples, and validation sequencing at serial time points, identifies that both transcription factor (e.g., RUNX1 and CEBPA) and signaling gene (e.g., NRAS, PTPN11, and FLT3) mutations typically occur in subclones derived from the founding clone (green). Gene names listed more than once had multiple unique mutations detected, either in the same clone or separate clones as indicated by the color. Left, each point on the plot represents one detected mutation and the VAF of each mutation is plotted at MDS and sAML and clustering of individual mutations define clones that are indicated by a different color. Mutations present in the founding clone (green) are present in subclones derived from the founding clone. Right, clonal evolution from MDS to sAML is imputed from the clustering of mutation VAFs over time. The distance between the dashed lines is proportional to 100% of the bone marrow cells. When transcription factor and signaling gene mutations coexist in the same patient, the transcription factor gene mutation is typically acquired prior to the signaling gene mutation (A, B). D, The percentage of mutations acquired in a subclone (gray) based on whole-genome sequencing is shown for the six commonly mutated gene categories, with signaling genes occurring in subclones (n = 12 patients; 36 total subclones). E, Subclonal transcription factor and signaling gene mutations typically expand during progression from MDS to secondary AML. Each point represents an individual mutation. F, The percentage of bone marrow cells (calculated as twice the VAF for heterozygous mutations) harboring founding clone and subclone mutations at MDS and secondary AML for 12 patients with paired whole-genome sequencing. Up to five subclones were detected in at least one sample and were numbered based on the order of acquisition. The size of the founding clone does not significantly change during disease progression (green). However, the initial subclone (orange) that is often detectable at MDS presentation expands during disease progression. Additional subclones (purple) that are acquired after MDS presentation expand significantly during disease progression and typically contain signaling gene mutations. Clonal assignments were performed using sciClone and ClonEvol software packages. Error bars, SD. VAF, variant allele frequency; D, day number of the banked sample relative to first banking (D0). UPN, unique patient number.
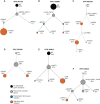
Figure 3. Single-cell DNA sequencing identifies the convergent clonal evolution of signaling gene mutations in secondary AML. Single-cell sequencing of six secondary AML samples containing 17 signaling gene mutations. A–C, Transcription factor gene mutations (blue) are acquired prior to RAS family signaling gene mutations (orange). A, B, D–F, When multiple RAS family signaling gene mutations occur in a sample, signaling gene mutations occurred in parallel subclones (i.e., convergent clonal evolution of signaling gene mutations). C, Only one case had two signaling gene mutations in the same cell. Mutations in genes recurrently mutated in myeloid malignancy (see Fig. 1A) other than signaling or transcription factor genes are colored gray. Percentages are the fraction of cells in a sample with a genotype and the circle areas are proportional to the fraction of cells containing the mutation. Clonal architecture was determined using Tapestri Insights software (MissionBio) and manual review.
Figure 3.
Single-cell DNA sequencing identifies the convergent clonal evolution of signaling gene mutations in secondary AML. Single-cell sequencing of six secondary AML samples containing 17 signaling gene mutations. A–C, Transcription factor gene mutations (blue) are acquired prior to RAS family signaling gene mutations (orange). A, B, D–F, When multiple RAS family signaling gene mutations occur in a sample, signaling gene mutations occurred in parallel subclones (i.e., convergent clonal evolution of signaling gene mutations). C, Only one case had two signaling gene mutations in the same cell. Mutations in genes recurrently mutated in myeloid malignancy (see Fig. 1A) other than signaling or transcription factor genes are colored gray. Percentages are the fraction of cells in a sample with a genotype and the circle areas are proportional to the fraction of cells containing the mutation. Clonal architecture was determined using Tapestri Insights software (MissionBio) and manual review.
Figure 4. Signaling gene mutations are common and often present below the level of detection of standard sequencing in MDS and secondary AML patient samples. Error-corrected and capture sequencing identified 92 mutations in signaling genes in 44 patients. 77 and 39 signaling genes were mutated in sAML and MDS samples, respectively, with 24 signaling genes mutated in both MDS and sAML samples. A, 53 of 77 (69%) signaling gene mutations that were detected at sAML were detected only in the sAML sample. B, 21 signaling gene mutations that were detected at sAML were also detected in the paired MDS sample. C, 15 of 77 signaling gene mutations were detected at MDS but not in the paired secondary AML sample. D, Of the 92 detected signaling gene mutations, 53 were detected only in the sAML sample, 24 were detected in both MDS and sAML paired samples, and 15 were detected only in the MDS sample. E, Percentage of MDS or sAML patients with a detected signaling gene mutation segregated by mutation VAF.
Figure 4.
Signaling gene mutations are common and often present below the level of detection of standard sequencing in MDS and secondary AML patient samples. Error-corrected and capture sequencing identified 90 mutations in signaling genes in 43 patients (including 4 FLT3-ITD mutations; 1 in sAML only and 3 in MDS and sAML categories shown in E). A, 50 signaling gene mutations that were detected at sAML were detected only in the sAML sample. B, 21 signaling gene mutations that were detected at sAML were also detected in the paired MDS sample. C, 15 signaling gene mutations were detected at MDS but not in the paired secondary AML sample. D, Percentage of MDS or sAML patients with a detected signaling gene mutation segregated by mutation VAF. E, Of the 90 detected signaling gene mutations, 51 were detected only in the sAML sample, 24 were detected in both MDS and sAML paired samples, and 15 were detected only in the MDS sample.
Figure 5. Complex clonal evolution of signaling gene mutations during disease progression is common and a hallmark of patients with multiple mutations. A, The number of MDS patients who had zero, one, or more than one signaling gene mutation detected. B, The number of sAML patients who had zero, one, or more than one signaling gene mutation detected. C, The number of signaling gene mutations in 22 patients with multiple signaling gene mutations at either MDS or secondary AML. D, Signaling gene mutations could be categorized broadly into three patterns of clonal evolution; (i) those that were acquired during progression from MDS to sAML, (ii) those that persist or expand during progression from MDS to sAML, and (iii) those that were present at MDS and contract prior to sAML progression. Patients exhibited one or more of these clonal evolution patterns, as indicated by the number and percentage of patients at the far right. Mutations were detected by error-corrected and capture sequencing.
Figure 5.
Complex clonal evolution of signaling gene mutations during disease progression is common and a hallmark of patients with multiple mutations. A, The number of MDS patients who had zero, one, or more than one signaling gene mutation detected. B, The number of sAML patients who had zero, one, or more than one signaling gene mutation detected. C, The number of signaling gene mutations in 22 patients with multiple signaling gene mutations at either MDS or secondary AML. D, Signaling gene mutations could be categorized broadly into three patterns of clonal evolution; (i) those that were acquired during progression from MDS to sAML, (ii) those that persist or expand during progression from MDS to sAML, and (iii) those that were present at MDS and contract prior to sAML progression. Patients exhibited one or more of these clonal evolution patterns, as indicated by the number and percentage of patients at the far right. Mutations were detected by error-corrected and capture sequencing.
Figure 6. Association of signaling gene mutations with progression to secondary AML. Signaling gene mutations were determined with the use of error-corrected sequencing at MDS. Patients are grouped according to the presence (yes) or absence (no) of a signaling gene (SG) mutation. The rates of progression to secondary AML in MDS patients with very low/low/intermediate IPSS-R risk MDS (IPSS-R score ≤4.5; A, n = 84) or high/very high IPSS-R risk MDS (IPSS-R score >4.5; B, n = 52) are shown. IPSS-R, International Prognostic Scoring System-Revised.HR, hazard ratio. 95% confidence intervals are shown in brackets.
Figure 6.
Association of signaling gene mutations with progression to secondary AML. Signaling gene mutations were determined with the use of error-corrected sequencing at MDS. Patients are grouped according to the presence (yes) or absence (no) of a signaling gene (SG) mutation. The rates of progression to secondary AML in MDS patients with very low/low/intermediate IPSS-R risk MDS (IPSS-R score ≤4.5; A,n = 84) or high/very high IPSS-R risk MDS (IPSS-R score >4.5; B,n = 51) are shown. IPSS-R, International Prognostic Scoring System-Revised. HR, hazard ratio. 95% confidence intervals are shown in brackets.

Comment in

References

    1. Nimer SD. Myelodysplastic syndromes. Blood 2008;111:4841–51. - PubMed
    1. Swerdlow SH. WHO classification of tumours of haematopoietic and lymphoid tissues. WHO Classification of Tumours 2008;22008:439. - PubMed
    1. Tefferi A, Vardiman JW. Myelodysplastic syndromes. N Engl J Med 2009;361:1872–85. - PubMed
    1. Borthakur G, Lin E, Jain N, Estey EE, Cortes JE, O'Brien S, et al. . Survival is poorer in patients with secondary core-binding factor acute myelogenous leukemia compared with de novo core-binding factor leukemia. Cancer 2009;115:3217–21. - PMC - PubMed
    1. Granfeldt Ostgard LS, Medeiros BC, Sengelov H, Norgaard M, Andersen MK, Dufva IH, et al. . Epidemiology and clinical significance of secondary and therapy-related acute myeloid leukemia: a national population-based cohort study. J Clin Oncol 2015;33:3641–9. - PubMed

Publication types