. 2022 Jul 5;34(7):1064-1078.e6.
doi: 10.1016/j.cmet.2022.05.010. Epub 2022 Jun 15.

Mapping the single-cell transcriptomic response of murine diabetic kidney disease to therapies

Affiliations

Mapping the single-cell transcriptomic response of murine diabetic kidney disease to therapies

Haojia Wu et al. Cell Metab. .

Abstract

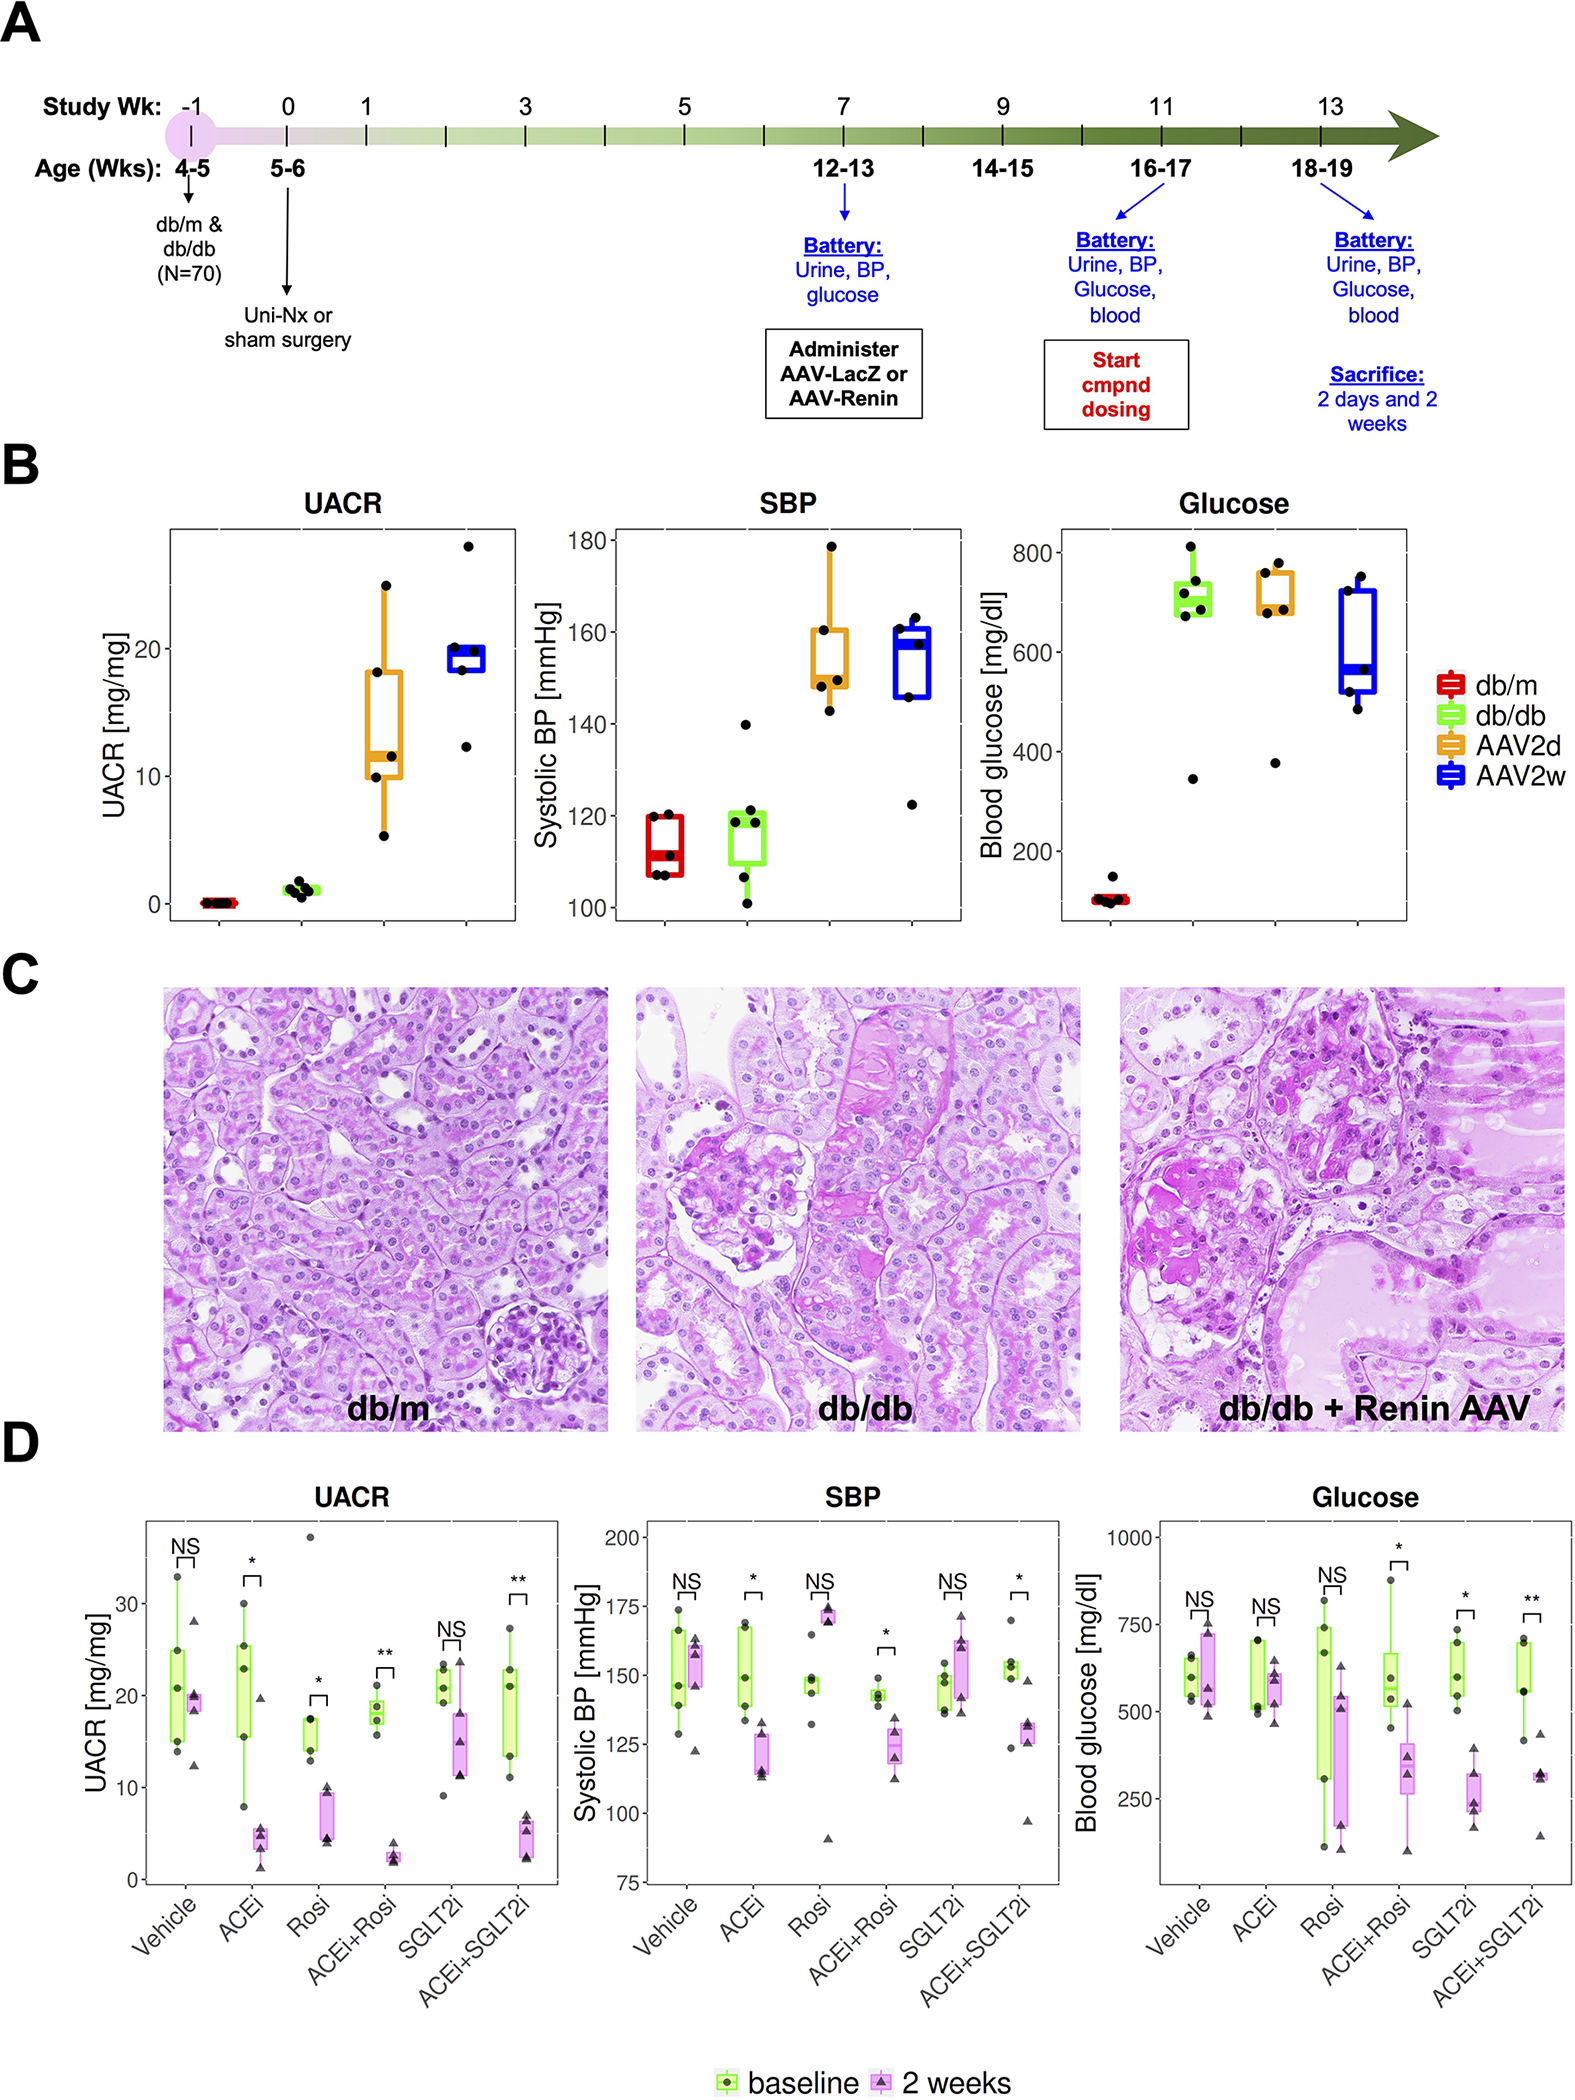
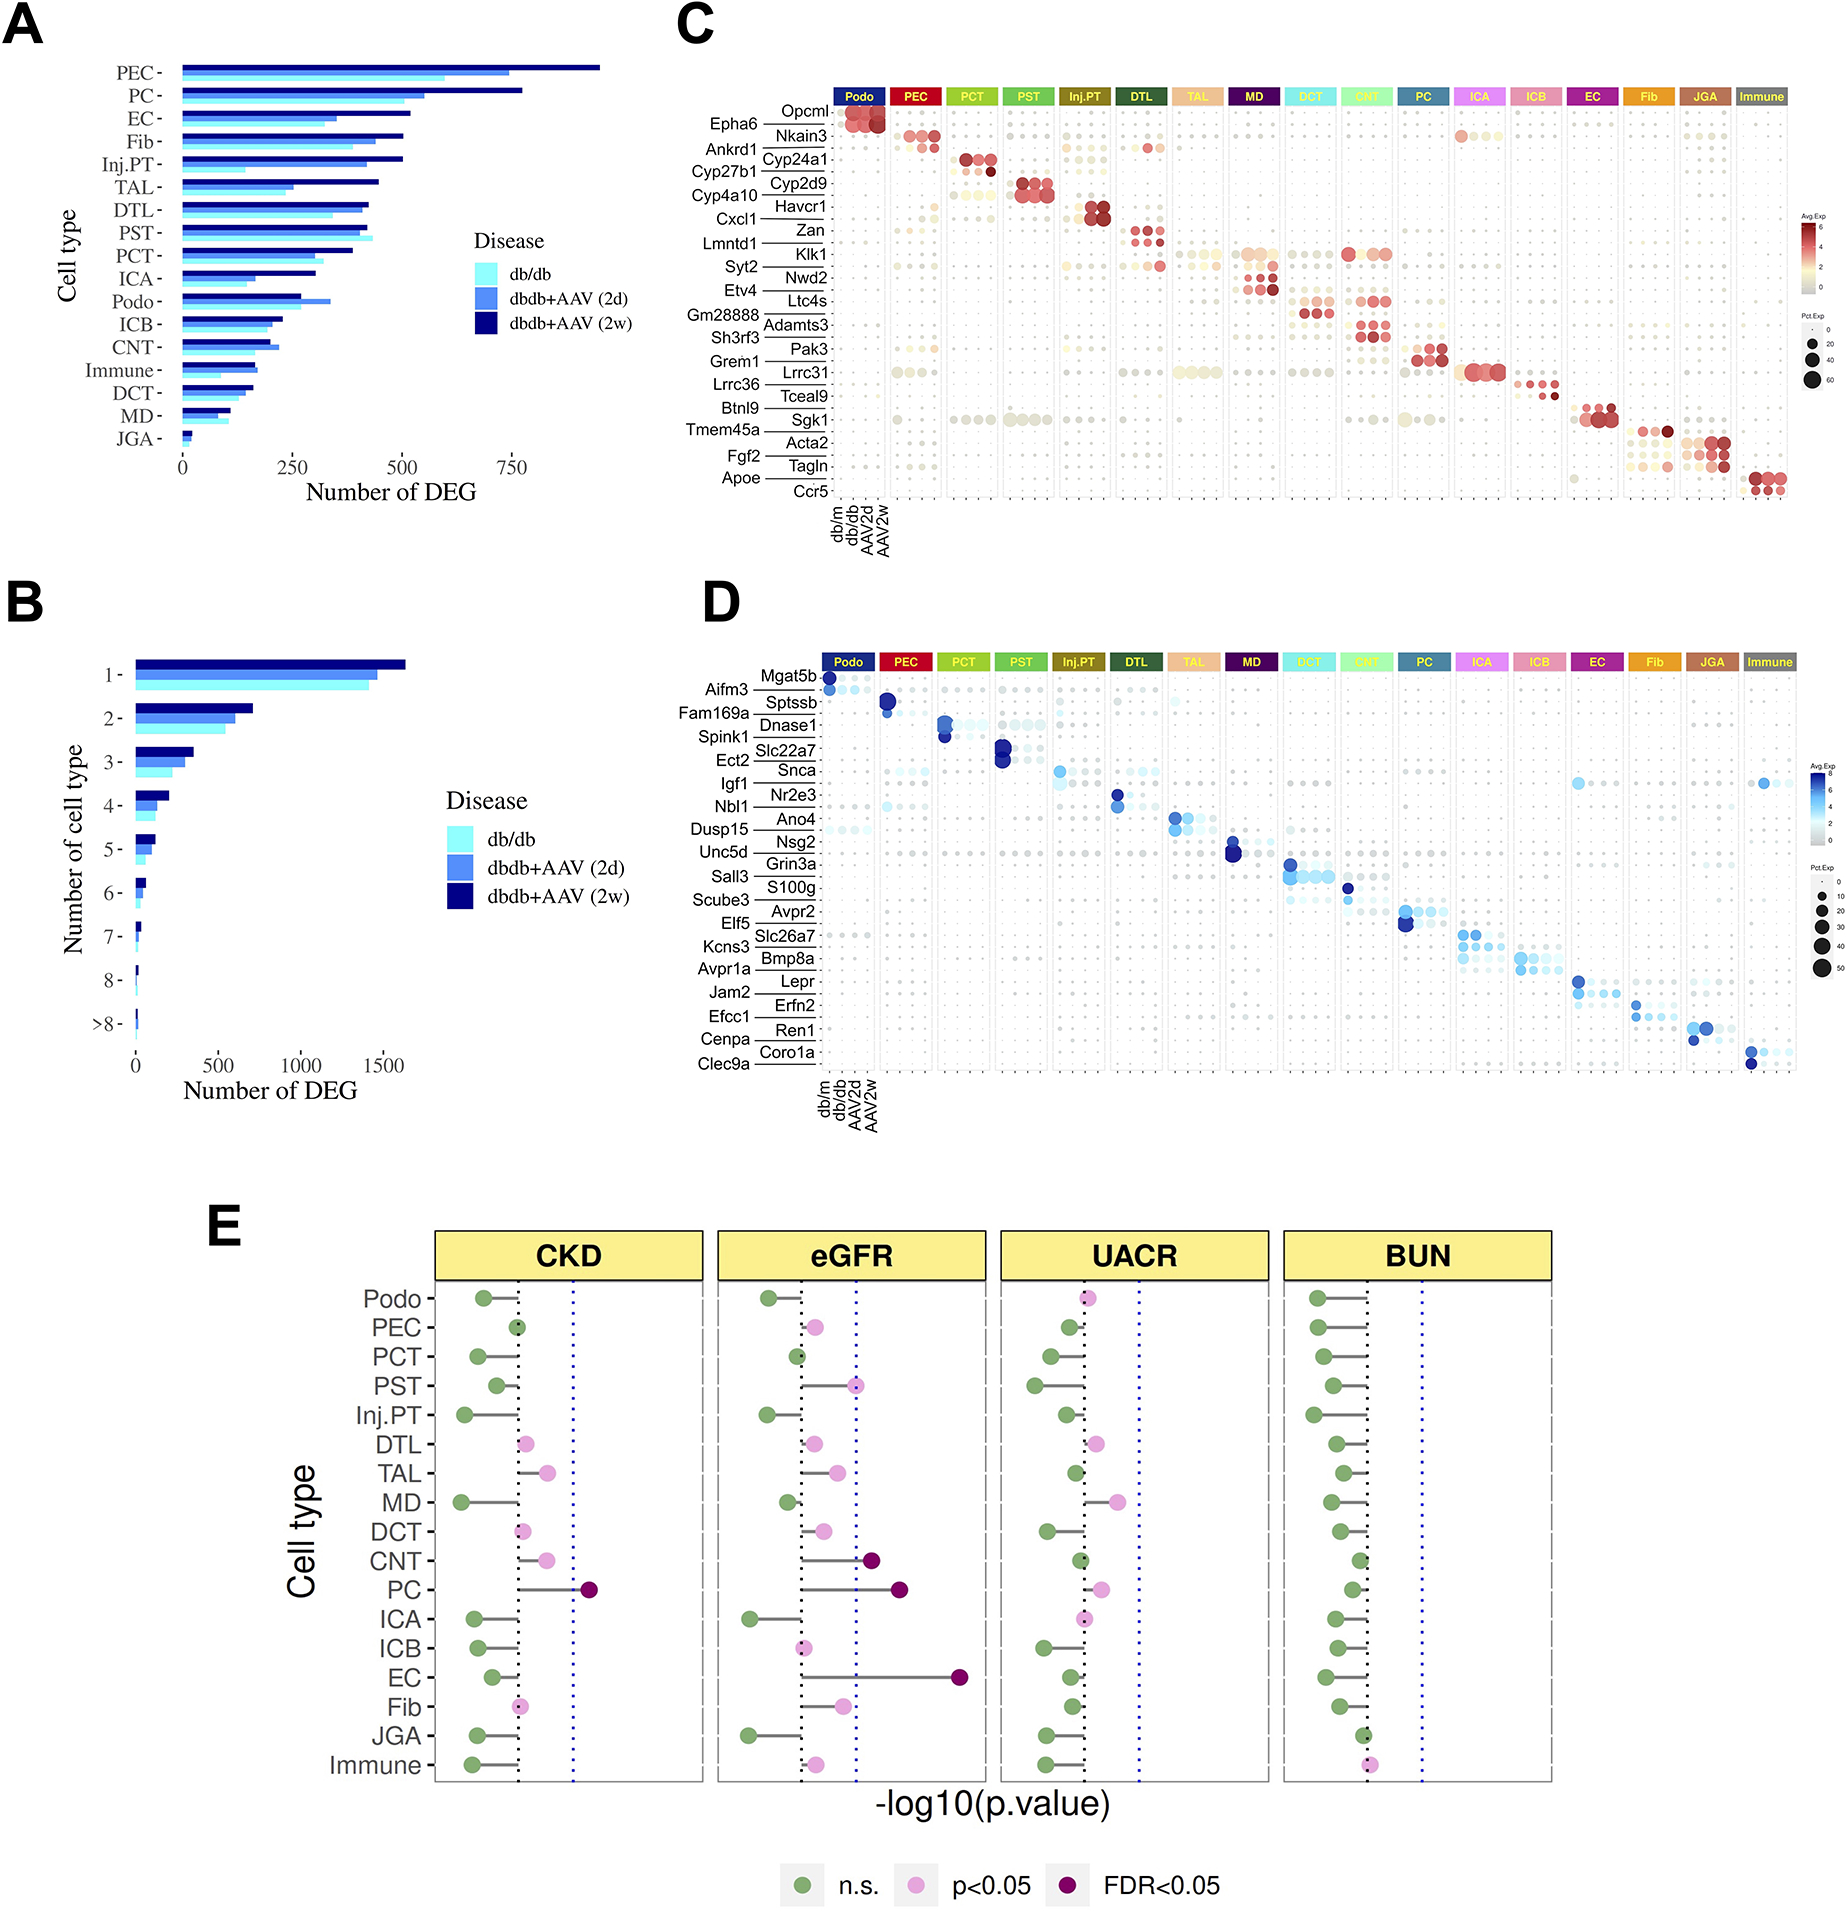
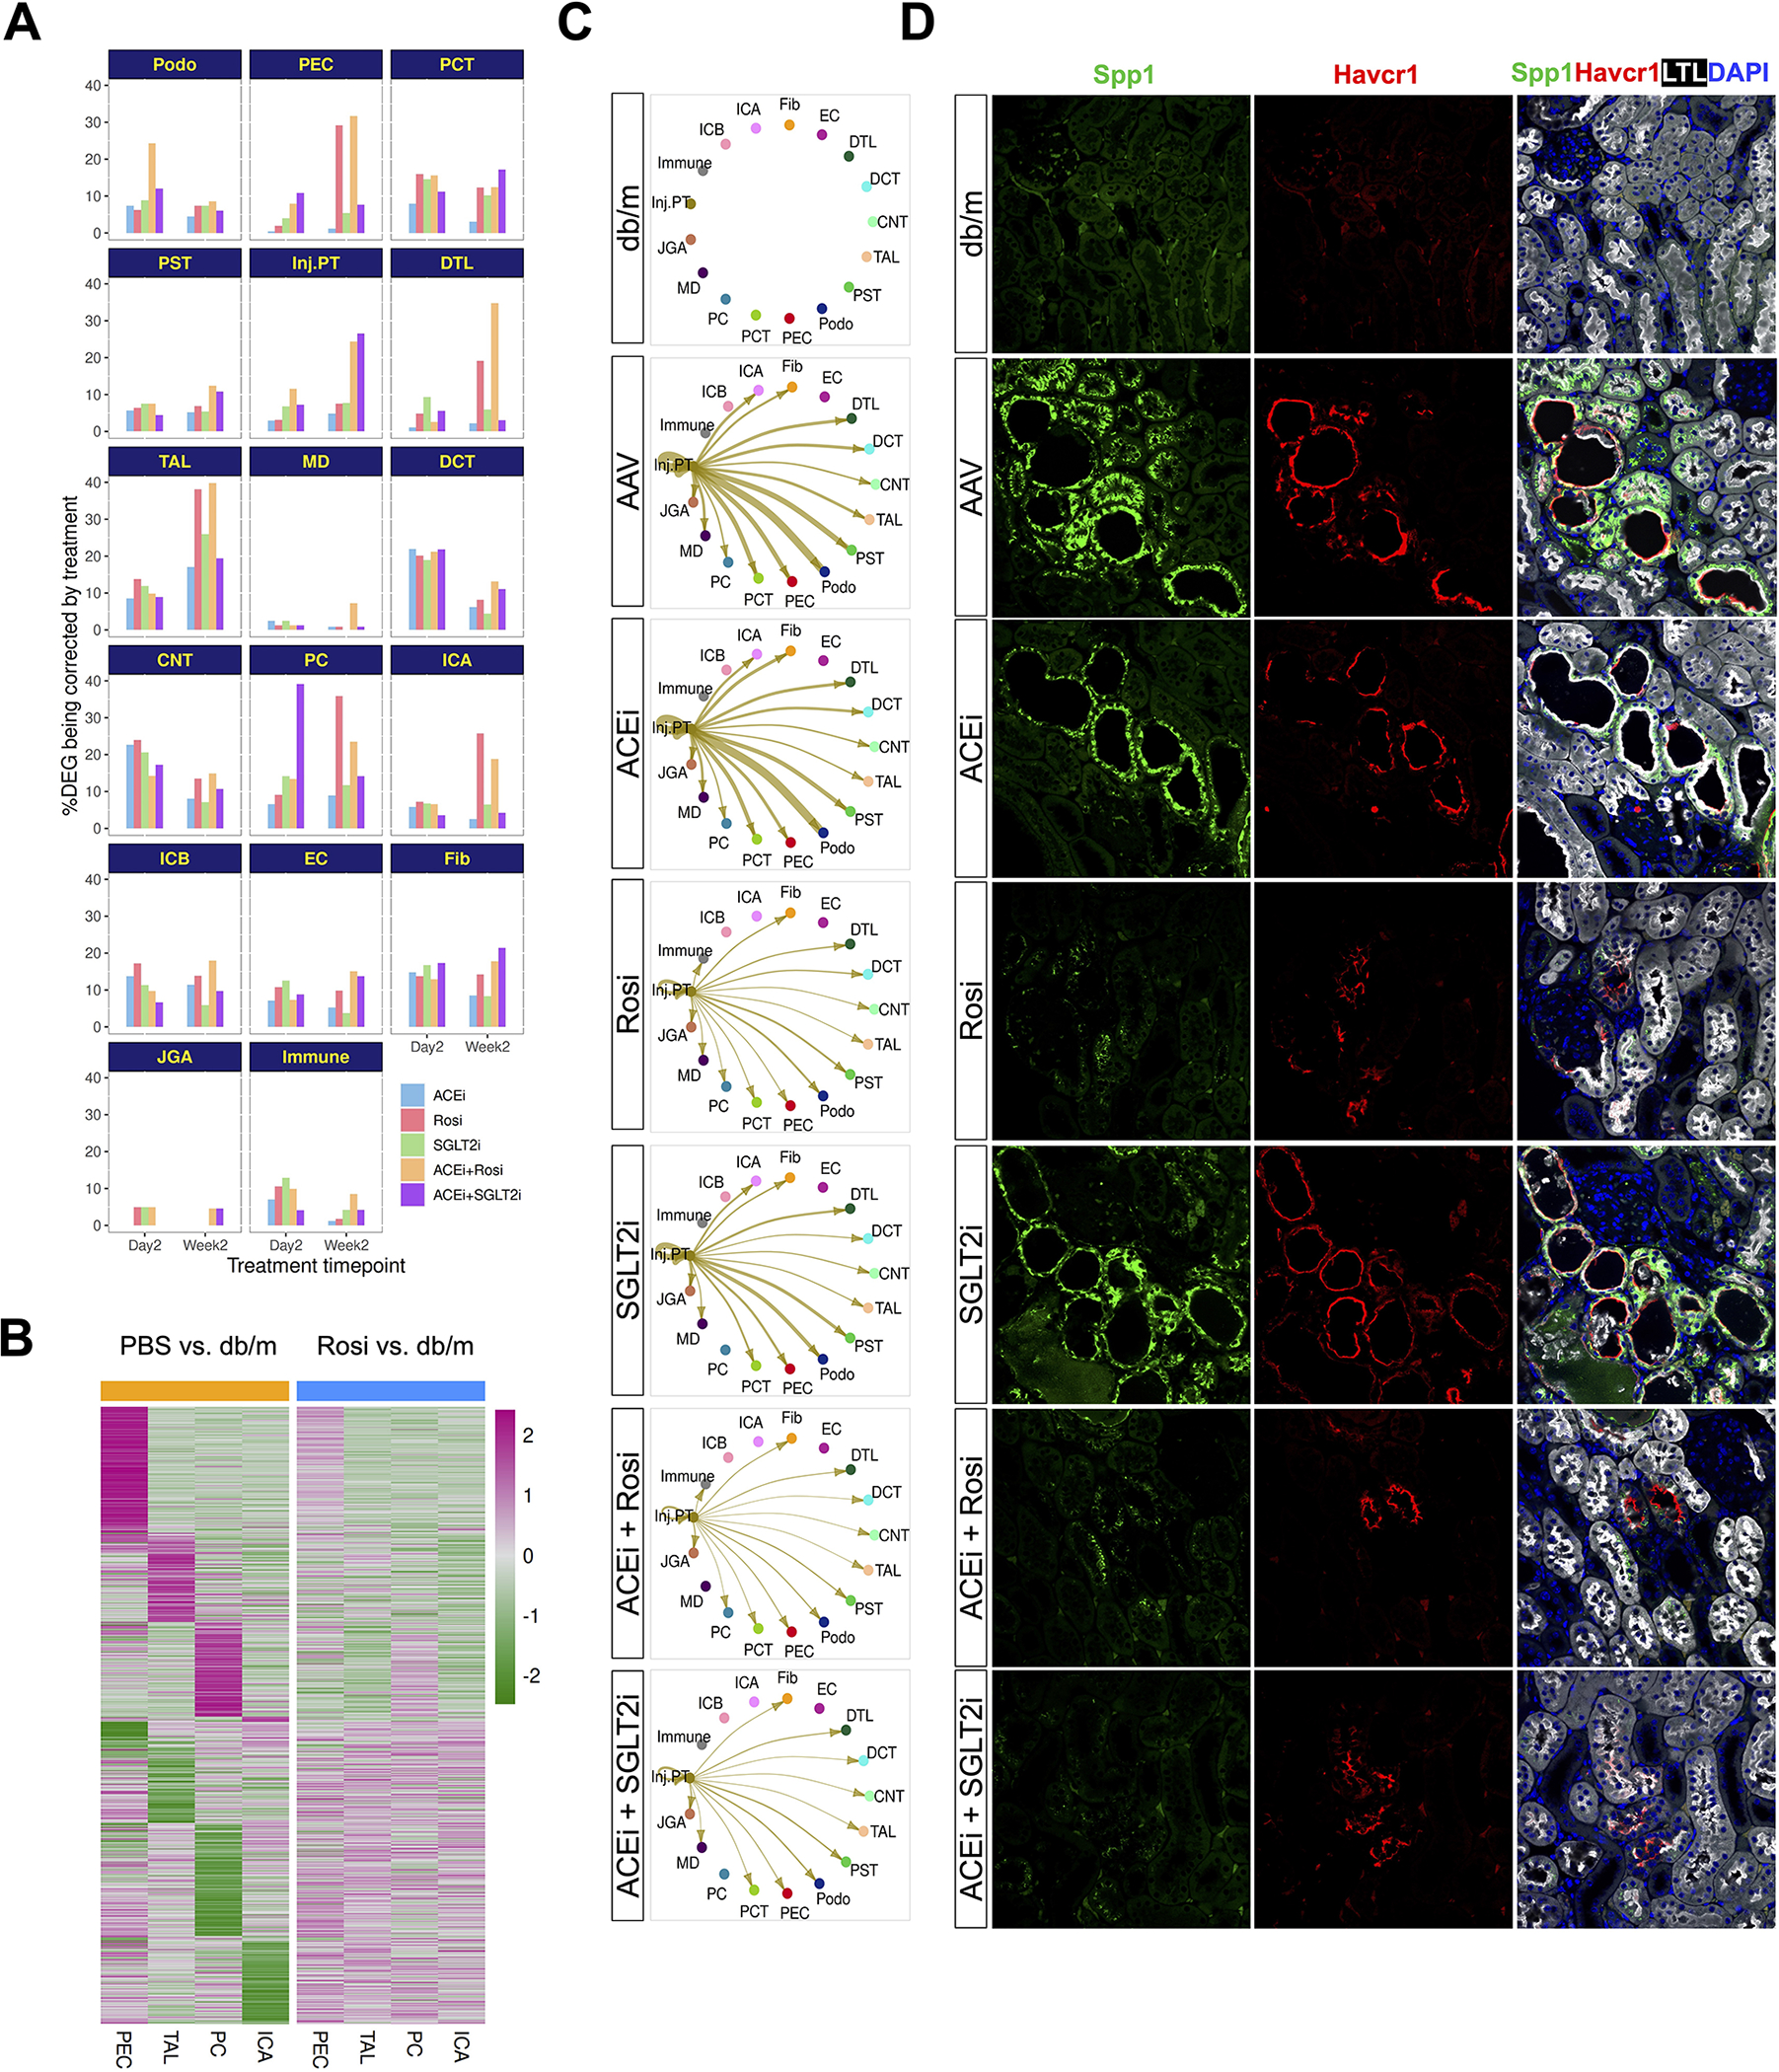
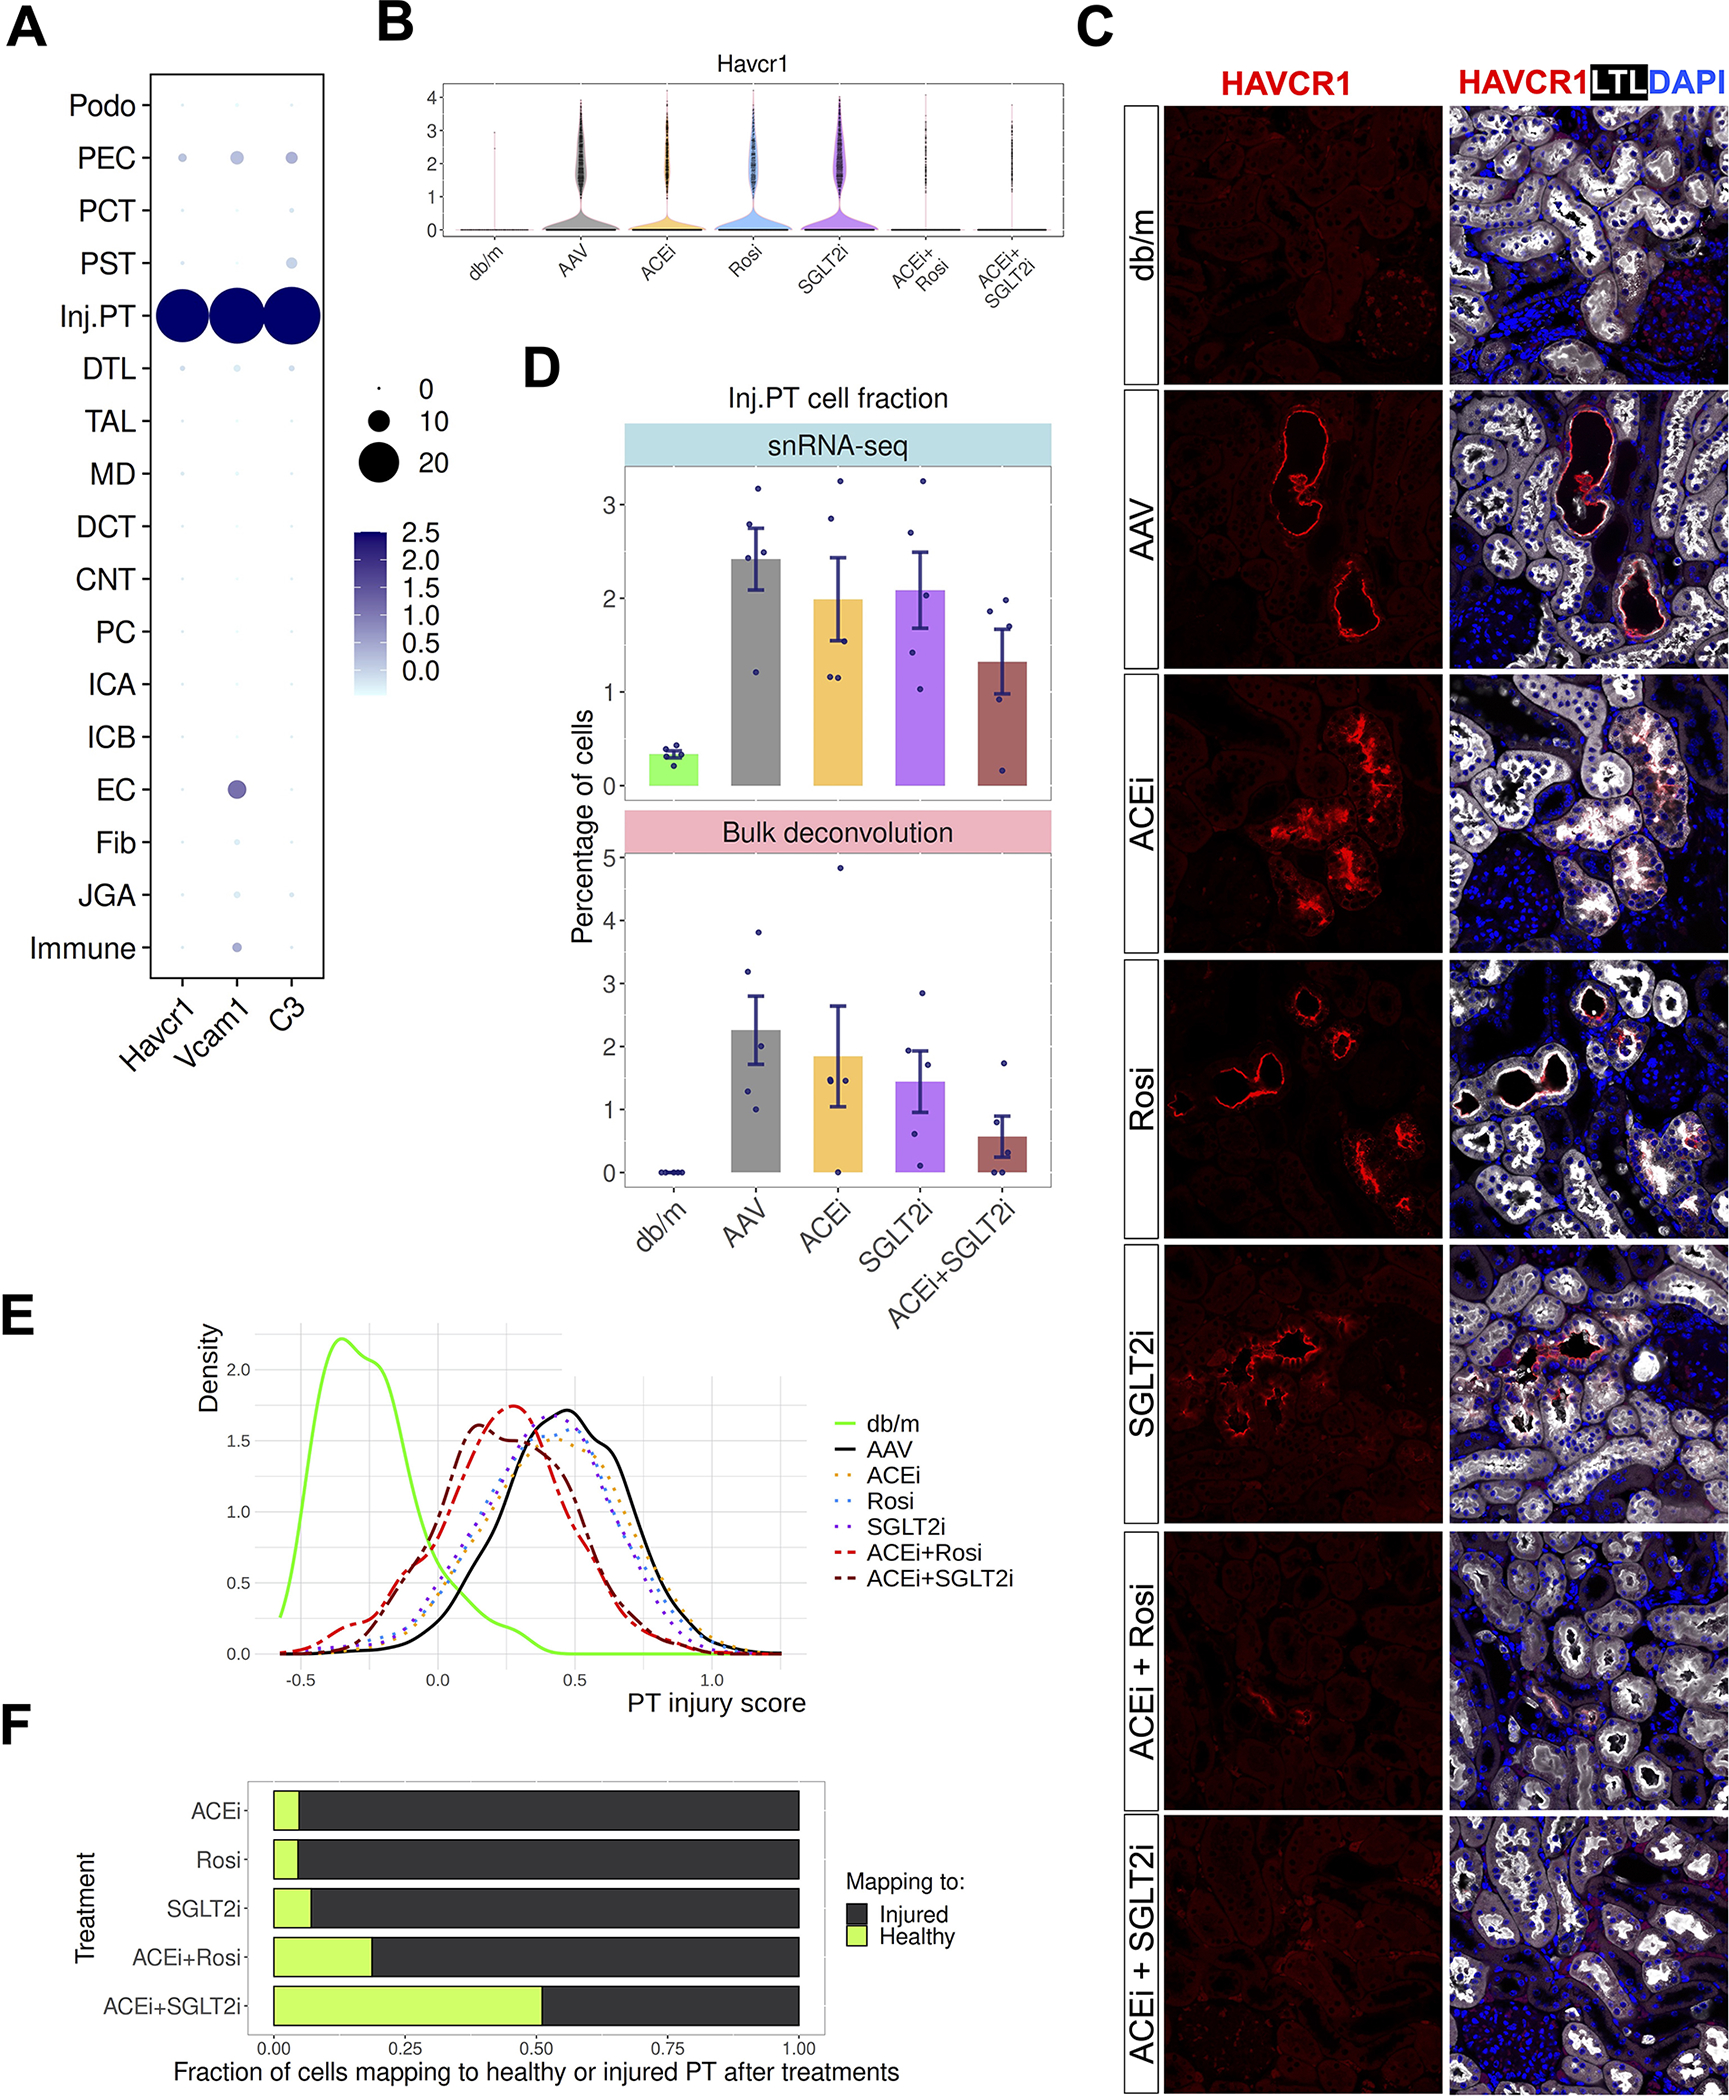
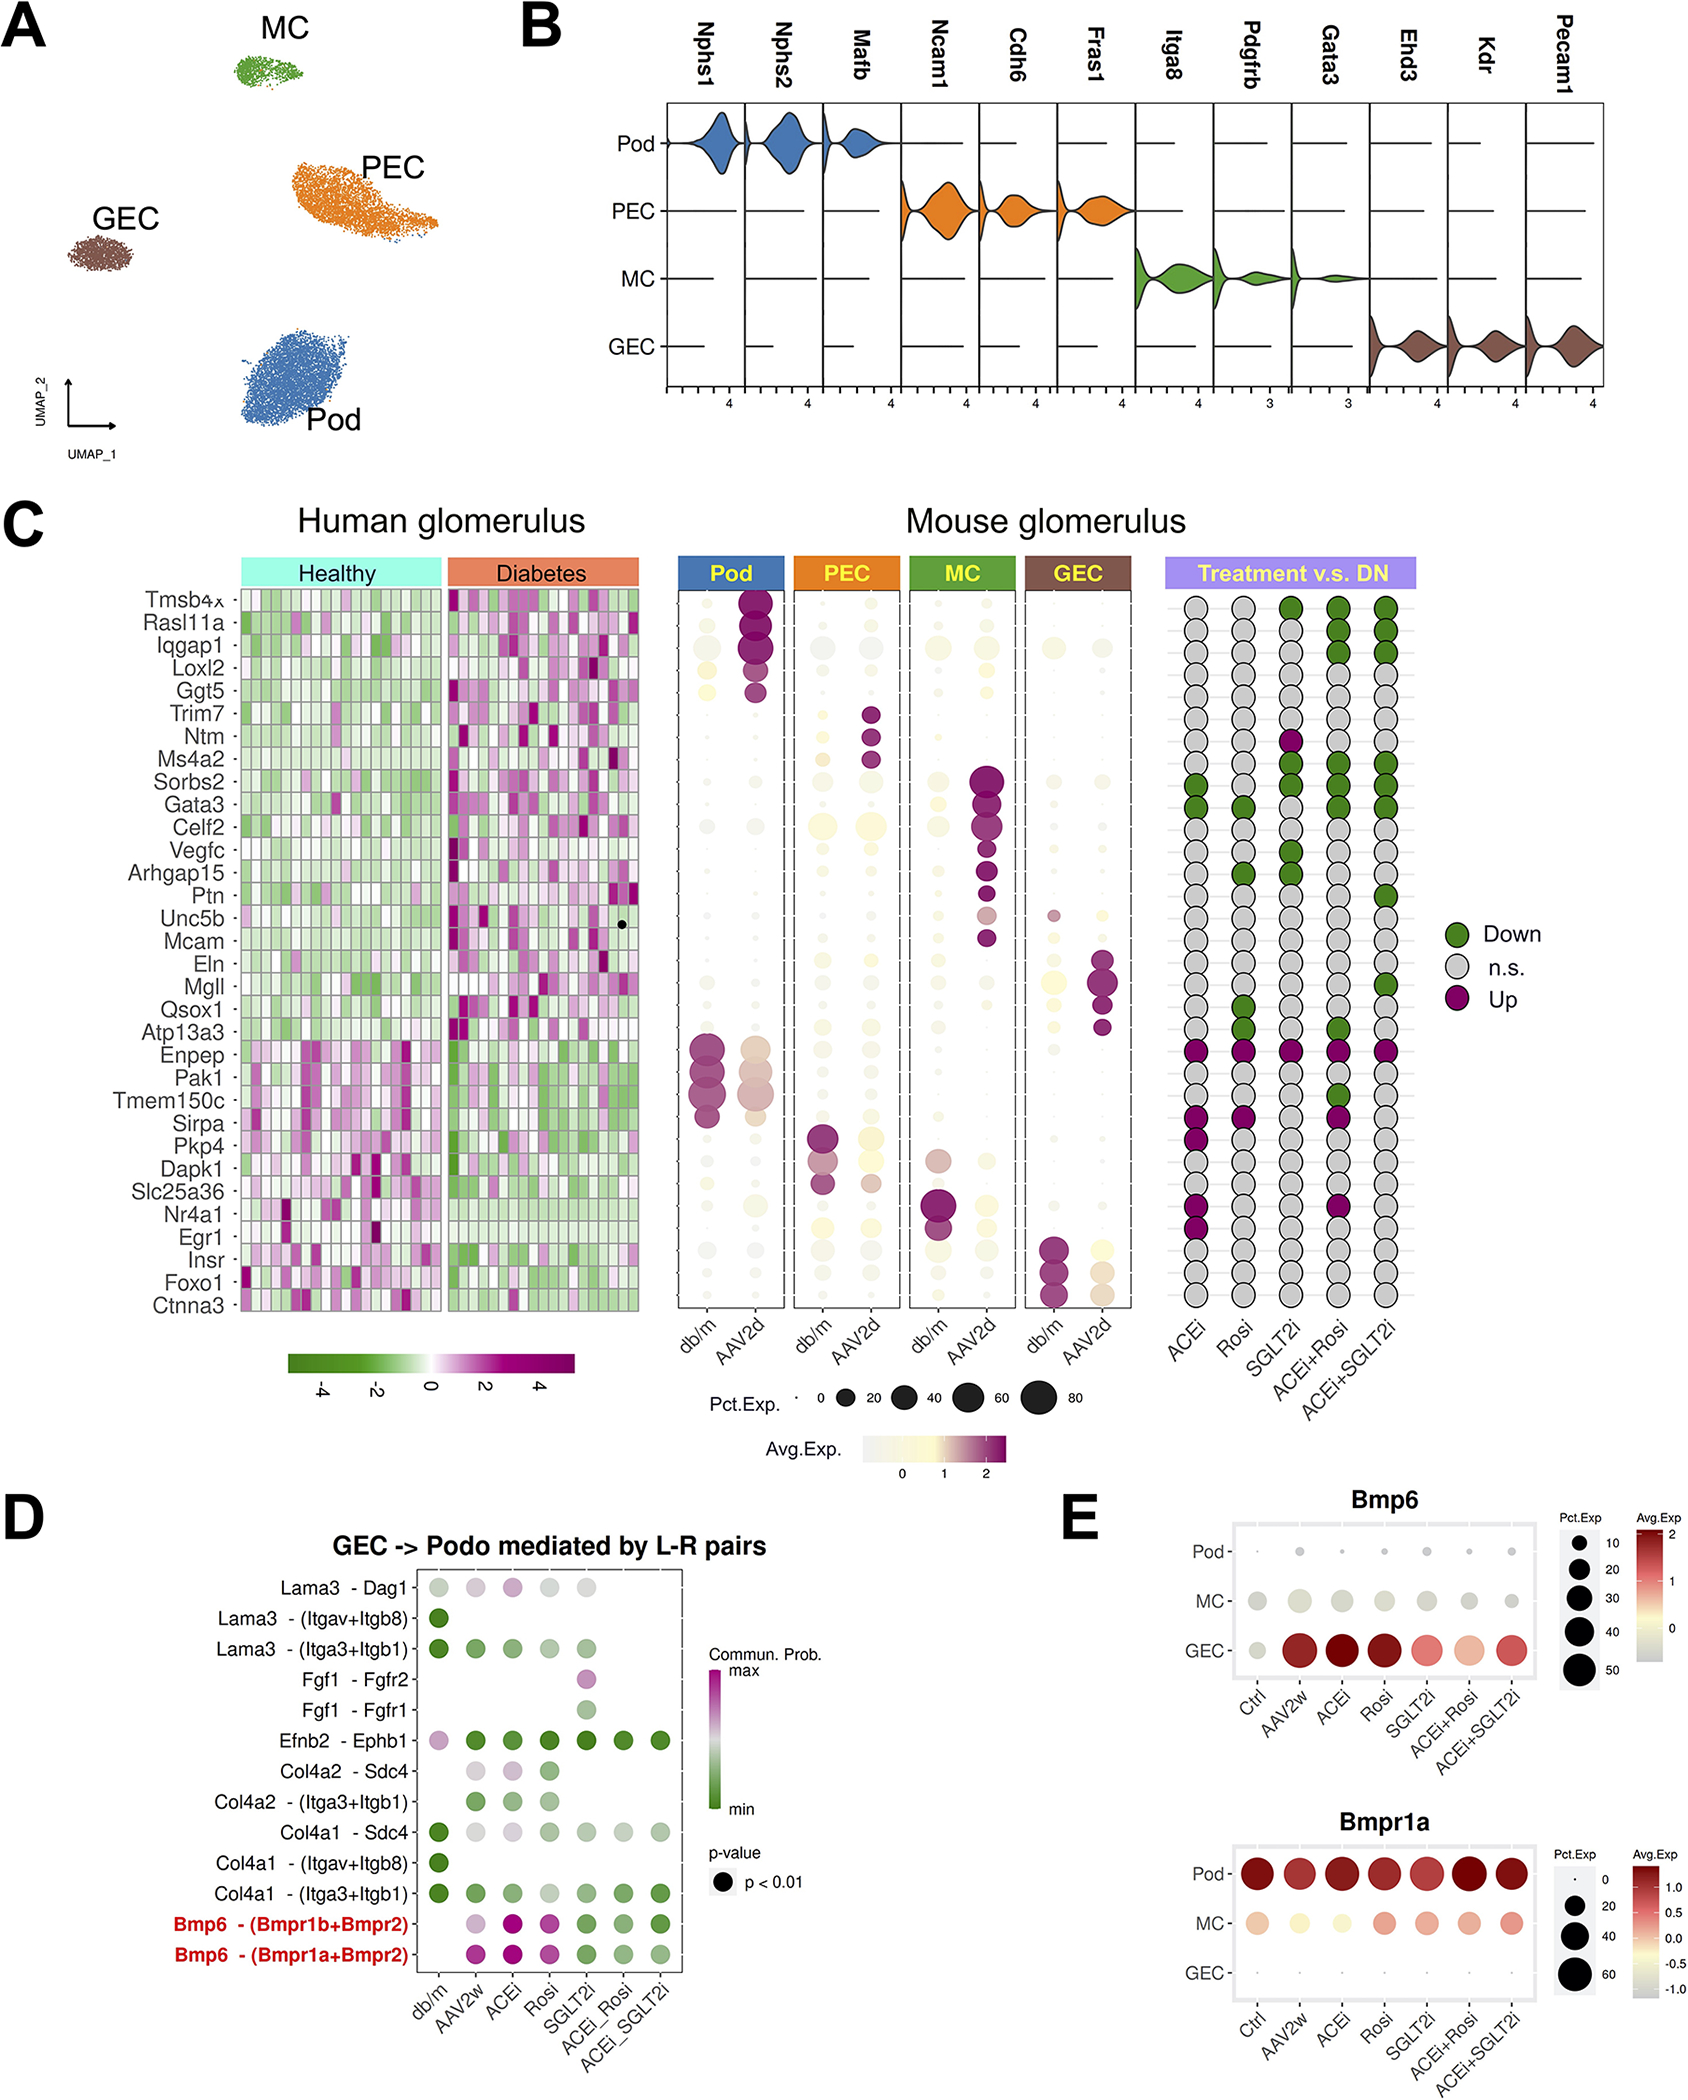
Diabetic kidney disease (DKD) occurs in ∼40% of patients with diabetes and causes kidney failure, cardiovascular disease, and premature death. We analyzed the response of a murine DKD model to five treatment regimens using single-cell RNA sequencing (scRNA-seq). Our atlas of ∼1 million cells revealed a heterogeneous response of all kidney cell types both to DKD and its treatment. Both monotherapy and combination therapies targeted differing cell types and induced distinct and non-overlapping transcriptional changes. The early effects of sodium-glucose cotransporter-2 inhibitors (SGLT2i) on the S1 segment of the proximal tubule suggest that this drug class induces fasting mimicry and hypoxia responses. Diabetes downregulated the spliceosome regulator serine/arginine-rich splicing factor 7 (Srsf7) in proximal tubule that was specifically rescued by SGLT2i. In vitro proximal tubule knockdown of Srsf7 induced a pro-inflammatory phenotype, implicating alternative splicing as a driver of DKD and suggesting SGLT2i regulation of proximal tubule alternative splicing as a potential mechanism of action for this drug class.

Keywords: ACEi; FSGS; SGLT2i; T2D; chronic kidney disease; diabetes; drug response; hypertension; kidney; rosiglitazone; single-cell RNA-seq.


Conflict of interest statement

Declaration of interests R.G.V., X.Y., D.R., T.C., M.R., C.M., E.M., and M.D.B. are employees of Janssen Research & Development, LLC. M.D.B. holds Johnson and Johnson stock. B.D.H. is a consultant for Janssen Research & Development, LLC, Pfizer, and Chinook Therapeutics. B.D.H. holds equity in Chinook Therapeutics.

Figures

Figure 1.
Figure 1.. Experimental plan, histology and physiologic readouts.
(A) Experimental scheme. (B) Urinary albumin to creatinine ratio (UACR), systolic blood pressure (SBP) and glucose in control (db/m), db/db or db/db plus Renin-AAV at two days and two weeks. (C) Hematoxylin and eosin (H&E) staining at two weeks across groups. (D) Effect of treatment on UACR, SBP and glucose at baseline and two weeks. * adj. p<0.05; ** adj.p < 0.01 (paired t-test, multiple comparisons with Benjamini-Hochberg correction).
Figure 2.
Figure 2.. Single cell atlas of drug treatments in a mouse model of DKD.
A total of 946,660 high-quality cells from 70 mouse kidneys in 14 different groups are projected by UMAP plot. Colors indicate the major kidney cell types, and cluster boundaries are outlined by contour curve. The four corner insets show subclusters of endothelial cells, immune cells, fibroblasts and thick ascending limb of Loop of Henle (TAL). The axis outside the circular plot depicts the log scale of the total cell number for each cell class. The four colored tracks (from outside to inside) indicate class (colored as the central UMAP), group ID, mouse ID, and marker gene expression. Legends denote the group design (left) and marker genes (right) to define each cell class. The left legend shows the group ID/colors for the group ID track. The right legend shows marker genes/colors used for the marker track.
Figure 3.
Figure 3.. DN disease genes corrected according to treatment and heritability enrichment for kidney disease traits in DKD.
(A) Number of DE genes induced during DKD according to cell type. Bar colors indicate different comparisons: light blue: db/db vs db/m; medium blue: AAV 2d vs db/m; and dark blue: AAV 2w vs db/m. (B) Number of genes detected in only one cell type vs. detected in multiple cell types. (C) Dotplot depicting top two cell-specific, upregulated genes during DKD. (D) Same plot depicting top two down-regulated genes during DKD. (E) Gene hits from GWAS traits related to CKD, UACR and eGFR were mapped to DKD cell states at two weeks. The dashed blue line denotes Bonferroni-adjusted significance (p=0.05/17).
Figure 4.
Figure 4.. Differentially expressed genes normalized by treatment according to cell type and cell-cell communication between injured proximal tubule and other cell types.
(A) Percentage of DEG induced by diabetes rescued by treatment according to cell type. (B) Heatmap of gene expression changes in PEC, TAL, PC and ICA at week 2 in PBS (left) vs. Rosi (right). (C) Cell communication network from injured proximal tubule to other cell types at two days, and amelioration of signaling by treatment. Cell-cell communication network quantifies signaling strength of injured proximal tubule-derived osteopontin (Spp1) to all other cell types according to treatment. (D) Immunofluorescence analysis of Spp1 expression in disease and drug treatments (day 2). Cells were co-stained with PT (LTL, white) and Injured PT (Havcr1, red) markers.
Figure 5.
Figure 5.. Superiority of combination therapies in ameliorating proximal tubule injury responses.
(A) Specific expression of injury genes Havcr1, Vcam1 and C3 in the injured PT subcluster. (B) Expression of injured PT marker Havcr1 in disease and after week2 treatments. (C) Validation of the Havcr1 expression by immunofluorescence staining. Cells were co-stained with PT marker (LTL, white). (D) Percentage of injured PT across the week 2 groups by single cell quantification (upper) and bulk RNA-seq deconvolution. Each dot is an individual mouse. (E) Density plot to show the injury scores across groups. Cells were scored by the top 50 upregulated genes from injured PT in comparing Renin-AAV vs db/m. (F) Fraction of cells after treatment mapping to healthy or disease state as measured by scID.
Figure 6.
Figure 6.. Glomerular communication networks in diabetes and its treatment.
(A) Reclustering of the glomerular cells. (B) Cell specific marker genes define glomerular subtypes. (C) Human glomerulus DKD genes mapped to mouse glomerulus cell types. The left heatmap shows bulk glomerulus expression in healthy vs. DKD. The dot plot in the middle assigns those same genes to mouse glomerulus cell types. The dot plot on the right shows that some of these genes are normalized by therapy. (D) Ligand-receptor scoring for glomerular endothelial cell signaling to podocytes. (E) Bmp6 and its receptor Bmpr1a expression in glomerulus during diabetes and its treatment.
Figure 7.
Figure 7.. Effects of SGLT2 inhibitors on the S1 vs. the S2 segment.
(A) Reclustering of the PCT into S1 and S2 segments. (B) Density plot showing that Slc5a2 expression is limited to the S1 segment. (C) Upset plot showing the diabetes-specific DEGs that are rescued by each treatment, divided according to whether they are unique to each treatment or shared across treatments. (D) Expression of Srsf7 in S1 and S2 across the day2 groups. (E and F) Knockdown efficiency of siRNA as corroborated by qPCR and western blot. (G) Volcano plot showing the differential genes in the comparison of Srsf7 siRNA and scramble. (H) Enriched pathways from gene ontology analysis. NES: normalized enrichment score. (I and J) Expression of the selected genes in RPTECs and mouse model. All selected genes are DEGs identified by comparing Srsf7 siRNA versus scramble in RPTECs, AAV versus db/m and drug treatments versus AAV in mouse PT-S1.

References

    1. Aibar S, González-Blas CB, Moerman T, Huynh-Thu VA, Imrichova H, Hulselmans G, Rambow F, Marine J-C, Geurts P, Aerts J, et al. (2017). SCENIC: single-cell regulatory network inference and clustering. Nat Methods 14, 1083–1086. - PMC - PubMed
    1. Alexa A, Rahnenführer J, and Lengauer T (2006). Improved scoring of functional groups from gene expression data by decorrelating GO graph structure. Bioinformatics 22, 1600–1607. - PubMed
    1. Anekal PV, Yong J, and Manser E (2015). Arg Kinase-binding Protein 2 (ArgBP2) Interaction with α-Actinin and Actin Stress Fibers Inhibits Cell Migration. J Biol Chem 290, 2112–2125. - PMC - PubMed
    1. Bansal A, Balasubramanian S, Dhawan S, Leung A, Chen Z, and Natarajan R (2020). Integrative Omics Analyses Reveal Epigenetic Memory in Diabetic Renal Cells Regulating Genes Associated With Kidney Dysfunction. Diabetes 69, 2490–2502. - PMC - PubMed
    1. Boufea K, Seth S, and Batada NN (2020). scID Uses Discriminant Analysis to Identify Transcriptionally Equivalent Cell Types across Single-Cell RNA-Seq Data with Batch Effect. IScience 23, 100914. - PMC - PubMed

Publication types

MeSH terms

Substances